Over the past few decades, considerable efforts have been devoted to not only writing superfluous and gaudy publication abstracts, but improving graduate school success rates, generally typified by submitting even more superfluous and gaudy publication abstracts. For the study of materials science and engineering (MS&E), the quantification of success levels in graduate programs has, in recent years, become a highlight for analysts and advertisers employed by alumni association trackers, pharmacologists who manufacture psychotropic medications, and support group networks.
Recently, favorable metrics have tracked the sale of optimistic self-help books as a means of attempting success quantification; however, this methodology has largely been disavowed in favor of rank categorization of individual and situational characteristics. This work, building upon recent experimental studies in predictive analyses, devises a research formalism for user-enabled autonomous classification of grad success, employing a design criteria and calculation summary of the modified hyperbeta distribution that correlates success percentage to notable, inherent lifestyle traits. Population estimates generated results that were in harmony with global graduate school matriculation rates, with an accuracy metric of η = 93.3%, which would prevent such work from being discredited in the near future.
Introduction
A plurality of sources, from human resources workshops to books with the title formula of “How to [positive adverb] [positive verb] [preposition] graduate school” with some subtitle that usually includes an ironic twist (not to mention an author suffix with MD or PhD in large letters), have attempted to motivate idyllic undergraduates and weary industry veterans to pursue graduate school, converging upon the following abridged hard truth: “for a less-than-minimum-wage paycheck and years of emotional abuse through a ludicrous work routine, you can justify your many addictions and join a type of fraternity of experts who’ll hire you for a lot of money based on the credentials you’ll undoubtedly earn, because you’ve earned the right to command authority.”
Success rates genuinely seem to correlate with those candidates who embrace work autonomy, possible sci-fi interest, STEM-based intelligence and competence, and especially technical proficiency.Reference D’Angelos, Tsakalis-Demetrios and Thompson1 MS&E, while requiring good aptitude in memorizing a collection of common inorganics (M.C. Escher-style tessellations written in microtype) and mineral groups, generally does not differ too much from other disciplines where advisor compatibility, commitment to a research project, and proficiency for reading and writing are essential qualitative factors that undoubtedly characterize success rates.Reference Kim, Kim, Gallo and Smith2 However, a rediscovered work by Blackburne et al.Reference Blackburne, Claude, Cui and Saygun3 provided a means to establish a quantifiable metric to capture graduate success more effectively based on the tabulation of observational data trends.
Based on classification of data from collegiate sources of graduate profiles, a statistical formalism is provided here for readers to be able to capture their own success probability in a quantifiable manner, based on the modified hyperbeta “Karasian” distribution. To no consternation of the author, the dissemination of a success model that is not characterized with dependence on inherent classifications (race, color, religion, sex, sexual orientation, gender identity, national origin, veteran/ disability status) or user willingness to engage in illegal practices (gambling in the hopes to satisfy tuition payments, pirating textbooks) is considered a superlative feature in order to avoid angry letters from random readers, likely undergraduates attending one of the schools in the University of California system with too much time on their hands.
Calculation summary
An approximated data model was devised according to a derivation provided by Venrasimharaviswanathanjuvaripeta et. al.Reference Venrasimharaviswanathanjuvaripeta, Jackson and Perry4 using fits to multivariate models that assessed graduate student levels of neuroticism, masochism, and other lifestyle attributes that could be collected according to a redistributed survey.
Solving for personalized equation coefficients
Step 1: Coefficient of Neuroticism, Self-Assignment (0–1)
This metric, while user-defined for the purposes of this study, intends to characterize the extent of stress, hypertension, obsession, and anxiety, without the introduction of more advanced psychosis. This is the N variable, which extends to any non-integer value between 0 and 1, where a value of 0 indicates complete withdrawal from all human interaction, and a value of 1 indicates severe neurosis bordering on maniacal counterfactualism.
Step 2: Coefficient of Masochism, Self-Assignment (0–1)
The notion of masochism as a personality trait, as defined herein, is contrasted to that of sexual masochism according to a study by Ping et. al.Reference Ping, Watson and Pong5 This is self-assigned as the M variable, which extends to any non-integer value between 0 and 1, where a value of 0 indicates a completely sadistic personality, and a value of 1 indicates the candidate will be a postdoc forever.
Step 3: Determining the Questionnaire Index (0–1)
With such suggested values gleaned by Simblem et al.,Reference Simblem and Yerek6 the formulation of the questionnaire index x is determined by obtaining a score from the following miniature quiz. Start with the personality-based questionnaire with x = 50 points!
If you …
• have one or more solitary hobbies, add 5.
• play video games more than two times a week, subtract 3.
• have more than two siblings, add 2. If you still live at home, subtract 8.
• study meditation, add 4.
• enjoy mechanical watches, add 2.
• own a pet, add 1. If your pet is three or more cats, subtract 4.
• consider yourself a fan of 20 or more media franchises, add 3. If they’re mostly from TV and films rather than books and radio, subtract 7.
• work out more than two times a week, add 5. If your gym routine involves use of the squat rack for every workout, subtract 9.
• read scientific books, articles, and/or news releases for fun, add 9.
• can name more than 30 elements in the periodic table, add 5.
If you’ve ever …
• purchased a self-help book, subtract 5. (This article doesn’t count.)
• written “slam” poetry, add 2.
• gotten excited about conversations involving computers, add 3.
• laughed at a television commercial, subtract 5.
• written your zip code suffix on a personal letter, add 3.
• attended a non-technical convention, subtract 3.
• lived with a spouse or significant other who puts up with you, add 2.
• had staunch political views, subtract 4.
• competed in more than one trivia night, add 2.
Divide your final score by 100. This is the number used for the questionnaire index, x.
Calculating grad success probability
With the use of the three numbers tabulated (N, M, x), the modified hyperbeta distribution, or Karasian distribution, can be calculated, according to a model derived from consolidated experimental findings from Van Kleeck et al.Reference Van Kleeck, Wyatt, D’Argento and Shayda7 Ordinarily, the total distribution would span a questionnaire index range bounded by x = [0, 1], though inserting values (N, M, x) into the provided model yields a single-value success percentage characterized by Ks(x;a,b), where a = a(N) and b = b(M).
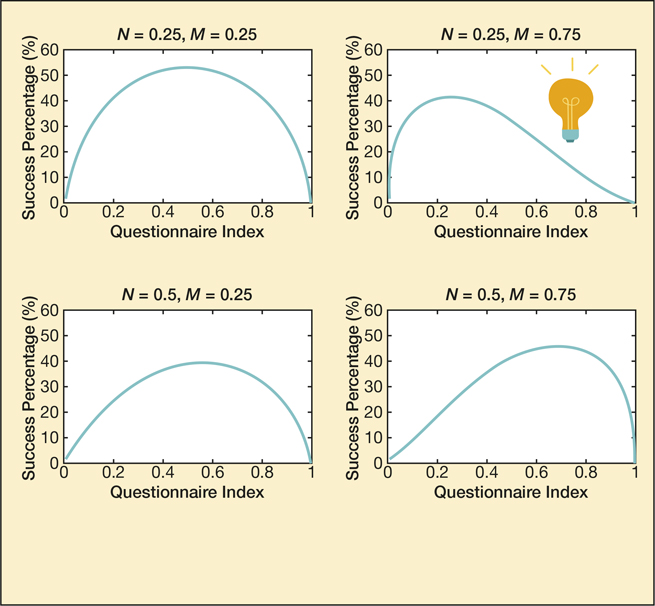
Parametric analyses of the Karasian (Equation 2) are given in Figure 1 for various choices of (N, M) pairs, where Γ is the gamma distribution and β is the beta distribution. It is noted that if any calculations herein are difficult for the prospective graduate candidate, they should instead rank their grad success rate at 8.1 ± 0.7% and avoid the trouble of performing the aforementioned calculation, and probably reading the rest of the article. Luk et al.Reference Luk, Zhèir and Zhan-Gouy8 provides a source that the author thought was relevant that kind of mentioned the value with a separate experimental detail, so it’s placed here so as to increase the span of the References section.
Figure 1. Varying scale and shape profiles (N, M) of the Karasian distribution Ks, where the questionnaire index spans x = [0, 1].
Results and discussion
According to the data trends provided in Figure 1, distinguishing ordinal categorical levels of neuroticism and masochism index are generalized (lower, medium, higher) for the results of the modified Karasian distribution, revealing the possible maximum value of attainable graduate success. While informally considered genetically favorable for graduate-level matriculation in most variants of academia, higher extent of neuroticism and masochism was demonstrated to be inversely proportional to graduate success by an approximate 25% reduction. Extreme levels of neuroticism favored lower questionnaire index ranking and vice versa for higher masochistic ranking. While it is conjectured that graduate student drop-off and suspension rates were possibly not classified in data summaries obtained from those institutions surveyed, the findings may classify such higher rates to correlated success deficiencies. Future research will strategically attempt to explain data trends more formally and ensure that the content that did not meet the article’s hypothesis will be mentioned in the results section. Oh, and here’s another source for good measure,Reference Tzander-Petiev, Zhao, Bullion and Wang9 in case the advisor wants more.
Conclusion
This work has detailed an approach of assessing observational and experimental data trends from reliable sources, detailing a model based on the flexibility of the Karasian distribution. A facile approach to calculating user-generated data to a statistical success index is defined, where most values do not typically exceed 60%. This paragraph has intended to summarize all of the above findings in an authoritative way, disseminating a few numbers here and there, with the assumption that only this and the abstract will be read in its entirety.


 You have
Access
You have
Access
Over the past few decades, considerable efforts have been devoted to not only writing superfluous and gaudy publication abstracts, but improving graduate school success rates, generally typified by submitting even more superfluous and gaudy publication abstracts. For the study of materials science and engineering (MS&E), the quantification of success levels in graduate programs has, in recent years, become a highlight for analysts and advertisers employed by alumni association trackers, pharmacologists who manufacture psychotropic medications, and support group networks.
Recently, favorable metrics have tracked the sale of optimistic self-help books as a means of attempting success quantification; however, this methodology has largely been disavowed in favor of rank categorization of individual and situational characteristics. This work, building upon recent experimental studies in predictive analyses, devises a research formalism for user-enabled autonomous classification of grad success, employing a design criteria and calculation summary of the modified hyperbeta distribution that correlates success percentage to notable, inherent lifestyle traits. Population estimates generated results that were in harmony with global graduate school matriculation rates, with an accuracy metric of η = 93.3%, which would prevent such work from being discredited in the near future.
Introduction
A plurality of sources, from human resources workshops to books with the title formula of “How to [positive adverb] [positive verb] [preposition] graduate school” with some subtitle that usually includes an ironic twist (not to mention an author suffix with MD or PhD in large letters), have attempted to motivate idyllic undergraduates and weary industry veterans to pursue graduate school, converging upon the following abridged hard truth: “for a less-than-minimum-wage paycheck and years of emotional abuse through a ludicrous work routine, you can justify your many addictions and join a type of fraternity of experts who’ll hire you for a lot of money based on the credentials you’ll undoubtedly earn, because you’ve earned the right to command authority.”
Success rates genuinely seem to correlate with those candidates who embrace work autonomy, possible sci-fi interest, STEM-based intelligence and competence, and especially technical proficiency.Reference D’Angelos, Tsakalis-Demetrios and Thompson1 MS&E, while requiring good aptitude in memorizing a collection of common inorganics (M.C. Escher-style tessellations written in microtype) and mineral groups, generally does not differ too much from other disciplines where advisor compatibility, commitment to a research project, and proficiency for reading and writing are essential qualitative factors that undoubtedly characterize success rates.Reference Kim, Kim, Gallo and Smith2 However, a rediscovered work by Blackburne et al.Reference Blackburne, Claude, Cui and Saygun3 provided a means to establish a quantifiable metric to capture graduate success more effectively based on the tabulation of observational data trends.
Based on classification of data from collegiate sources of graduate profiles, a statistical formalism is provided here for readers to be able to capture their own success probability in a quantifiable manner, based on the modified hyperbeta “Karasian” distribution. To no consternation of the author, the dissemination of a success model that is not characterized with dependence on inherent classifications (race, color, religion, sex, sexual orientation, gender identity, national origin, veteran/ disability status) or user willingness to engage in illegal practices (gambling in the hopes to satisfy tuition payments, pirating textbooks) is considered a superlative feature in order to avoid angry letters from random readers, likely undergraduates attending one of the schools in the University of California system with too much time on their hands.
Calculation summary
An approximated data model was devised according to a derivation provided by Venrasimharaviswanathanjuvaripeta et. al.Reference Venrasimharaviswanathanjuvaripeta, Jackson and Perry4 using fits to multivariate models that assessed graduate student levels of neuroticism, masochism, and other lifestyle attributes that could be collected according to a redistributed survey.
Solving for personalized equation coefficients
Step 1: Coefficient of Neuroticism, Self-Assignment (0–1)
This metric, while user-defined for the purposes of this study, intends to characterize the extent of stress, hypertension, obsession, and anxiety, without the introduction of more advanced psychosis. This is the N variable, which extends to any non-integer value between 0 and 1, where a value of 0 indicates complete withdrawal from all human interaction, and a value of 1 indicates severe neurosis bordering on maniacal counterfactualism.
Step 2: Coefficient of Masochism, Self-Assignment (0–1)
The notion of masochism as a personality trait, as defined herein, is contrasted to that of sexual masochism according to a study by Ping et. al.Reference Ping, Watson and Pong5 This is self-assigned as the M variable, which extends to any non-integer value between 0 and 1, where a value of 0 indicates a completely sadistic personality, and a value of 1 indicates the candidate will be a postdoc forever.
Step 3: Determining the Questionnaire Index (0–1)
With such suggested values gleaned by Simblem et al.,Reference Simblem and Yerek6 the formulation of the questionnaire index x is determined by obtaining a score from the following miniature quiz. Start with the personality-based questionnaire with x = 50 points!
If you …
• have one or more solitary hobbies, add 5.
• play video games more than two times a week, subtract 3.
• have more than two siblings, add 2. If you still live at home, subtract 8.
• study meditation, add 4.
• enjoy mechanical watches, add 2.
• own a pet, add 1. If your pet is three or more cats, subtract 4.
• consider yourself a fan of 20 or more media franchises, add 3. If they’re mostly from TV and films rather than books and radio, subtract 7.
• work out more than two times a week, add 5. If your gym routine involves use of the squat rack for every workout, subtract 9.
• read scientific books, articles, and/or news releases for fun, add 9.
• can name more than 30 elements in the periodic table, add 5.
If you’ve ever …
• purchased a self-help book, subtract 5. (This article doesn’t count.)
• written “slam” poetry, add 2.
• gotten excited about conversations involving computers, add 3.
• laughed at a television commercial, subtract 5.
• written your zip code suffix on a personal letter, add 3.
• attended a non-technical convention, subtract 3.
• lived with a spouse or significant other who puts up with you, add 2.
• had staunch political views, subtract 4.
• competed in more than one trivia night, add 2.
Divide your final score by 100. This is the number used for the questionnaire index, x.
Calculating grad success probability
With the use of the three numbers tabulated (N, M, x), the modified hyperbeta distribution, or Karasian distribution, can be calculated, according to a model derived from consolidated experimental findings from Van Kleeck et al.Reference Van Kleeck, Wyatt, D’Argento and Shayda7 Ordinarily, the total distribution would span a questionnaire index range bounded by x = [0, 1], though inserting values (N, M, x) into the provided model yields a single-value success percentage characterized by Ks(x;a,b), where a = a(N) and b = b(M).
Parametric analyses of the Karasian (Equation 2) are given in Figure 1 for various choices of (N, M) pairs, where Γ is the gamma distribution and β is the beta distribution. It is noted that if any calculations herein are difficult for the prospective graduate candidate, they should instead rank their grad success rate at 8.1 ± 0.7% and avoid the trouble of performing the aforementioned calculation, and probably reading the rest of the article. Luk et al.Reference Luk, Zhèir and Zhan-Gouy8 provides a source that the author thought was relevant that kind of mentioned the value with a separate experimental detail, so it’s placed here so as to increase the span of the References section.
Figure 1. Varying scale and shape profiles (N, M) of the Karasian distribution Ks, where the questionnaire index spans x = [0, 1].
Results and discussion
According to the data trends provided in Figure 1, distinguishing ordinal categorical levels of neuroticism and masochism index are generalized (lower, medium, higher) for the results of the modified Karasian distribution, revealing the possible maximum value of attainable graduate success. While informally considered genetically favorable for graduate-level matriculation in most variants of academia, higher extent of neuroticism and masochism was demonstrated to be inversely proportional to graduate success by an approximate 25% reduction. Extreme levels of neuroticism favored lower questionnaire index ranking and vice versa for higher masochistic ranking. While it is conjectured that graduate student drop-off and suspension rates were possibly not classified in data summaries obtained from those institutions surveyed, the findings may classify such higher rates to correlated success deficiencies. Future research will strategically attempt to explain data trends more formally and ensure that the content that did not meet the article’s hypothesis will be mentioned in the results section. Oh, and here’s another source for good measure,Reference Tzander-Petiev, Zhao, Bullion and Wang9 in case the advisor wants more.
Conclusion
This work has detailed an approach of assessing observational and experimental data trends from reliable sources, detailing a model based on the flexibility of the Karasian distribution. A facile approach to calculating user-generated data to a statistical success index is defined, where most values do not typically exceed 60%. This paragraph has intended to summarize all of the above findings in an authoritative way, disseminating a few numbers here and there, with the assumption that only this and the abstract will be read in its entirety.