


I. Introduction
The use of pesticides is evaluated and regulated within the European Union (EU). For example, in 2009, the European Parliament and CouncilFootnote 1 implemented Directive (EC) No 128/2009, which established a general framework to secure the sustainable use of pesticides. EU Member States were expected to adopt National Action Plans (NAPs) to implement this Directive by November 2012. These plans had to include objectives, quantitative targets, measurements and timetables to reduce the risk and impact of pesticide use. A reassessment of these plans is required at least every five years. These action plans, together with an integrated pest management (IPM) plan, all supervised by the EU Commission (“Commission services”, the institutional body with civil servants), are to be implemented by the EU Member States in the form of NAPs.Footnote 2 The main NAPs concerned the training of users, advisors and distributors, the inspection of pesticide application equipment, the prohibition of aerial spraying, protection of the aquatic environment, limitation of pesticide uses in sensitive areas and informing and raising awareness about pesticide risks. Monitoring of the pesticide risk was introduced by the EU in this last point, and with regard to these objectives a harmonisation of European indexes concerning human health and environmental risks was proposed by the EU CommissionFootnote 3 and Directive No 128/2009. As a result, many scientists contributed to meeting this objective in different domains, including health,Footnote 4 and pesticides were not spared from this initiative.Footnote 5 Many injunctions of the European Parliament aimed at protecting populations from the risks associated with pesticide uses (substances of concern, including residues of substances whether approved or not), leading to a report being produced by the Commission for the European Parliament and Council.Footnote 6
Therefore, an EU-wide pesticide risk indicator was developed by the EU Commission: the harmonised risk indicator (HRI).Footnote 7 The HRI aims to standardise and monitor pesticide policy across the EU Member States in order to measure the real advances achieved in meeting these objectives at the EU level. These compulsory dispositions trigger Member States to manage the potential risksFootnote 8 at a national level and report back to the Commission. In addition, Member States should be able to use the same tools across Europe.Footnote 9
Two types of HRI were defined: HRI_1 is based on the quantity of active substances placed on the market (annual volume of pesticides in weight (usually in tonnes)), while HRI_2 is based on the number of derogations or emergency situations in plant protection defined under Article 53 of Regulation (EC) No 1107/2009Footnote 10 and granted by Member States.Footnote 11 These Article 53 derogations are market authorisations for specific usages (one to a few crops) for 120 days (four months) at a national level.
1. Definitions
a. Active substances
Basic substances are approved according to Article 23 of Regulation (EC) No 1107/2009 and listed in Part C of Implementing Regulation (EU) No 540/2011.Footnote 12
Low-risk (LR) substances are approved according Article 22 of Regulation (EC) No 1107/2009 and listed in Part D of Implementing Regulation (EU) No 540/2011.Footnote 13
Substances candidates for substitution (CfSs) are approved according to Article 24 of Regulation (EC) No 1107/2009Footnote 14 and listed in Part E of Implementing Regulation (EU) No 540/2011.Footnote 15 These active substances meet one or more of the additional criteria laid down in point 4 of Annex II of Regulation No 1107/2009.Footnote 16
b. Harmonised risk indicators
HRI_1 is hazard-based HRI based on the quantities of active substances placed on the market in plant protection products (PPPs) under Regulation (EC) No 1107/2009.
HRI_2 is a HRI based on the number of authorisations granted under Article 53 of Regulation (EC) No 1107/2009.
HRI_1 index is the raw HRI-calculated values from Table 1 (of substance × coefficient) without the weighting of quantities (HRI_1 index × mass in tons of the corresponding substance in fields) instead of HRI_1 indicators.
Table 1. HRI_1 index-calculated values from Annex IV of Directive (EC) No 128/2009. Italic text represents ongoing data for 2023. Bold text represents base years.

LR = low-risk active substance; CfS = candidate for substitution active substance; All LR = all possible low-risk active substances approved + potential low-risk active substances.
c. Regulatory framework
The EU “Sustainable Use of Pesticides Directive” (SUD; Directive (EC) No 128/2009) was approved by the European Parliament, establishing a framework to achieve the sustainable use of pesticides by reducing the risks and impacts of pesticide use on human health and the environment and promoting the use of IPM and of alternative approaches or techniques such as non-chemical alternatives to pesticides. Under this Directive, EU Member States shall adopt NAPs in accordance with this Directive to set up their quantitative objectives, targets, measures and timetables to reduce the risks and impacts of pesticide use on human health and the environment and to encourage the development and introduction of IPM and of alternative approaches and techniques in order to reduce dependency on the use of pesticides.
The European Green DealFootnote 17 focuses on improving the well-being of people. Making Europe carbon-neutral and protecting our natural habitat will be good for people, planet and economy. Officially, the Farm to Fork Strategy (F2F) is at the heart of the European Green Deal, aiming to make food systems fair, healthy and environmentally friendly and, more specifically, requiring reductions in the uses and risks of chemical pesticides by 50% by 2030.Footnote 18
2. HR indexes
Corresponding HR indexes to be introduced in the calculations of HRI indicators are defined under Commission Directive (EU) No 2019/782, for all Member States,Footnote 19 with the implementation of Annex IV regarding HRIs of Directive (EC) No 128/2009.Footnote 20 HRI_1 and HRI_2 focus on annual European development surveys,Footnote 21 although with full data only available at the national level (number of Article 53 derogations, weight of used pesticides) Member States may thus be compared to each other regarding their arable surface area or crop production. From a risk perspective, the idea of managing these risks through indicators is clearly defined and orientated to decreasing these indicators. This study focuses on the evolution of the displayed HRI_1 levels between 2011 and 2020.
II. Materials and methods
1. Sources of materials
a. Regulatory sources
Raw data were extracted from the European Commission pesticide database website.Footnote 22 Information about regulatory documents was drawn from the Official Journal of the European Union, especially Directive (EC) No 128/2009 on the sustainable use of pesticides,Footnote 23 with Regulation (EC) No 1107/2009 concerning the placing of PPPs on the market,Footnote 24 Regulation (EC) No 1185/2009Footnote 25 relating to statistics on pesticides, Directive (EU) No 2019/782Footnote 26 concerning Annex IV of Directive (EC) No 128/2009, Regulation (EC) No 396/2005 concerning maximum residue levels of pesticidesFootnote 27 and Implementing Regulation (EU) No 540/2011Footnote 28 dealing with active substance regulatory movements.
b. HRI_1 indicators at the Member State level
Primarily, data were collected from the EU Member State agriculture ministry and Commission websites.Footnote 29 Then, data were collated, and a mean was computed to approximate European trends (Table 2). All data for HRI_1 indicators were provided by the beginning of 2023.
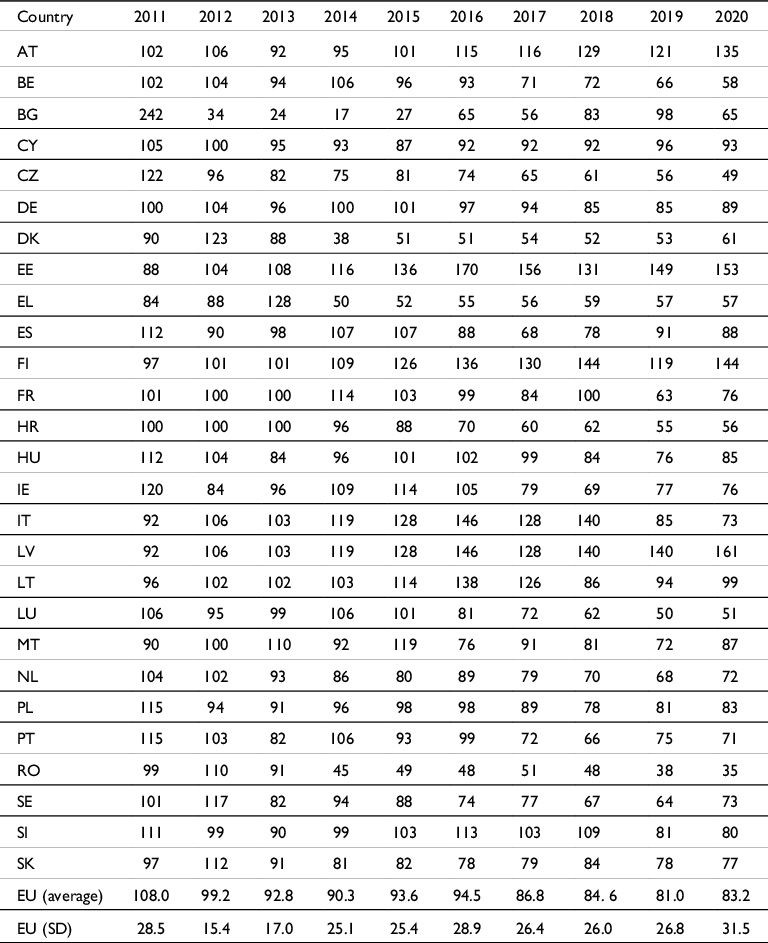
Table 2. Gathering of the HRI_1 indicator values calculated by twenty-seven European Union (EU) Member States (number of units, 2011–2013 = baseline 100).
c. HRI evolution graphs
The different regression curves (in Figs 1–6) regarding the development of HRI_1 over time were retrieved from the data extracted from the European Commission pesticide database.Footnote 30 The methodology derives from Eurostat.Footnote 31 Eurostat is the statistical office of the EU, providing comparable, harmonised and consolidated data that enable comparisons between Member States and regions. Eurostat does not collect such data, however.Footnote 32 This is conducted within Member States by their statistical authorities. They verify and analyse national data and send them to Eurostat. The other curves were previously published by our departmentFootnote 33 or derived from data obtained from different European Member States (Fig. 3).Footnote 34

Figure 1: Evolution of the HRI_1 index versus baseline of 100 (2011–2013).
Note: 2011–2013 are baseline averages of 100, values are given for 2014–2021 and an actual transitory value is given for 2022.

Figure 2: Possible evolution of the HRI_1 index based on hypotheses.
Note: 2011–2013 are averaged at 100, values are given for 2014–2021 and an actual value is given for 2022.
LR = low-risk active substance; CfS = candidate for substitution active substance; all LR = all possible low-risk active substances approved + potential low-risk active substances.

Figure 3: Evolution of the re-calculated European Union-wide HRI_1 indicator trend average based on the data from the twenty-seven Member States with standard deviations (points represent the baseline of 100 for the years 2011–2013).

Figure 4: Evolution of overall weighted HRI_1 index over time presented in the methodology of Barany et al (2019).
Note: 2011–2013 are baseline averages of 100; values are unitless.

Figure 5: Evolution of the HRI_1 indicator over time presented by the European Union online (2019).
Note: 2011–2013 are baseline averages of 100; values are unitless.

Figure 6: Evolution of the HRI_1 indicator over time presented by the European Union online (2023).
Note: 2011–2013 are baseline averages of 100; values are unitless.
2. Methodology
a. Calculation background
To meet the targets of the NAPs derived from Directive EC No 128/2009, a routine computation of HRIs concerning plant protection substances is important. Thus, the EU published a decision and a report entitled “Trends in Harmonised Risk Indicators for the European Union”.Footnote 35 The detailed methodology of HRI_1 calculation is available on the EU pesticides website. This methodology demonstrates the computation of HRI_1 and HRI_2 to allow each Member State to estimate these indexes at the national level in a harmonised way. HRI_1 is the result of the multiplication of the calculated index by the quantities of pesticides used.
Firstly, these calculations regarding the evolution of HRI_1 over time represent an extension of our previous work on the HRI_1 indexFootnote 36 incorporating EU pesticide annual weight sales from 2011 to 2020.
Four groups are presented: Group 1, which contains LR substances approved under Article 22Footnote 37 of Regulation (EC) No 1107/2009Footnote 38 ; Group 2, which represents other approved active substances; Group 3, which refers to CfSsFootnote 39 also under Article 24 of Regulation (EC) No 1107/2009Footnote 40 ; and finally Group 4, which refers to non-approved substances that are nevertheless possible to use via a derogation. The category G value does not affect the HRI_1 index nor HRI_1 values, but only affects HRI_2. The different groups (1–4) are then granted different arbitrary weighting values (wv): (1) wv = 1; (2) wv = 8; (3) wv = 16; and (4) wv = 64. (i) to (vi) represent, respectively, the row numbers in Table 3 from Commission Directive (EU) No 2019/782.Footnote 41 Groups 1–3 are each divided into two categories: (1) groups A + B; (2) groups C + D; and (3) groups E + F. However, Group 4 has only one category: G. The first categories for each group (A, C, E) are accounting for microorganisms, while the second categories for each group (B, D, F) are accounting for non-microorganisms (chemicals, substances of natural origin or semiochemicals). Despite these two categories per group, the same weight is assigned to them. These respective wv for Group 3 were set to disadvantage and put pressure on those substances perceived as being the most dangerous, with the ultimate intention of removing/replacing them. However, the attribution of the same wv in each group for microorganisms, substances of natural origin or semiochemicals is debatable. Indeed, while the characteristics of the substances from Group 1 (LR substances) or from Group 3 (CfSs) may be homogeneous, with regards to Group 2 (“other approved active substances”), the same wv being assigned to exogenous chemicals or residue-generating exogenous agrochemicalsFootnote 42 and natural substances, microorganisms or semiochemicals (as some of these may not have maximum residue limits; MRLsFootnote 43 ), can be criticised.
Table 3. HRI_1 groups, categories and hazard weightings values in Annex IV of Directive (EC) No 128/2009.

Categories A and B are low-risk active substances, C and D are regular active substances, E and F are candidate for substitution active substances and G is non-approved (highlighted with italics).
Greater danger is being indiscriminately linked to toxicology data for humans and/or ecotoxicology data for non-target organisms and the environment, as demonstrated during the European Food Safety Authority (EFSA) evaluation.Footnote 44 Hazard was also taken into consideration during this evaluation, contributing to the attribution of a regulatory status; LR, normal active substance, CfSs and non-approved substances, the latter affecting only HRI_2. The baseline was also required to be fixed at 100 for the average of 2011–2013 values (Equation 1).
b. Calculations in our work
During the first calculation step, the HRI_1 index is a fixed number per year for each column depending on the number of LR substances, active substances (chemicals or microorganisms) and CfSs, each weighted respectively by the corresponding published values 1, 8 and 16 (non-approved substances and basic substancesFootnote 45 are not included in HRI_1). Values were first updated from previous workFootnote 46 for the years 2019 and 2020 and ongoing values from 2021. The second step is to add all column values and divide the row sum by the average of the years 2011, 2012 and 2013 (3341.3). This average was designated to represent a base value of 100, which is then used to calculate the HRI_1 index for each year. Thus, although it is possible to calculate the HRI_1 index when all of the quantities of all substances are known for each category each year, this is only the first part of the analysis. For each category, chemicals or microorganisms are equivalent in terms of weight.
Determination of the HRI_1 indexes for a year 20XXFootnote 47 is derivedFootnote 48 using the following equations.Footnote 49 Equation 1 focuses on the baseline for the years 2011–2013, Equation 2 on the HRI_1 index for each year from 2014 to now and Equation 3 on comparing index results to the baseline of 100 (from 2011–2013).
Equation 1. HRI_1 index baseline for the years 2011–2013 fixed at 100 for each Member State.
 $${{\sum {\rm{HRI}}\_1\,{\rm{index}}\;2011 + {\rm{HRI}}\_1\,{\rm{index}}\;2012 + {\rm{HRI}}\_1\,{\rm{index}}\;2013} \over {\matrix{ 3 \cr } }}\equiv100$$
Equation 2. HRI_1 index values for years 20XX.
 $$\eqalign{ & {\rm{HRI}}\_1{\mkern 1mu} {\rm{index}}\;{\rm{of}}\;20{\rm{XX}} = \sum {{\rm{nb}}} \left( {{\rm{LR}}} \right)\;{\rm{in}}\;20{\rm{XX}} + {\rm{nb}}\left( {{\rm{a}}.{\rm{s}}.} \right)\;{\rm{in}}\;20{\rm{XX*}}8 \cr & \quad \quad \quad \quad \quad \quad \quad \quad \quad \quad + {\rm{nb}}\left( {{\rm{CfS}}} \right)\;{\rm{in}}\;20{\rm{XX*16}} \cr} $$
where “nb” refers to “number of” and “a.s.” refers to “active substances”. Concretely, CfSs and LR substances are only included in Equation 2 Footnote 50 from 2015.Footnote 51 Finally, in order to describe the HRI_1 index for a year 20XX with a baseline of 100 from the years 2011–2013, Equation 3 is necessary.
Equation 3. HRI_1 index values for years 20XX with a baseline of 100 from the years 2011–2013.
 $${{\rm{HRI}}\_1\,{\rm{index}}\;{\rm{of}}\;20{\rm{XX}} = {{\sum {\rm{nb}}\left( {{\rm{LR}}} \right)\;{\rm{in}}\;20{\rm{XX}} + {\rm{nb}}\left( {{\rm{a}}.{\rm{s}}.} \right)\;{\rm{in}}\;20{\rm{XX*}}8 + {\rm{nb}}\left( {{\rm{CfS}}} \right)\;{\rm{in}}\;20{\rm{XX*16}}} \over {\sum {{{{\rm{HRI}}\_{\rm{1 index}}\;{\rm{2011 + HRI}}\_{\rm{1}}\,{\rm{index}}\;{\rm{2012 + HRI}}\_{\rm{1}}\,{\rm{index}}\;{\rm{2013}}} \over {\rm{3}}}}}}{\rm{*100}}}$$
c. Calculations from the CommissionFootnote 52
The calculations regarding the data from the Commission are obtained according to Equation 4.
Equation 4. HRI_1 indicator values for years 20XX with a baseline of 100 from the years 2011–2013.
 $${{\rm{HRI}}\_1\,{\rm{indicators}}\;{\rm{of}}\;20{\rm{XX}} = \;{\rm{HRI}}\_1\,{\rm{index}}\;{\rm{of}}\;20{\rm{XX*mass}}\;\left( {{\rm{tonnes}}} \right)\;{\rm{of}}\;{\rm{corresponding}}\;{\rm{pesticides}}}$$
Again, these calculations are adjusted to be reported to a baseline of 100 from the years 2011–2013.Footnote 53
III. Results
1. Background and update of previous work
Using this approach, Robin and MarchandFootnote 54 studied the evolution of the HRI_1 index at the European level. In fact, the HRI_1 index curve (in Figs 1 & 2) is a virtual evolution outcome since it is only based on the number of active substances and their relative weight, whereas the EU HRI_1 indicator is a product of the HRI_1 index factor for the actual amounts of pesticides used.
a. Update of HRI_1 index data
An update of our previous work is provided in this work (Fig. 1 & Table 1). Real and definitive values and the evolution of the HRI_1 index are now reported for 2019–2022 and are extended with ongoing values for 2023 shown in Table 1. The G column is shown in italics in Table 3, since the number of non-approved substance is not taken into consideration for the HRI_1 index and the HRI_1 indicator. Later, this HRI_1 index will be multiplied by pesticide quantities to obtain the corresponding HRI_1 indicators for each year.
b. Update of the HRI_1 index curve
In contrast to the results presented by the European Commission (Figs 5 & 6),Footnote 55 the results from Robin and MarchandFootnote 56 do not illustrate the HRI_1, but instead the overall index without quantities (annual sold masses). This deserves some clarification: the rules of calculation used by the European CommissionFootnote 57 include different instructions.Footnote 58 The first rule implies that the indicator shall be based on statistics on the quantity of active substances, described broadly at the EU level,Footnote 59 sold on the market as PPPs under Regulation (EC) No 1107/2009Footnote 60 and provided by the Commission (Eurostat) under Annex I of Regulation (EC) No 1185/2009.Footnote 61 These data are characterised into four groups divided into seven categories. The HRI_1 indicator should be calculated by multiplying the annual quantity of active substances put on the market for each group by the relevant hazard weighting index.Footnote 62 As a result, the estimates in Robin and Marchand were incomplete, as it was not possible to take the annual quantities sold into consideration, which explains most of the observed differences between the published graphs and curves (see Figs 1–7). Nevertheless, the graph in Fig. 1 produced using the calculation of our index was relatively easy to constitute and compute, and it provides a background that allows for easier reading of the HRI_1 indicator and for the visualisation of the impact of the quantities (masses in tonnes) sold by comparing them.Footnote 63

Figure 7: Evolution of the HRI_1 indicator over time presented by the European Union online (2021).
Note: 2011–2013 are baseline averages of 100; values are unitless.
2. Evolution of the HRI_1 index
The updated data shown in Fig. 1 and Table 1 based on our previous work take into account the full stabilised data of 2019 and 2021 and the ongoing developments for 2022. The possible evolution of the HRI_1 index (Fig. 2) has continued to be investigated with the same background (all potential LR substances validated) and the suppression of CfSs (CfSs removed from the approved substances listing; see the “LR+CfS” bar). Another situation was envisaged as an ultimate case (“All LR”), when all of the PPPs would be LR substances there would be no more CfSs and so no more simple “active” substances, in order to calculate the minimum level of the HRI_1 index. Therefore, the results presented in these bars in Fig. 2 show that the decrease of the curve will plateau. Indeed, this decrease will be hindered mechanically once all substances accepted by the EU have been considered (approved or renewed) as LR substances. For example, if all of the approved substances would fall under the LR criteria, then the lower limit will be 425, which corresponds to the total number of currently approved substances minus twenty-four (the number of basic substances not taken in consideration for HRI_1 indicator),Footnote 64 with the overall weighted index equal to 10.9 (Fig. 2).
a. Effect of the LR substances
The “LR” situation corresponds to all of the potential LR substances converted to this status. Since most of the LR substances are already converted or non-renewed, the difference from the 2021 situation is not greatly significant, since they are increasing very slowly and the qualification of all possible LR substances is feasible.Footnote 65 The corresponding gain for the HRI_1 index is not expected to be greatly important either. In fact, the residual reserve in LR substances weak because the list of initial potential LR substances drawn up in 2018 has been largely exploited.Footnote 66 Only some active substances (fifteen from the fifty-seven listed as “potential”) were renewed as LR substances from 2015 to 2023, but the process is quite slow, while already eight potentially LR active substances were abandoned during this time, such as pepper dust extraction residue, fenugreek seed powder, ammonium acetate and seaweed. Moreover, five potentially LR active substances listed in Table 1 (microorganisms and substances of natural origin) were not renewed as LR substances. It should be noted that many potential LR substances had already been taken off the market before 2003 (the deadline for submitting dossiers for active substances under Directive 91/414), and many were not included in the corresponding Annex I by the EU,Footnote 67 thereby reducing the actual “LR” effect, although some substances were LR active substance candidates later. That is reflected by the last rows of Table 1. Indeed, these rows give the value of the index in three cases: in the “LR” row, all substances accepted potentially as LR substancesFootnote 68 would be assigned LR status. Instead, this status is only delivered during individual renewal of the substances following the conclusion of the risk assessment of each active substance; thus, the full status modification may take a long time, since the last substance will not be renewed before 2024 at the earliest. Thus, the “LR” row in Table 1 shows a small reduction for the 2023 ongoing calculations compared to 2022 due to the slow implementation of LR substance assignment.Footnote 69
b. Effect of the CfSs
The number of CfSs results from the loss of candidates by non-renewal (eleven substances) deriving from the newly approved list of active substances as CfSs and the approved active substances characterised as CfSs (seven substances: carbetamide, emamectin, flurochloridone, gamma-cyhalothrin, halosulfuron methyl, ipconazole and tembotrione).Footnote 70 This recent qualification as CfSs for seven active substances negatively affects the curve and the HRI_1 index by 7 × 8 points (ie 56 points), when active substances migrate from the D column to the E or F columns, increasing the HRI_1 index value. By contrast, the removal of CfS qualification for propoxycarbazone changed the amount of CfSs to sixty-six and then to fifty-six.Footnote 71 These changes are again responsible for the decrease in the values shown in Table 3 and in curves shown in Figs 1 & 2.
c. Ultimate possible evolution
The “LR+CfS” situation corresponds to all potential LR substances being assigned this LR status and the disappearance of CfSs, both of which positively affect the curve. The gain is high but hypothetical because the CfSs do not disappear very quickly and only during the renewal process, but the total amount of CfSs is not just decreasing as new substances are constantly qualified as CfSs.Footnote 72
The “All LR” situation corresponds to the theoretical situation of all active substances, except for basic substances, being qualified with as having LR status.
4. Evolution of the HRI_1 indicators
a. HRI_1 indicators at the Member State level
We studied the trends of the HRI_1 indicator at the EU level based on the data published by the twenty-seven EU Member States.
Individual Member State results were illustrated using a curve that is easily comparable to the one provided by the EU. Figure 8 exhibits the evolution of national HRI_1 indicators over time at the Member State level obtained directly from Table 2. The results are shown in Figs 3–5 & 7. Figure 5 exhibits the national variation in the HRI_1 indicator since 2011, whereas Fig. 3 shows the HRI_1 indicator calculation with pesticide sale volumes (tonnes). Each country conducts its computations for its own market as no specific European data can be found on Eurostat.Footnote 73

Figure 8: Evolution of national HRI_1 indicators over time in twenty-seven European Union Member States: (a) from 2011 to 2020, (b) from 2011 to 2013 and (c) from 2014 to 2020.
b. HRI_1 indicators at the EU level
The average of the twenty-seven EU Member State HRI_1 indicators for each year permit us to draw a global EU HRI_1 indicator that can be compared to the officially published one.
2. Evolution of the HRI_1 curves: characteristics and slope
a. Description of the evolution: a virtual decrease
The HRI_1 indicator has the goal of illustrating the level of risk from the substances for the user, as well as for the environment and biodiversity in terms of the quantity of uses. In fact, since risk = danger/hazard × exposure, the HRI_1 index may be considered as the risk and pesticide sales as the “exposure”. The present study aims to shed some light on the expression of HRI_1 and to contribute to a better understanding of the actual development of pesticide use in Europe correlated to the corresponding danger and therefore risk. Even though the regression curves obtained by Robin and MarchandFootnote 74 on the HRI_1 index reviewed in this study and of Barany et alFootnote 75 using this methodology were in agreement, somewhat surprisingly the curves posted on the European Commission website do not reflect the same trend. The shapes of the Commission curves were not only different, but also showed a continuous decrease, whereas the figures from Robin and Marchand and Barany et al exhibited a Gaussian shape. This difference in shape shows that the HRI_1 indicator has decreased over time since 2013 – a positive and welcome trend. Yet this interesting observation cannot be confirmed mathematically as the required data are not shared by the European Commission. The calculations require data on the quantity of each substance sold on the market in each country, which are confidential and not fully accessible. Secondly, the curves published in 2020 (Fig. 6) are always under the 100 baseline (2011–2013), while the curves published in 2019 (Fig. 5) exhibit points above the 100 baseline. This differences six years after the official uses (2013 data) is quite anomalous since no explanation nor comparison between these curves was provided by the Commission.
b. Review of the different HRI_1 curves
Similar work is undertaken by all EU Member States each year, the results of which are then published. The results presented in Fig. 1 represent an update (2019–2023) to those obtained by Robin and MarchandFootnote 76 in 2019 with the same parameters. These values must be weighted with the quantities (tonnes) of pesticides used in the different groupsFootnote 77 to obtain the actual HRI_1 indicator values. The data and results are displayed and presented in Figs 1, 2 & 8 and Tables 1–3. In addition, the results concerning the evolution of the weighted indicators are presented in the methodology section from EU (Fig. 4). From our work, the resulting curve calculated only with the HRI_1 index is exhibited in Fig. 1, and this approximately fits with the published results shown in Fig. 2 Footnote 78 and the first curve published using the EU methodology,Footnote 79 which determined the overall weighted index (Figs 5 & 6). Surprisingly, the curve in Fig. 4, focusing on the data from the twenty-seven Member States published in 2020, is very similar or even identical to Fig. 1.
The initial increase observed after the 2011–2013 baseline is similar to our HRI_1 index, although the increase is higher, but the subsequent rapid decrease is surprising since we observe a plateau in our data (Fig. 1). This may be attributed to reductions in the volume (tonnes) of pesticides sold globally or specifically for CfSs used, although this is not clearly confirmed by data on sales. Secondly, a European trend for the HRI_1 curve was derived using the results obtained from twenty-seven European Member States. Finally, a comparison between the different curves obtained was performed. However, the results presented by the European Commission also differ from those obtained by others (see Figs 5–7).
A slow but continuous decrease from the baseline (2011–2013) calculation is shown, whereas Barany et alFootnote 80 described a curve with a peak. The EU curve showed a peak in 2014, which is in agreement with our previousFootnote 81 and ongoing (Fig. 1) calculations of the HRI_1 index, but this then decreased after 2015, while our HRI_1 index is quite stable and always higher than the baseline of 100. Although the appearance of CfSs in 2015 in the total substance panel/list can explain the HRI_1 index increase (by approximately +20%),93 no rapid decrease of CfSs can explain the significant reduction in pesticide sales targeted at CfSs seen in the official data (Fig. 6). In the same way, the F2F programme neither mentions nor specifically targets the CfSs, since only “chemicals” are cited. To our view, this CfS reduction is the only way to obtain such a reducing curve (Fig. 2) and the resulting risk reduction.
Together, the pesticide sales data and the communications regarding NAPs are not sufficient to explain the steady reduction over time of the curve derived from EU data since 2020 (Fig. 6). The corresponding information or explanation from the EU about the modification of the curves a posteriori (2023) to be always under the baseline 100, after a published “bump” in Fig. 5 (in 2014 and 2015), is missing. By contrast, Barany et al’s curveFootnote 82 even went up to 190 and is closer to the HRI_1 index that we calculated.
IV. Discussion
1. Evolution of the HRI_1 index
a. Weighting values
As mentioned, the wv are the same in each group (for Groups 1–3) among both categories, which means that microorganisms without a MRL are more easily placed at the same level of wv (same value) without advantage than chemical substances with residues.Footnote 83 The only advantage for biocontrol agent (BCA) microorganisms under this accounting system is that they are more easily described as LR, but this is not always the case, even during renewal (eg Streptomyces K61) and even with no MRL. Thus, if the separation of the groups and the corresponding wv are legitimate, a boost could have been given to the microorganisms approved as regular active substances. A similar boost could have been given to all active substances without a MRL by having distinctions within the same group, so as to boost and promote the use of BCAs.Footnote 84
b. HRI_1 index
The first observation from Figs 1 & 2 that can be made is that, ten years after its creation, this HRI_1 index has always had a value greater than the baseline of 100 (2011–2013 years), except for the current year 2023 (Fig. 1). Indeed, 2023 is the first year to see a potential decrease under the baseline of 100, although any CfS qualifications for an approved active substance would negate this positive evolution. Furthermore, with the HRI_1 index displaying such a bell curve, it is strange to observe a continuous decrease of HRI_1 over time. A heavy decrease in pesticide sales in the E and F categories (Group 3) or pesticides from Group 4 may be at the core of this, but individual Member State salesFootnote 85 and EU dataFootnote 86 do not show a drop strong enough to compensate for the increase in the HRI_1 index and the slight reduction in CfSs or even the new CfS entries in 2020. It is necessary to specify here that the CfS classification is in no way linked to the SUD Directive or the F2F project since it derives from the new (more demanding) requirements for the evaluation or re-evaluation of pesticides (more specifically the publication of criteria for endocrine-disrupting properties and their application).Footnote 87
c. HRI_1 indicator
Figure 5 shows a divergence of the points soon after the baseline of 100 (2011–2013), with higher points at +142% (242) and lower points at –83% (17), without any specific climatic explanation for these data, nor obvious geographical coherence. The baseline of 100 itself shows higher points at +142% (242) and lower points at –65% (34), with diverse and divergent slopes between 2011 and 2013 (Fig. 8). These observations show its artificial value with a high standard deviation of more than 15% and up to 28% for these three years. Later, after the relatively stable baseline, the extreme divergence of the values after 2013, with a standard deviation dispersed between 25.1% and 31.5%, after the relatively stable baseline is not explained by Member States’ public data used to calculate the curves.
The work conducted by the EU is not easy to evaluate in the light of the literatureFootnote 88 and especially when comparing the evolution through the years of publication (Fig. 4 vs Fig. 5 vs Fig. 6). Another curve (Fig. 7) published in 2021Footnote 89 even shows a global curve with two recovery peaks in 2014 and 2017 that can no longer be found in the latest published data (Fig. 3).
Indeed, computations require data on the sales of each plant protection substance type. Thus, for each substance it is necessary to extract the amount sold on the market for each group to perform the actual calculations, but this does not explain the evolution of the published curves. In addition, data on pesticide sales were patchy for a number of Member States, are often very slow to be published online (eg data for 2018 may not be provided until the end of 2020) and are still not yet published for 2021. Finally, these data are difficult to control, especially when they are decreasing over time. For instance, how can the quantities of sold pesticides validated five years before decrease and correspond to a lowered HRI_1 indicator in the published Table 2?Footnote 90 Moreover, the correlations within the groups and categories of pesticides (A–F) are impossible to determine. In addition, the regulatory status of the active substances is time-varying: first through the transition from unapproved to approved with the reduction of wv (from slight (wv divided by 4) to significant (wv divided by 64)), then through the acquisition of LR status and the reduction of wv (wv divided by 4) and the acquisition of CfS status and the increase of wv (wv multiplied by 4) or, more striking, their loss (wv divided by 4). Finally, ongoing F2F policy, targeting the reduction of chemical pesticides, should still produce serious effects on this curve, since chemical pesticides are very predominant in Group 3.
2. Evolution of the HRI_1: a review of the published curves
An initial comparison of Figs 5–7, initiated by the EU, shows changes in the values since the more recent ones were published (Fig. 3). The latter show all data points under 100, in contrast with Fig. 5, which was previously published in 2018. No information about a later refinement or new data from Member States was furnished along with the second and third curves that were published. Therefore, the HRI_1 index is unchallengeable for any one year, since it is not linked to pesticide sales and only depends on the number of substances in each category. Then, since the sales of pesticides could not possibly change to lesser amounts after the values are published, it seems a priori valid to multiply these sales by the HRI_1 index. Therefore, since the EU-published curves exhibit an almost consistent decrease and moreover turn out to be below 100, it is curious that no explanation was given to explain these modifications of the curves over the time. In addition, if changes are introduced corresponding to changes in the status of substances, as described above, they do not necessarily lead to a reduction, as clearly shown in the more realistic Fig. 7.
3. Impact of Directive (EC) No 128/2009
The second observation as to the shape of the figures is that although the multiplications are necessary to obtain the final HRI_1 indicator, in no case does the slope result in a curve showing a strong decrease. The gradually decreasing slopes of the HRI_1 indicator produced by the EU analysis (Figs 5–7) could be explained by the transfers of sales volumes from the most dangerous substances including CfSs (wv coefficient = 16) to substances with a lower coefficient (wv = 8 or 1 with LR substances) encouraged by NAPs. However, if in fact the amounts of chemical substances used are indeed rapidly decreasing (especially from 2018), a constant increase in CfSs since 2015 should negatively impact the HRI_1 indicator. Clearly, the new active substances have mainly been BCA substances since 2018 (and exclusively so since 2019), including a large portion in the LR categories,Footnote 91 although some categories (ie botanicalsFootnote 92 ) are difficult to get approved.Footnote 93 These changes in the global panel of active substances in the EU, which are symmetrically opposed (ie a decrease of chemicals sees an increase of BCA substances), new entries/qualifications of CfSs and the implementation of LR substances are clearly not sufficient in Fig. 1 to claim a definitive and irreversible decrease in the HRI_1 indicator as show in Fig. 7. In addition, Figs 3 & 8 show the probable diminishing use of highly dangerous pesticides in most European countries. Nevertheless, it appears that the variability of pesticide use in Europe has tended to increase as each country aims at developing its own preferred cocktail of pesticides. This is well illustrated in Fig. 8. In addition, the decreasing curve presented by the European Commission does not necessary reflect a reduction in the use of highly dangerous pesticides. Firstly, it may be the result of a switch from a small number of very toxic pesticides (CfSs) to a greater variety and volume of moderately toxic ones, demonstrating that the wv coefficient is not the ultimate tool for discriminating between substances with different properties. Indeed, the opportunity of having a higher number of LR substances is not being pursued, since potential LR substances from the 2015 listFootnote 94 have been neither fully validated (substances renewed without this status) nor completely exploited (substances abandoned). This issue has also been pointed out by the European Court of Auditors (Points 36–43) in 2020, especially in Point 39.Footnote 95 Another specific argument has been exhibited by the European Court of Auditors in Point 40, highlighting “the low number of low-risk PPPs” due to the low number of LR active substances and the smaller number of low-risk PPPs. This situation is highly complex as “not all low-risk [active substances] are giving rise to low-risk PPPs” due to some co-formulants being “of concern”. However, recent Footnote 96 and ongoing Footnote 97 implementations of rules for unacceptable co-formulants in Annex III of the PPP Regulation may improve this situation. This market authorisation decision will not change the LR status of the substance, nor the multiplier of the substance for the HRI_1 index calculation (ie ×1) for Group 1 (categories A or B), but it disqualifies the corresponding product for a certain number of prerogatives due to its initial LR status. These entitlements listed in Article 47 of the PPP Regulation and their variations at the Member State level (market authorisation delays, pollution charges and fees or taxes or the possibility of promotion in the press) de facto reduce interest in the substance. Questions are also asked regarding the allocation of the quantities (masses) of these products used in the field in the HRI_1 indicator calculation: will they be affected by a classic active substance product coefficient of 8 or still by a factor of 1?
a. Mechanism of evolution of the curve
A decrease in the curve reflects either the effective removal of the most dangerous substances and hypothetical moves to a lower-weighted group or their suppression. It also illustrates an increase in the use of LR substances. Therefore, there is a desire and corresponding will to decrease this curve within the European Commission; however, the increasing toxicological findings on substances due to generally increased expectations of safety regarding active substances leads to a higher number of tests being required.Footnote 98 These stricter provisions and increased evaluations or re-evaluations of active substances are further factors that maintain the values/curves at a high level. As a proof of this, seven approved active substances have been added to the CfS list due to the emergence of new toxicology data in 2020. The goal of pointing out targets may be satisfied in this case, but the HRI is negatively impacted. Without calling this indicator into question, it therefore strongly depends on regulations (eg criteria for endocrine disruptors for CfSs and safety for LR substances) that apply to pesticides and requalify them as active substances, modifying the HRI_1 indicator in particular and challenging the usefulness of the indicators (European Court of Auditors, Point 53).Footnote 99 This is what prompted us to calculate the HRI_1 index.
However, our results are broadly similar to those obtained by the EU. Therefore, these results might be interpreted as a positive outcome for the implementation of Directive No 128 and a real demonstration of the desire to decrease the use of high-risk substances. Indeed, the EU has recently implemented a wish-list for the decrease in use of approved high-risk substances, meaning that an approval of new toxic substances is more and more difficult to obtain. For example, only 455 substances are approved, whereas 943 are not, including non-renewed toxic substances.Footnote 100 The HRI_1 index can be easily calculated, but since the quantities of pesticide sales are not fully available, this means that the HRI_1 indicator cannot be fully verified, so we tried to re-calculate this HRI_1 indicator from the available data (Fig. 3). Analysis of the curve shows a similarity with the published HRI_1 indicator from the European Commission, but any decrease over the years (slope) is more difficult to validate, especially when the modifications regarding some points (years) decrease over time (ie the curve from 2020 compared to the curve published in 2018).
3. An unwelcome flashback
These indicators relate to both the agricultural and food industry domains linked to consumer concerns more than ten years after the implementation of Directive (EC) No 128/2009, and while the results (reduction of risks) are as expected, they do not appear to support the European Green Deal that is now being invoked to solve the problem and obtain desired outcomes. Many of the regulatory, legal and easy means of obtaining a real inflection of the curve have in fact not been implemented. The slow implementation of LR substances and the renewal of CfSs are indeed symptomatic of the tardiness of enforcing the European Green Deal approach. For instance, we highlight the renewal of semiochemical straight-chain lepidopteran pheromones (SCLPs; encompassing acetate, aldehyde and alcohol families), of which only a part (the alcohol family) has been granted LR status, even though all of these molecules are used in traps, possibly leaving residues on the crops they protect, the environment and the users/applicators. Indeed, after a few years of debate, the lack of MRLs for these SCLPs has now been resolved.
a. EFSA statement
Specifically, the EFSA follows this scheme, and its executive director, Dr Bernhard Url, claimed in 2020 in EuractivFootnote 101 that “pesticides will be more targeted in what we would call ‘sustainable use of pesticides’, which would mean replacement of higher risk pesticides with low-risk pesticides under the Green Deal”, although Directive (EC) No 128/2009 had already aimed at achieving this goal ten years ago.
In fact, under the European Green Deal, the European Commission wants to reduce the use of chemical pesticides in the EU by 50% over the next seven years (therefore twenty years after the SUD’s implementation) in a benchmark established by the new F2F Strategy and Biodiversity Strategy. However, the definitive targets for the “reduction of the risks/pesticide use” will be subjected to the implementation of the soon-to-arrive “Sustainable Use of Pesticides” Regulation (SUR), starting fifteen years at best after the SUD.
To achieve this “new” monitoring, Dr Url also mentioned the necessity of IPM,Footnote 102 again as already required by the SUD,Footnote 103 which means that methods other than chemical pesticides will need to be adopted to control pests, such as crop rotation, managing soil fertility and using cultivars that are resistant to certain pests, although we showed that chemicals used in traps are compatible with IPM and BCAs.Footnote 104 Nevertheless, the European Commission claims that the SUD has (already) resulted in a “significant reduction” in risks from pesticides, whereas Dr Url from EFSA states that risk reduction will be achieved by the European Green Deal: “the Green Deal will do it”, although undoubtedly there is a “later” implied in this statement, which is antithetical to the Commission’s position. However, the study of the HRI_1 development shown here (Fig. 3) as well as the HRI_1 index (Fig. 1) already substantiates this trend. Clearly, it will be difficult to distinguish what is achieved by the SUD and what is the impact of the European Green Deal, although both are acting in the same direction. The HRI_1 indicators, notwithstanding the criticisms regarding their curves, through the SUD, are triggering efforts that are leading to substantial rearrangements and modifications of the plant protection fingerprint, especially regarding LR active substances. This observation raises questions regarding the complete validation, in 2018, of the list of all potentially LR substances.
b. Organic sector point of view
Again, most BCAs and LR substances are compatible with organic farming principles,Footnote 105 including chemicals used in traps. LR substances are all on the way towards being included in Annex I of the new organic production regulationFootnote 106 within a distinguishable and dedicated subcategory. Interestingly, the pressure to increase the use of BCAs and LR substances for IPM will continue to be profitable for organic production crop protection, whereas any reduction of controversial active substances may only slightly affect the number of substances available for organic production,Footnote 107 although some are of importance and may be negatively impacted (eg copper, spinosad, pyrethrums) and few are chemicals used in traps (eg deltamethrin and lambda-cyhalothrin).Footnote 108 However, the increase in the choice of BCA active substances available for organic production certainly requires that alternative non-chemical plant protection methods are actively developed and implemented in the organic sector. Conversely, the work on natural substances typical used in organic farming can offer solutions and could guide approaches within conventional agriculture.
V. Conclusions
The analysis of HRIs, in addition to monitoring the reduction of risk from pesticides, may also have another impact on the retrofitting of the PPP Regulation, including the ongoing SUD revision for the SUR, in order to improve subsequent approvals of less toxic compounds, although it was not designed for these objectives and aims. However, the rollout of the SUD and these indicators, with the first results only being obtained ten years after its entry into force, has been extremely slow. Moreover, these risk indicators are only linked to the HRI_1 index, weights and sales volumes within broad classes. Some recent proposals with more of a focus on triggering action may be better designed for achieving the goal of reducing the use of the most toxic agrochemicalsFootnote 109 and for more concrete risk reduction in the field (applicators, operators) as well as for consumers. The F2F Strategy goes even further with the “environmentally friendly food system”, which commits to going so far as to “have a neutral or positive environmental impact”, “help to mitigate climate change and adapt to its impacts” and “reverse the loss of biodiversity”.
We believe that this curve is primarily a communication tool regarding the positive developments in the pesticide panel. Nevertheless, it could also represent a trap facing the European Commission for when they are no longer able to decrease this curve due to its lower ceiling. In addition, mobility from one group to another can easily change the trend of the curve. Indeed, this observed for the three theoretical cases of “LR”, “LR+CfS” and “All LR”, with “All LR” having a the lowest possible ceiling for the HRI_1 indicator/index. The instability of the HRI_1 indicator is therefore a “Sword of Damocles” with regards to the objective of mandatory decreases of pesticides to enable positive communication, but data that could lead to such variations (plateaus as in 2020 or rises as in 2015) are extremely difficult to manage for EU institutions. In fact, after positive communication regarding a 20% reduction of the HRI_1 indicator in Fig. 5 Footnote 110 followed by a greater reduction in Fig. 3 but without a drastic reduction in the number and amount of CfSs since 2021, there is a risk that the downward trend will stabilise in 2020 or, in the worst case, even increase. The significant reduction of sales of the more harmful PPPs happened more as a result of the loss of chemical active substances, without counting the derogations granted to products no longer approved at all. To illustrate this fact, a study by the European Parliament in 2021Footnote 111 showed no significant reduction of sales between 2011 and 2018, but we have shown that chemical pesticides have since started to decrease sharply. It is therefore the changes in the EU approval requirements (approvals and renewals) that led to the decline in HRI_1.
Only EU-wide data and curves are presented unilaterally by the Commission and also by Member States, sometimes without showing values. The necessary study of the HRI_1 index at the European level proposed here cannot be fully undertaken by any other stakeholder except the EU itself, since information about the annual quantities of pesticides consumed is not freely available. Even with these data sorted by function (eg herbicides, insecticides, etc.), there is no way of knowing the precise numbers of every substance sold in Europe nor to link these with their status and thus with the corresponding multiplying factor for HRI_1. Data regarding the more precise product categories (A–F) are also inaccessible. The EU pesticide databaseFootnote 112 even supresses the function display (eg herbicides, insecticides, etc.) in its third revision.
Therefore, the lack of the necessary information needed to properly calculate HRI_1 leads to the impossibility of control. This leads to a computational dead-end as the whole system cannot be modelled independently. This makes our HRI_1 index the next most reliable alternative and an essential intermediary for measuring the real evolution of the desired effective decline. In fact, the European Green Deal may contribute to a further reduction in HRI_1 values since one target of the F2F 2030 global action is to reduce the use of chemical and more hazardous pesticides by 50%. However, this goal is being implemented and achieved through the tightening of the regulations themselves.Footnote 113 Clearly, when taken into consideration, a new baseline 100 for the years 2015–2017, representing the worst years in our HRI_1 index (Fig. 1), for the future SUR will lead to confusion as well as the inability to rapidly compare later HRI_1 indicators from the SUD over time since 2011.
Towards this objective, ongoing research for organic and IPM alternative inputs for more sustainable plant protection may also be a triggering factor for the inclusion of basic substances and LR approved substances, although implementation of the PPP Regulation for natural substances is not straightforward.Footnote 114 However, we show, especially in Fig. 2, that great change in the HRI_1 cannot be achieved without a massive switch from potential LR substances to substances an actual LR status and a drastic reduction in CfSs. A better differentiation between active substances in categories B (microorganisms) and c (chemicals) in terms of their weighting coefficients may also result in improved risk reduction.
The first lever can be quite easily activated, and the number of LR substances is increasing strongly (renewals and approvals), although a lot of potential LR substances have been abandoned since 2015 by their initial applicantsFootnote 115 and some listed potential LR substances are not being renewed as being LR substances (eg the renewal on garlic).Footnote 116 However, the current situation shows that the second lever does not work, with only thirty-six CfSs being removed while the total amount has also been added to, meaning that there are only twenty-one fewer CfSs (56 vs 77) since 2015.Footnote 117 This is proof that the actual withdrawal of CfS uses has not worked as intended, even if the comparative evaluation can block certain marketing authorisations in practice. Substitution appears to be very difficult in practice, as we have shown that BCAs are definitely not substitute active substances.Footnote 118
In addition, the poor results of the evolution of the HRI_1 values may induce further pressure against pesticides from civil society, as already observed in recent publications on the subject.Footnote 119 Ultimately, we show that regulatory pressure on pesticides and pesticide approval pathways mainly leads to a reduction in the number of substances (data not shown) and secondarily their risks. For example, knowing that the risk here is almost entirely incremented by the mass of pesticides in terms of the overall exposure to each class, no other exposure factors (eg persistence, volatility, solubility, type of hazard) are actually taken into account in the risk assessment, with the respective danger of the substances being reduced to a single factor: 1 to 64.
Finally, the very different shapes of the curve between 2019 and 2021 (Figs 5–7) requires some serious explanation, as such differences cannot be linked to a drop in sales during this time because they had already been made and counted in 2019. This significant variety in the curves is representative of the HRI_1 being a public relations statement of intent rather than representing a genuine risk management process. Further work is necessary to define the development of all of the specific entries for the HRI_1 index, which gives rise to the HRI_1 indicator, as LR substances and CfSs, but this class transfer cannot be the main way to reduce pesticide risk. Finally, an IPM transfer, switching from biotic to abiotic action, switching from pesticides to other regulatory compartments such as biostimulants or the breeding of more disease-resistant plant varieties will be the major changes in the coming years. Furthermore, the full implementation of the fourth pilar of biocontrol, namely macroorganisms,Footnote 120 is another essential element to compensate for the inevitable global reduction of chemical pesticides. When all of these IPM tools, mainly but not wholly dependent on the PPP Regulation, are completely implemented, the necessity for and interest in the HRI_1 indicator will undoubtedly drop, even if it is necessary to pursue it as a survey tool.
Acknowledgments
The authors would like to thank Dr Trevor M. Fenning of Forest Research (UK) for providing helpful advice on the editing and writing of the manuscript.
Financial support
This work about phytochemical regulation was initiated and supported through French Ministry of Ecology, via Agence Française de Biodiversité (XP-BC 2017–2019, Biocontrol’Expansion 2019–2021).
Competing interests
The authors declare none.


