


INTRODUCTION
The Laboratoire de Mesure du Carbone 14 (LMC14) was established in 2003 in Saclay, France. This facility is a national laboratory and uses a 9SDH-2 Pelletron tandem accelerator from National Electrostatic Corporation (NEC). The accelerator mass spectrometer (AMS) ARTEMIS is dedicated to radiocarbon measurement and is funded by the following French research institutions: the Commissariat à l’Energie Atomique et aux Energies Alternatives (CEA), the Centre National de la Recherche Scientifique (CNRS), the Institut de Recherche pour le Développement (IRD), the Institut de Radioprotection et de Sureté Nucléaire (IRSN), and the Ministère de la Culture (MC).
In 2023, the laboratory will celebrate its 20th anniversary and more than 70,000 samples of very different natures and origins will have been measured (Beck et al. Reference Beck, Caffy, Delqué-Količ, Dumoulin, Goulas and Hain2023). In 2017, a status report explaining our protocols and laboratory procedures was published (Dumoulin et al. Reference Dumoulin, Comby-Zerbino, Delqué-Količ, Moreau, Caffy and Hain2017). Over the last five years, “routine” protocols have continued to be applied on charcoals, wood or plant remains, shells, corals or foraminifera but also on artefacts containing various carbon contents such as paint, leather, wax or pearl. The quality of our procedures is often tested with international inter-comparison campaigns and the latest results for the GIRI inter-comparison are presented. More recently, new protocols have been developed to expand our range of datable materials and take into account the expectations of new archaeological projects. The specific protocols implemented for dating iron, cellulose (wood), calcium oxalates (rock art), mortars (buildings) or lead white (cosmetics and paintings) will be detailed.
SERVICE ACTIVITY: SAMPLE PREPARATION AND QUALITY CONTROL
As described in Dumoulin et al. (Reference Dumoulin, Comby-Zerbino, Delqué-Količ, Moreau, Caffy and Hain2017), for the service activity, two main types of samples are treated: carbonates and organic matter (OM). Carbonates include shell, coral, foraminifera, calcite crust or speleothems. After a microscope inspection and, if necessary, sand blasting, the samples are leached in a 10–2 N acid solution for 15 min. OM, including charcoals, wood, plants, peats and sediments are also subjected to microscopic examination to remove mineral grains and potential contaminants such as synthetic fibers or rootlets. Then, the samples are treated with the classical ABA method: acid (HCl, 0,5N, 80°C, 1 hr)—base (NaOH 0.1N, 80°C, 1 hr)—acid (HCl 0.5N, 80°C, 1 hr).
Sometimes, less common samples are dated in the laboratory with the same ABA protocol adapted according to the type, the fragility or the amount of the sample. This is the case for textile, rope, leather or paint and canvas (Beck et al. Reference Beck, Alloin, Vigneron, Caffy and Klein2017; Quiles et al. Reference Quiles, Emerit, Asensi-Amorós, Beck, Caffy, Delque-Količ and Guichard2021; Bonnot-Diconne et al. 2021; Beck Reference Beck2022; Beck et al. Reference Beck2022a). Some samples are directly combusted or hydrolysed without any pretreatment because the material is pure and was sampled directly inside the matrix; this is the case for pearls, amber or wax (Reiche et al. Reference Reiche, Beck and Caffy2021; Beck et al. Reference Beck2022b).
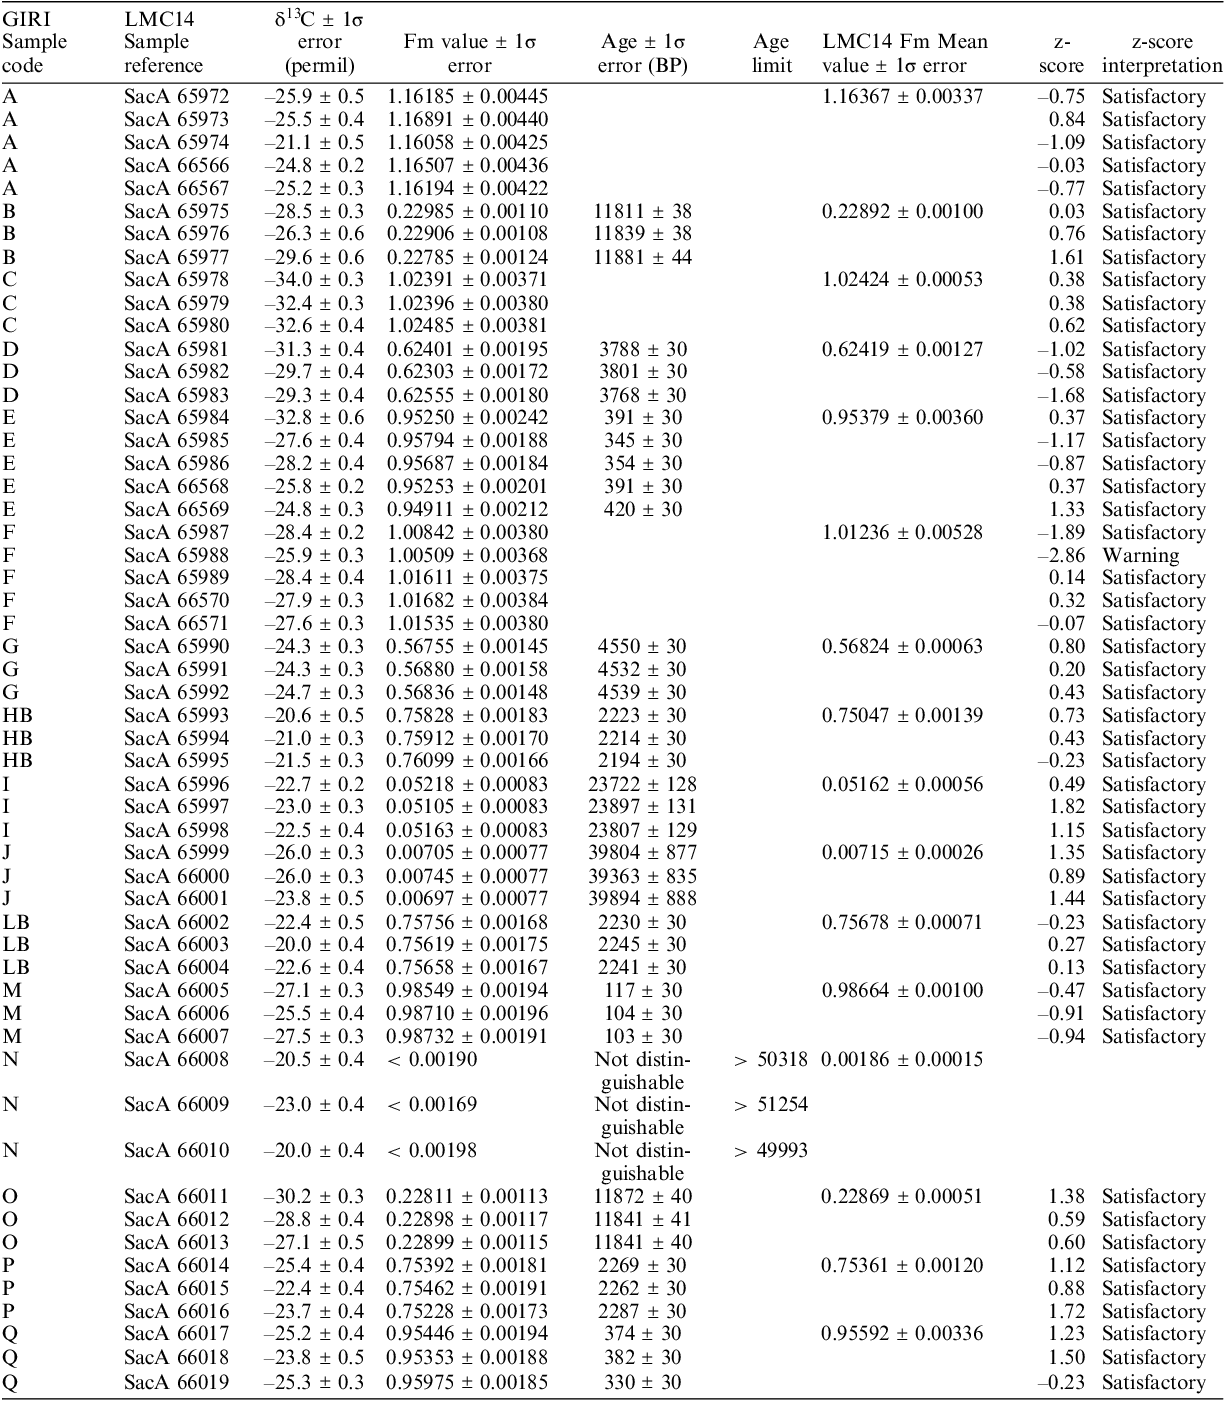
To control the efficiency of the pre-treatments as well as the quality of the measurements, the LMC14 participated in the last international intercomparisons SIRI (Scott et al. Reference Scott, Naysmith and Cook2017; Moreau et al. Reference Moreau, Messager, Berthier, Hain, Thellier and Dumoulin2020) and very recently GIRI. The LMC14 results for the GIRI are presented in Table 1.
Table 1 LMC14 GIRI results. In this table, the values are not rounded as is the usual practice with radiocarbon results. Fm is the fraction modern of the sample background corrected. Results not distinguishable from the background are indicated as < in Fraction modern ( ${{\rm{F}}_{\rm{m}}}$
) and > in Before Present (BP).
${{\rm{F}}_{\rm{m}}}$
) and > in Before Present (BP).
The preparation and measurement of these GIRI samples, without knowing the consensus values in advance, was a very interesting challenge for the national laboratory. The presentation of the preliminary results at the Radiocarbon 24 International Conference in Zürich, Switzerland (Scott et al. Reference Scott, Lindroos, Barrett, Boudin, Hajdas, Olsen, Maspero, Marzaioli, Michaska, Sironic and Forthcomingforthcoming) makes it possible to assess the performance of the laboratory, and therefore the quality of the preparations and measurements carried out. A simple statistical test is used to evaluate each individual result: the z-score, defined as follows:
 $$z = {{{X_M} - {X_A}} \over {{\sigma _P}}}$$
where ${X_M}$
is the reported result,
${X_M}$
is the reported result, ${X_A}$
the assigned or true value for the sample and
${X_A}$
the assigned or true value for the sample and ${\sigma _P}$
the target value for the standard deviation. Here the assigned value is the median calculated on the entire results given by the participating intercomparison laboratory and the quoted error is used for
${\sigma _P}$
the target value for the standard deviation. Here the assigned value is the median calculated on the entire results given by the participating intercomparison laboratory and the quoted error is used for ${\sigma _P}$
.
${\sigma _P}$
.
The interpretation of the z-score results is done as follows:
z-score = 0: it means a “perfect” result. $\left| {{\rm{z \hbox- score\;}}} \right| \le 2$
: the single measurement result is “satisfactory”.
$\left| {{\rm{z \hbox- score\;}}} \right| \le 2$
: the single measurement result is “satisfactory”. $2 \lt \left| {{\rm{z \hbox- score\;}}} \right| \lt 3$
: the single measurement result is still quite good but, “warning”, the agreement between the result with its error and the consensus value begins to be less good.
$2 \lt \left| {{\rm{z \hbox- score\;}}} \right| \lt 3$
: the single measurement result is still quite good but, “warning”, the agreement between the result with its error and the consensus value begins to be less good. $\left| {{\rm{z \hbox- score\;}}} \right| 3$
: this would be a very unusual result and further “investigation” would be needed to find out the reason for the discrepancy.
$\left| {{\rm{z \hbox- score\;}}} \right| 3$
: this would be a very unusual result and further “investigation” would be needed to find out the reason for the discrepancy.
The results of the GIRI sample prepared and blindly measured on the LMC14 ARTEMIS AMS facility show excellent agreement with the preliminary consensus values of each sample. The z-score values are, with the exception of one case out of the 51 results, less than 2, which means “satisfactory”. These results show the excellent performance of the LMC14 in C14 analysis.
Figure 1 presents the average of the measurements in fraction modern for each of the GIRIs according to the associated preliminary results in ${F_m}$
(median of the values provided by the participating international laboratories), coupled with their respective error bars, over the entire time range reachable by 14C analysis.
${F_m}$
(median of the values provided by the participating international laboratories), coupled with their respective error bars, over the entire time range reachable by 14C analysis.

Figure 1 Linear regression on the Fm data coming from the intercomparison and the LMC14 results (mean per sample).
By performing a linear fit on these points (consensus value in ${F_m}$
; mean of experimental results in
${F_m}$
; mean of experimental results in ${F_m}$
), a linear regression curve on plot 1 is obtained:
${F_m}$
), a linear regression curve on plot 1 is obtained:
 $${F_{m\exp result}} = a \cdot {F_{m{\rm{\;}}consensus{\rm{\;}}value}} + b$$
with
Leading coefficient: $a = 1.00002$
y-intercept: $b = - 0.00064$
Square of the correlation coefficient: ${R^2} = 0.99998$
The leading coefficient is equal to 1, to within $2 \times {10^{ - 5}}$
. The y-intercept is close to zero and is a negative value. It depends on the measured background level, which is greater than the consensus value in this case. The correlation coefficient calculated from Pearson’s correlation formula is very close to 1, to within
$2 \times {10^{ - 5}}$
. The y-intercept is close to zero and is a negative value. It depends on the measured background level, which is greater than the consensus value in this case. The correlation coefficient calculated from Pearson’s correlation formula is very close to 1, to within $2 \times {10^{ - 5}}$
, showing that there is no significant difference between the experimental results and the associated consensus values over the entire time domain accessible by radiocarbon analysis.
$2 \times {10^{ - 5}}$
, showing that there is no significant difference between the experimental results and the associated consensus values over the entire time domain accessible by radiocarbon analysis.
NEW DEVELOPMENTS FOR SAMPLE PREPARATION
Beside our service activity for the French scientific community, the laboratory develops new protocols to widen the range of the datable materials and to respond to various challenges raised in the context of different scientific collaborations.
Iron Objects
As tools, weapons or elements of architecture, iron objects are critical markers of societies development for more than 3000 years. Until the beginning of the nineteenth century, iron was produced from the reduction of iron ore by carbon oxide provided by the combustion of wood charcoal. Carbon was trapped into the metallic matrix in the form of iron carbide with a 14C content derivated from the wood charcoal used as fuel in the reduction process. In these conditions, iron objects are suitable for direct radiocarbon dating. A specific methodology to prepare samples taken from massive iron objects was developed in collaboration with the Laboratoire Archéomatériaux et Prévision de l’Altération (CEA-CNRS, Saclay, France) (Leroy et al. Reference Leroy, L’Héritier, Delqué-Kolic, Dumoulin, Moreau and Dillmann2015). Prior to 14C dating, a metallographic study is performed on a cross-section of the metal to inform on its micro-structure and avoid any risks of misdating that could be due to the recycling process or to exogenous carbon. Then, sampling is done by drilling in the most carburized areas of the cross-section that were determined by the metallographic observation. However, when the iron piece is located within the object, as in the case of some bronze statues reinforced with iron armatures, sampling is only possible by drilling the exposed part of the armature directly (Leroy et al. Reference Leroy, Delqué-Količ, Vincent, Baptiste, Vega and McGill2021). Careful observation is necessary to select the most appropriate part and avoid any damage to the artwork. Before drilling, the surface is sanded down with a grinding wheel until the metallic surface is exposed and possible contamination eliminated. The iron particles are then combusted at 850°C for 5 hr in an excess of CuO and a 1 cm pure Ag wire (Dumoulin et al. Reference Dumoulin, Comby-Zerbino, Delqué-Količ, Moreau, Caffy and Hain2017).
Another sampling protocol for iron alloys is being experimented with a laser beam. In the literature, this technique is used for isotopic analysis of tooth enamel and shells (Rosenheim et al. Reference Rosenheim, Thorrold and Roberts2008; Garcia et al. Reference Garcia, Feranec, Passey, Cerling and Arsuaga2015) and was also tested for 14C dating of organic matter by Watchman et al. (Reference Watchman, Lessard, Jull, Toolin and Blake1992). This method offers two advantages: the precision of sampling due to the sharp beam that can be computer-monitored, and the one-step production of CO2 that limits sample handling and consequently avoids possible contamination. A first experiment was carried out to test the feasibility of this sampling procedure on a cast iron sample GL03-24 (2–3%C) coming from an iron-making archaeological site—the Glinet site—whose operation is attested between 1480 and 1580 AD by historical texts (Arribet-Deroin Reference Arribet-Deroin2001; Leroy et al. Reference Leroy, L’Héritier, Delqué-Kolic, Dumoulin, Moreau and Dillmann2015). This iron piece was selected because of its homogeneous and high carbon content that are more suitable for an initial experiment with the laser beam. The laser beam was produced by an ytterbium pulsed fiber laser which provides a wavelength output at around 1064 nm (YLP-V2 1mJ series from IPG Laser) and operates at 20 W with 140 ns temporal width. A cross section was prepared and enclosed in a cell pumped until 10–5 mbar and filled with 250 mbar of pure oxygen. A 4.5 cm2 area was scanned by the laser beam for 8 hr and 4.6 mg of carbon in the form of CO2 was recovered for graphitization on the automated graphitization line (Dumoulin et al. Reference Dumoulin, Comby-Zerbino, Delqué-Količ, Moreau, Caffy and Hain2017). Two dates were obtained (Table 2)—360 ± 30 BP and 345 ± 30 BP—that gave a calibrated range between the middle of the 15th century and the middle of the 17th century, in perfect agreement with the expected period of metallurgical activity of the Glinet metallurgical site. These initial results suggest several possibilities for improvement. In particular, the laser ablation parameters need to be optimized to increase the carbon extraction yield and its oxidation in CO2.
Table 2 14C dates obtained on archaeological cast iron after collecting CO2 by laser ablation. The results are in agreement with the expected range of dates 1480–1580 AD.

Lead White Used as Cosmetic and Pigment
Lead white was one of the most important pigments used for more than 25 centuries. This pigment, composed of cerussite, (PbCO3) and hydrocerussite, (Pb3(CO3)2(OH)2) occurs in nature but was also manufactured from the 4th–3rd centuries BC to the early 20th century. During this long period, and until the 19th century, lead white was synthesized by corrosion, involving lead, vinegar and a fermenting medium (such as horse manure). Then, new industrial processes using fossil sources of CO2 were developed to produce large amounts of lead white. Synthetic lead carbonates have been shown to carry the carbon isotopic signature of the initial ingredients (Messager et al. Reference Messager, Beck, Blamart, Richard, Germain, Batur, Gonzalez and Foy2022; Beck et al. Reference Beck, Caffy, Delqué-Količ, Dumoulin, Goulas and Hain2023 in this collection) leading to a possible absolute dating of lead white by 14C when all the ingredients participating in its synthesis are of organic origin. This hypothesis has been confirmed by the successful radiocarbon dating of Greek cosmetics (Beck et al. Reference Beck2018), Roman collyria (Messager et al. Reference Messager, Beck, Germain, Degrigny and Serneels2021), pigment (Messager et al. Reference Messager, Beck, Blamart, Richard, Germain, Batur, Gonzalez and Foy2022) and paint (Beck et al. Reference Beck2018; Messager et al. Reference Messager2019; Hendriks et al. Reference Hendriks, Hajdas, Ferreira, Scherrer, Zumbühl and Küffner2019, Reference Hendriks, Kradolfer, Lombardo, Hubert, Küffner, Khandekar, Hajdas, Synal, Hattendorf and Günther2020b; Beck et al. Reference Beck, Messager, Caffy, Delqué-Količ, Perron and Dumoulin2020). On the contrary, when lead carbonates are produced using a fossil source of CO2, absolute dating is not possible. However, the absence of 14C allows the identification of modern productions that are therefore indirectly dated (Messager et al. Reference Messager, Beck, Blamart, Richard, Germain, Batur, Gonzalez and Foy2022).
To prepare carbonate samples for radiocarbon analysis, acid hydrolysis is usually performed. However, this procedure is not carbonate selective in the case of a mixture of lead white and calcite, which is very common in paintings. In order to avoid contamination by dead carbon from calcite, the thermal decomposition approach was investigated, showing that heating the sample to 400°C leads to the release of CO2 from lead carbonate only when mixed with calcite (Beck et al. Reference Beck, Messager, Coelho, Caffy, Delqué-Količ and Perron2019). However, when lead white and linseed oil are mixed to form a paint layer, part of the linseed oil also decomposes at 400°C (Messager et al. Reference Messager, Beck, de Viguerie and Jaber2020). The proportion of linseed oil extracted during the thermal preparation contributes to the radiocarbon dating of the paint layer together with lead white. If the two ingredients are contemporaneous, the partial decomposition of the binder does not alter the date obtained from lead white. In the case of acrylic-based paints, however, the small quantity of CO2 extracted will give an incorrect apparent age. To overcome this issue, it is necessary to decrease the heating temperature to 250°C–300°C as also pointed out by Hendriks et al. (Reference Hendriks, Caseri, Ferreira, Scherrer, Zumbuhl, Kuffner, Hajdas, Wacker, Synal and Gunther2020a) for paint reconstructions prepared with linseed oil, lead carbonate and calcium carbonate. In conclusion, it is important to chemically characterize the paint layer before 14C dating to adjust the decomposition temperature.
Calcium Oxalates
Dating rock paintings is difficult as the carbon content of the paint layers is tiny or sometimes non-existent. The 14C dating of calcium oxalate deposits covering the rock paintings can then provide a limit, a terminus ante quem for the age of the rock art. A technique was tested for the chemical extraction of oxalates (Figure 2) from the mineral crust taken from decorated walls in Namibia (Erongo Massif).
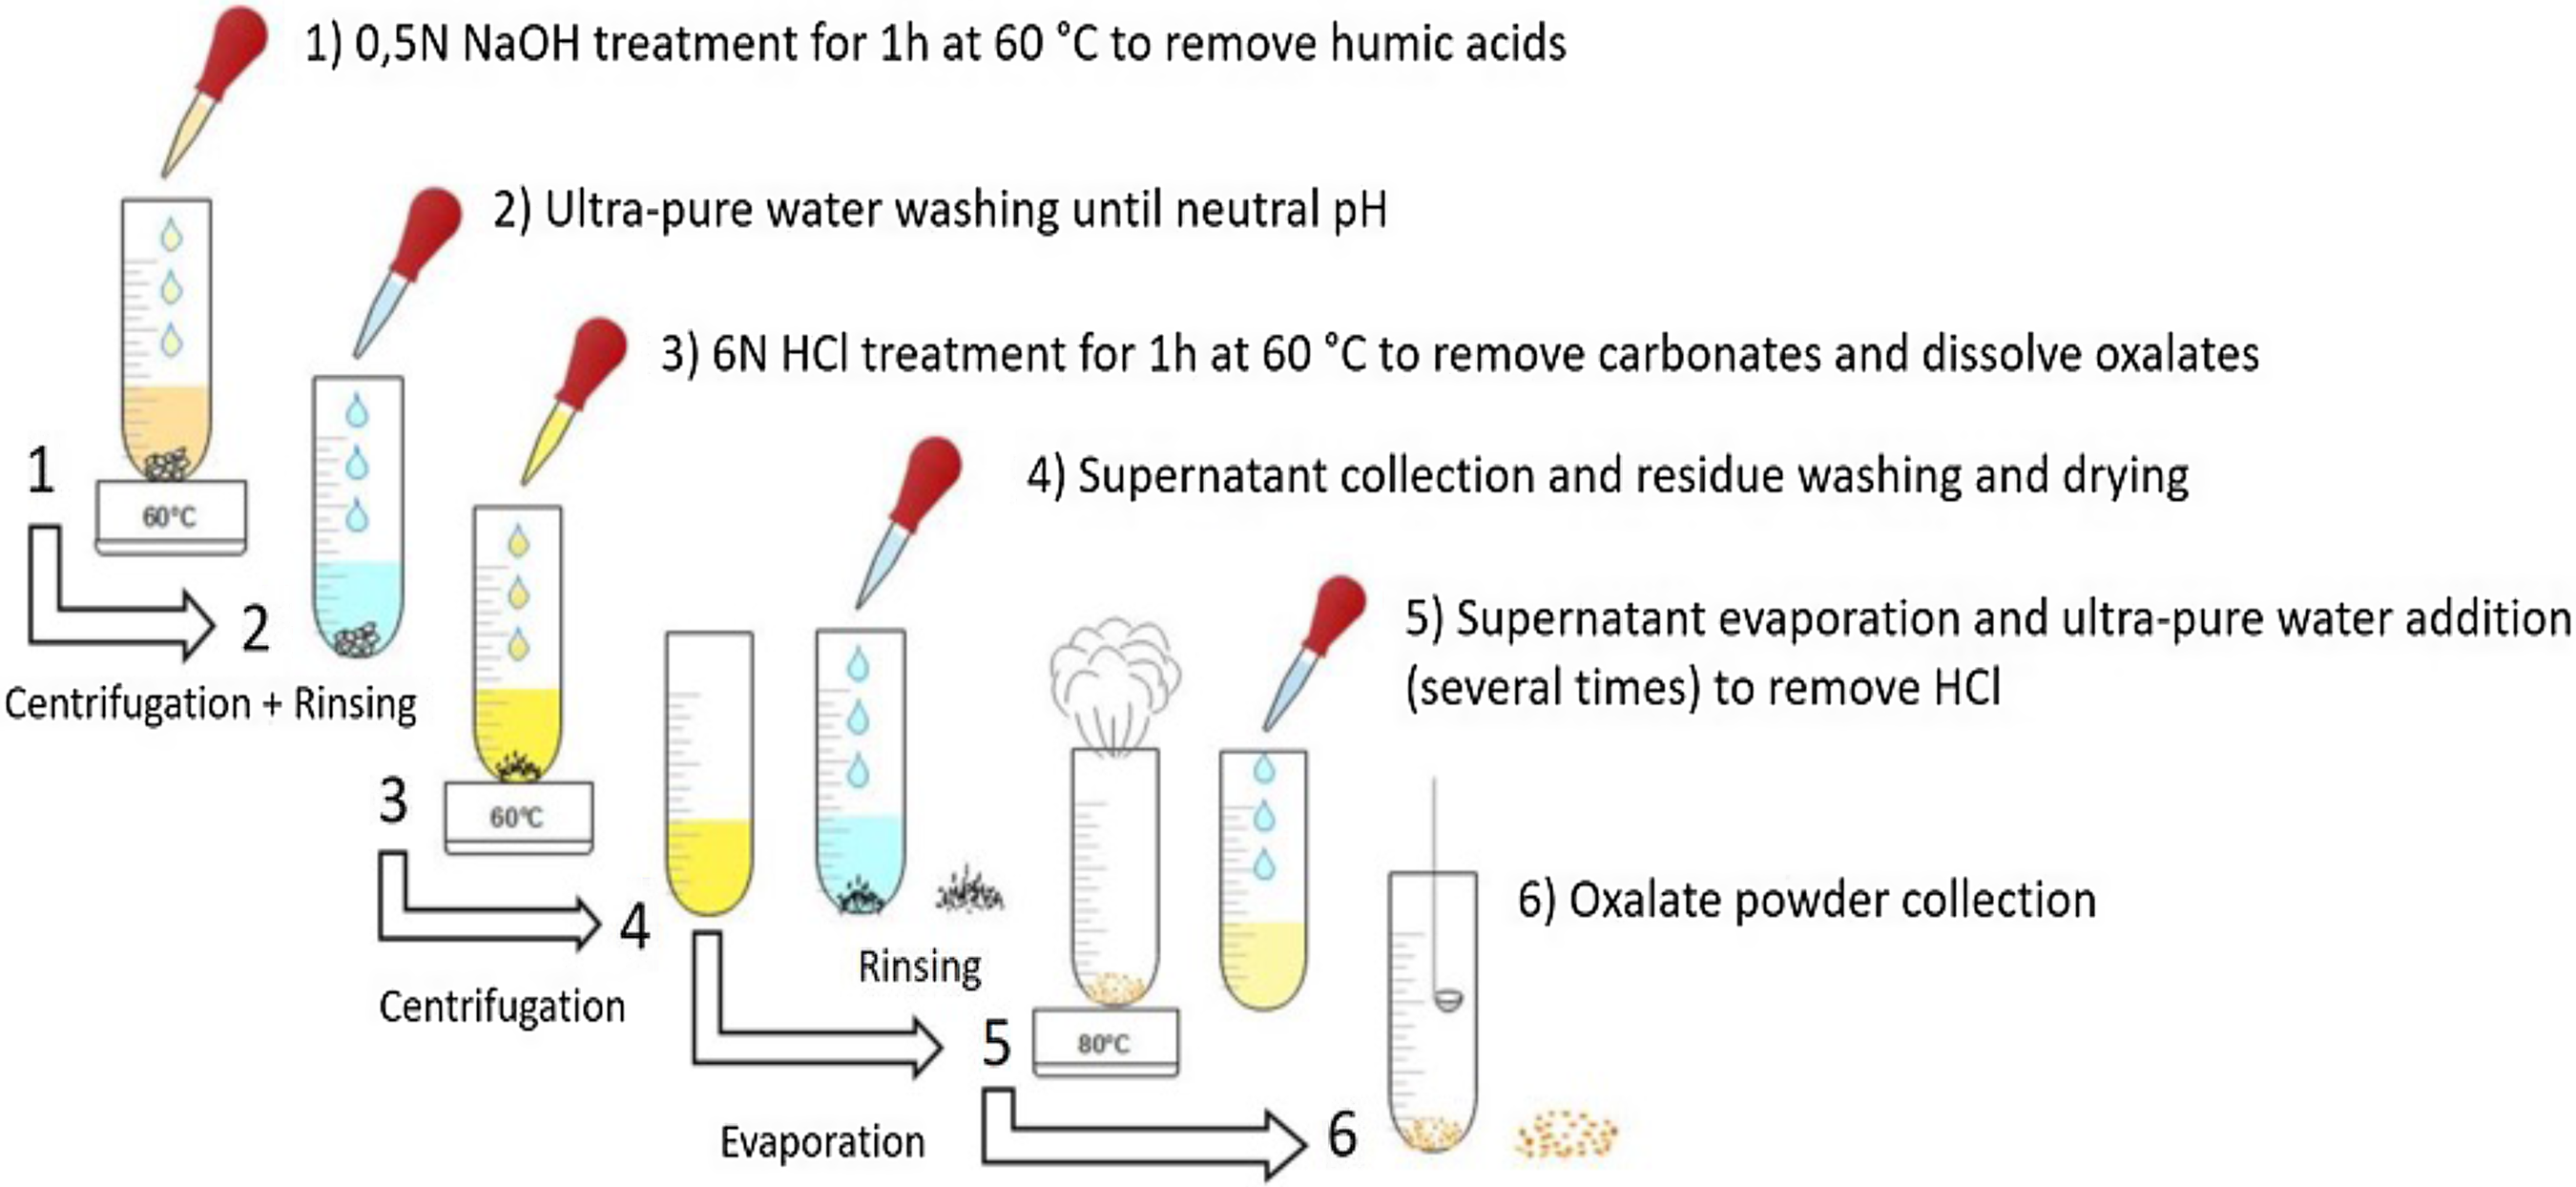
Figure 2 Protocol for calcium oxalate extraction developed at the LMC14 (from Dumoulin et al. Reference Dumoulin, Lebon, Caffy, Mauran, Nankela, Pleurdeau and Beck2020).
The powdered material (between 200 and 400 mg) was introduced in a NaOH solution (0.5N) at 60°C for 1 hr to remove humic acids. After extensive rinsing with Milli-Q® water, the sample was treated with 6N HCl at 60°C, to remove carbonates and to dissolve the calcium oxalates and in particular the whewellite (CaC2O4·H2O) and the weddellite (CaC2O4·2H2O). After 1 hr, the solution was centrifuged and the supernatant was decanted and saved. The precipitate, called “residue”, which contain various solids such as silica, pollen, charcoal or windblown material was removed. The supernatant containing oxalic and HCl acids was evaporated, washed with ultra-pure water and evaporated several times to remove a maximum of HCl with the evaporation. It avoids having strong acid fumes during combustion which can weaken and break the quartz tube.
Oxalate and the organic residues of the crusts were successfully separated and the different fractions were 14C dated. FTIR was used to monitor the different pre-treatment phases ranging from raw samples to pure oxalates as well as their organic residues. This preliminary technical study allowed us to define a robust and reliable protocol for oxalate extraction (Jones et al. Reference Jones, Levchenko, King, Troitzsch, Wesley, Williams and Nayingull2017; Dumoulin et al. Reference Dumoulin, Lebon, Caffy, Mauran, Nankela, Pleurdeau and Beck2020)
Cellulose Extraction
After the catastrophic fire of Notre Dame de Paris cathedral in 2019, several multidisciplinary working groups drew up a plan to study the building materials: stone, metal and wood. Our laboratory takes part in the CASIMODO national research project to refine the 14C calibration curve around the 12th century by comparing dendrochronological analyses of the wooden frame (oak) with 14C dating of cellulose tree rings (Daux et al. 2022).
The main components of wood are cellulose (40–60%), lignin (16–33%), hemicelluloses and easily extractable minor components (5–10%), such as resins or waxes. The relative component ratios depend on the type of tree and wood species (Němec et al. Reference Němec, Wacker, Hajdas and Gäggeler2010). Cellulose is a long-chain carbon-based glucan polymer (Leavitt and Danzer Reference Leavitt and Danzer1993) with a very stable molecular formula (C6H10O5)n. Cellulose remains unchanged and immobile over long periods of time, representing the isotopic composition of the original plant material, while lignin and hemicelluloses are considered susceptible to longer-term change. The carbon of these compounds can cross the boundaries of tree rings after their formation (Wilson and Grinsted Reference Wilson and Grinsted1977; Leavitt and Danzer Reference Leavitt and Danzer1993; Gaudinski et al. Reference Gaudinski, Dawson, Quideau, Schuur, Roden and Trumbore2005). Cellulose and hemicelluloses are collectively called holocellulose.
There are a large number of different treatments for the extraction of cellulose and they can depend considerably on the types of wood. Capano et al. (Reference Capano, Miramont, Guibal, Kromer, Tuna, Fagault and Bard2018) compared several protocols, two of which were selected for this study: the BABA-B (Base/Acid/Base/Acid/Bleaching) protocol, developed by Němec et al. (Reference Němec, Wacker, Hajdas and Gäggeler2010) and the ABA-B protocol proposed by Capano et al. (Reference Capano, Miramont, Guibal, Kromer, Tuna, Fagault and Bard2018). Some other protocols recommend eliminating the hemicellulose with a final step of sodium hydroxide (NaOH, 17.5%) to leave only the insoluble α-cellulose. The advisability of this final step is not agreed upon by all researchers and some consider it as a too destructive chemical treatment when the wood is old and poorly preserved. Furthermore, the study published in 2014 by Richard et al. showed that some tree species, such as oak and beech, did not need the NaOH treatment and a less intensive chemical procedure can actually lead to pure α-cellulose.
The tree ring samples are cut into small wood chips using a scalpel. An intercomparison sample of oak called FIRI H (Quercus robur) was prepared. The BABA-B protocol (Němec et al. Reference Němec, Wacker, Hajdas and Gäggeler2010) consists in leaving the samples in a bath of 5 mL of 4% NaOH at 75°C overnight (16 hr) to dissociate the alcoholic, phenolic and carboxylic groups of the main components of wood. Cellulose is then more accessible for subsequent treatments. The next day, ABA procedures are performed and samples are placed on a heat block at 75°C. A treatment with 4% HCl (5 mL) is carried out for 1 hr to eliminate the contamination of carbonates followed by a bath of 4% NaOH (5 mL) for 1 hr and a second step of 4% HCl (5 mL) for 1 hr to remove any absorbed atmospheric CO2. Finally, a bleach solution (8 g of NaClO2 with 300 mL of ultrapure water and 11 ml of 37% HCl) to remove lignin and other contaminants is applied for 2 hr and can be repeated if needed. The final extract is dried in an oven at 55°C overnight. The ABA-B treatment (Capano et al. Reference Capano, Miramont, Guibal, Kromer, Tuna, Fagault and Bard2018) is the same without the NaOH bath overnight. In our study we compared different treatment times to determine an optimised protocol for oak wood.
The quality of our extractions is controlled by Fourier transform infrared spectroscopy (FTIR) in attenuated total reflectance mode (ATR-FTIR). This allows the identification of the characteristic bands of the different compounds present in the wood. The spectrum of raw oak wood (FIRI H without pretreatment) was carried out in order to associate each absorption band with its component. Different characteristic bands appeared from the three main constituents of wood, namely cellulose, hemicelluloses and lignin, and were attributed according to the literature (Figure 3; Rinne et al. Reference Rinne, Boettger, Loader, Robertson, Switsur and Waterhouse2005; Antchukaitis et al. Reference Anchukaitis, Evans, Lange, Smith, Leavitt and Schrag2008; Fogtmann-Schulz et al. Reference Fogtmann-Schulz, Kudsk, Adolphi, Karoff, Knudsen and Loader2020). In order to monitor the effectiveness of the protocols, the absence of the lignin band (1508 cm–1) and hemicellulose band (1732 cm–1) was checked (Figure 3).
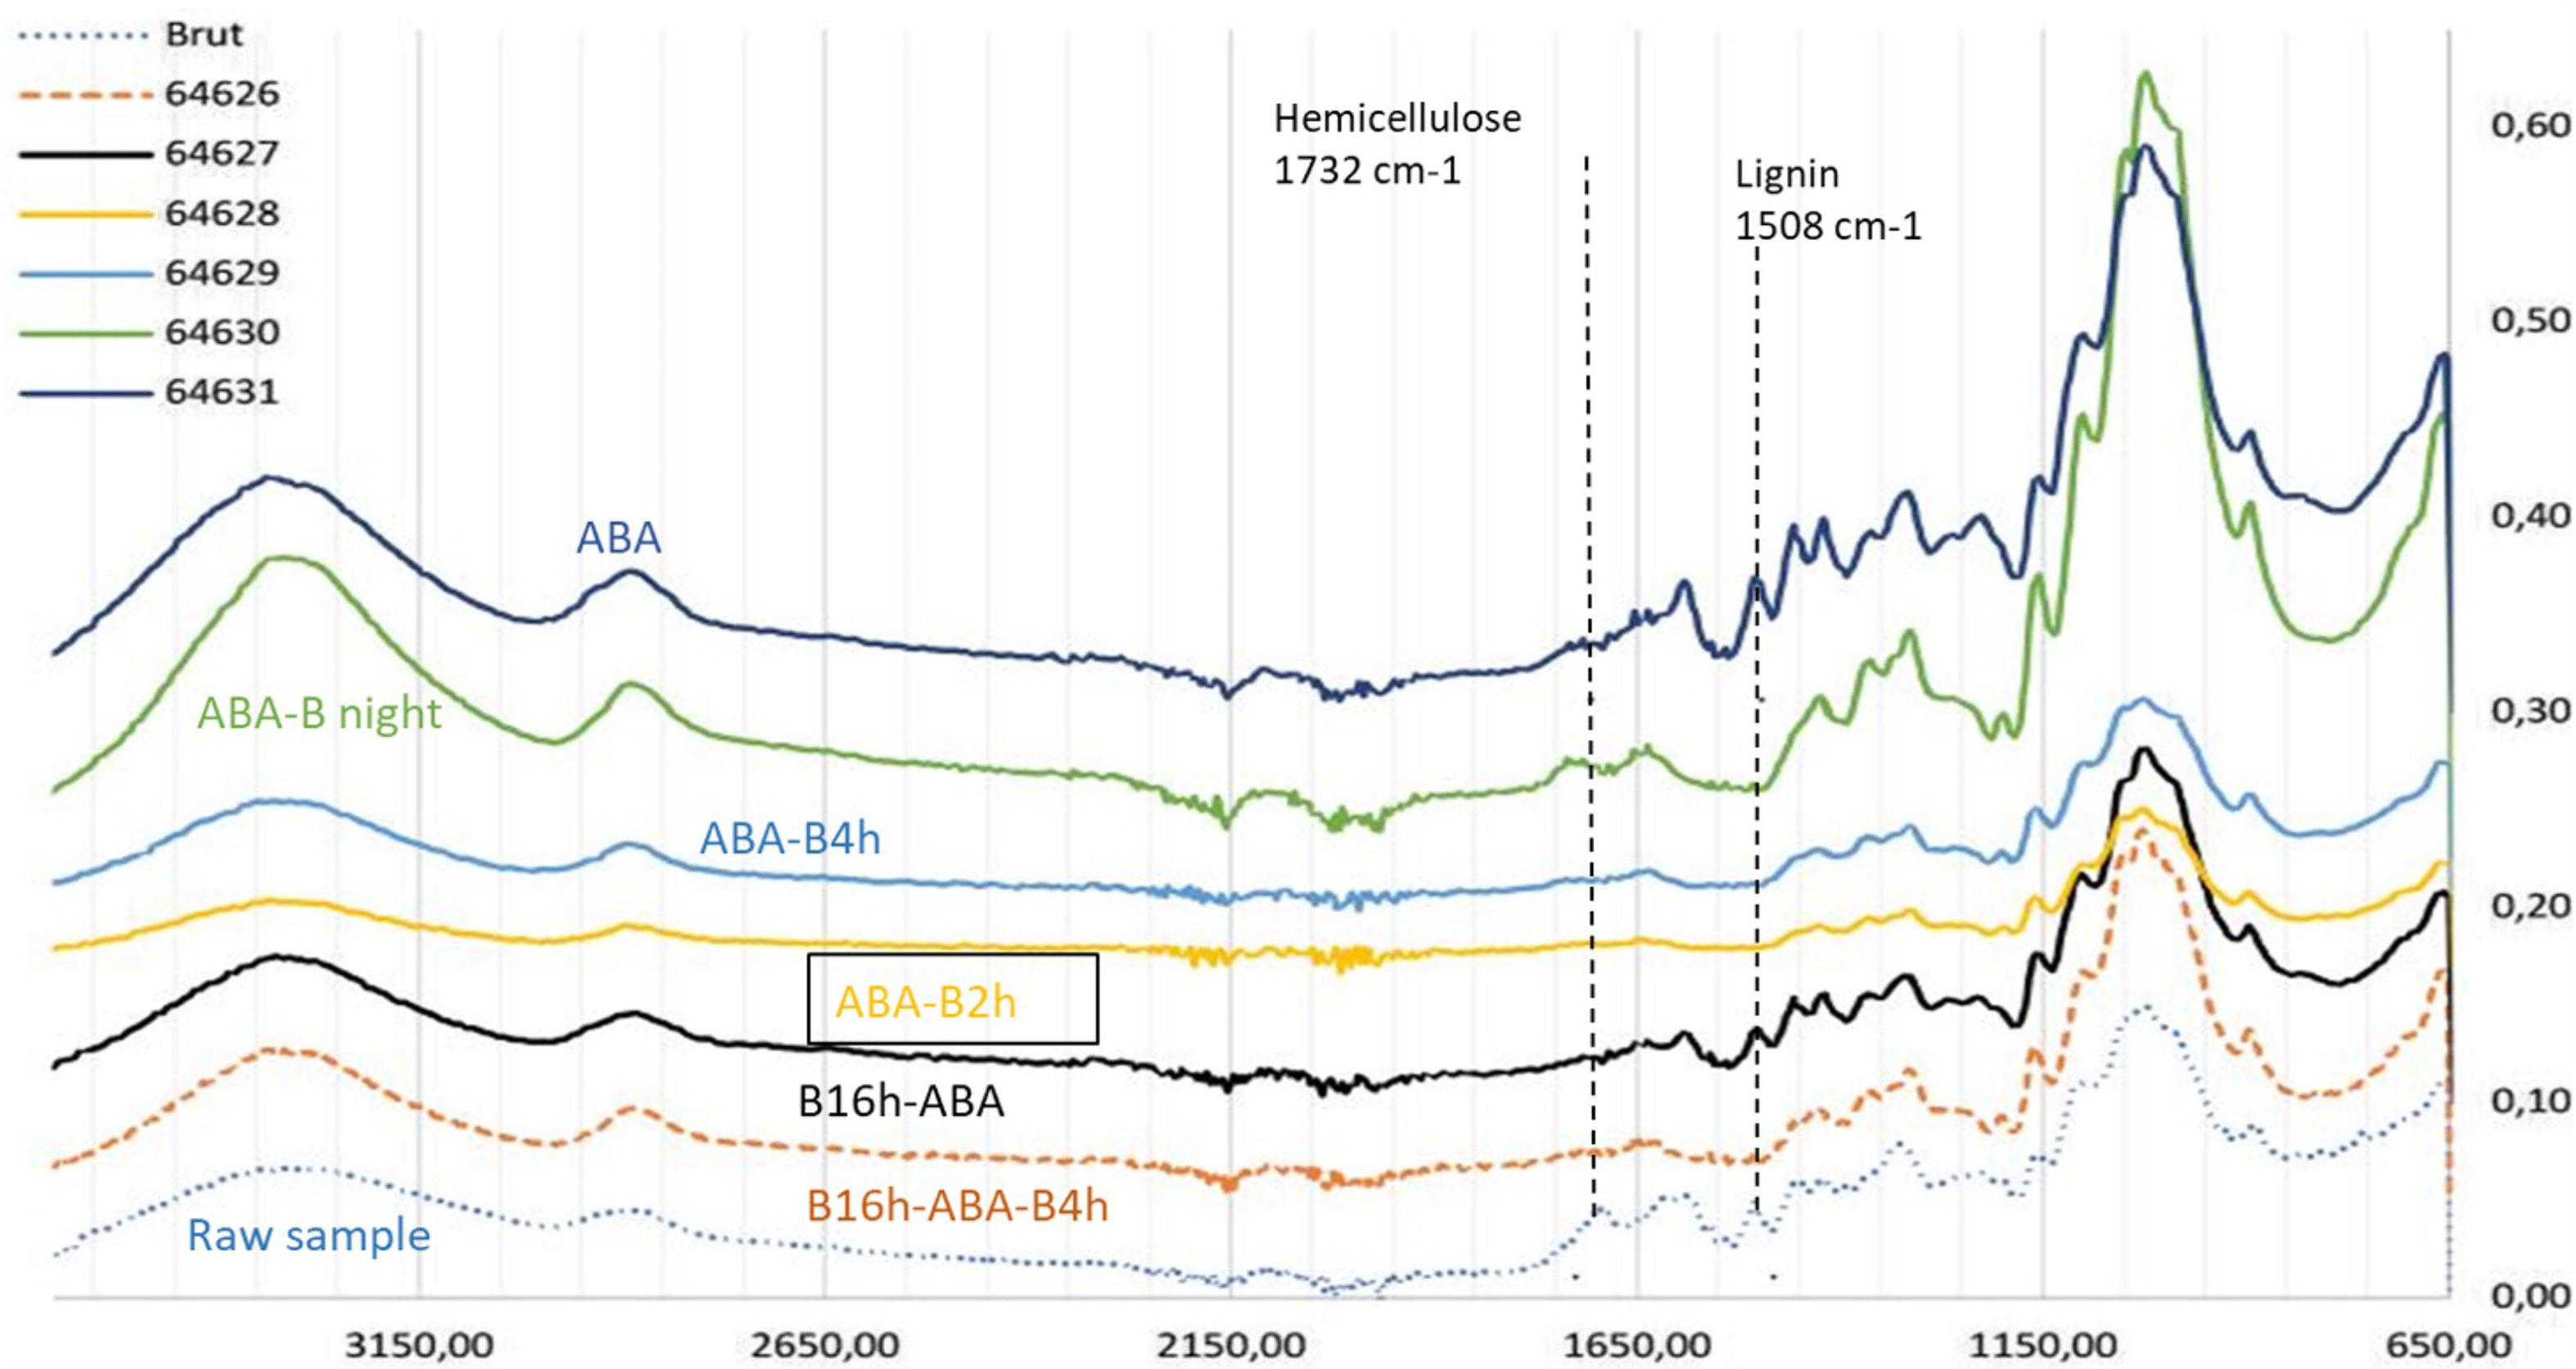
Figure 3 FTIR spectra of FIRI H oak sample according to the pretreatment procedure (ABA, ABA-Bleaching overnight, ABA-bleaching 4 hr, ABA-bleaching 2 hr, B16h-ABA-bleaching 4 hr, B16h-ABA-no bleaching). Raw FIRI H without any treatment shows a lignin band at 1508 cm–1 and a hemicellulose band at 1732 cm–1.
The spectra in Figure 3 show that for the FIRI H, the ABA- bleaching 2 hr is enough to remove the lignin and most of the hemicellulose. There is no need to apply a 4% NaOH bath at 75°C overnight (16 hr). It also confirms that the bleaching step is very important to remove lignin, which is still present with ABA or B(16h)-ABA treatments.
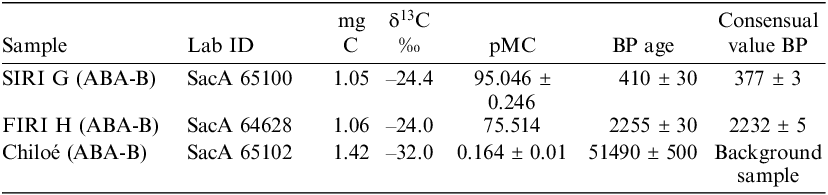
Then, the dating of three different wood samples (SIRI G, FIRI H and a wood background sample) was performed after an ABA-Bleaching 2 hr pretreatment. The results (Table 3) are in accordance with the consensual values within 1σ error (Scott Reference Scott2003; Scott et al. Reference Scott, Naysmith and Cook2017).
Table 3 14C measurements of three samples (SIRI G, FIRI H and a wood background sample).
The ABA-B procedure was chosen based on its accurate measurements on different ancient and blank wood samples. The treatment proposed by Capano et al. (Reference Capano, Miramont, Guibal, Kromer, Tuna, Fagault and Bard2018) presents many advantages: the overall duration is shorter than that of other procedures, the protocol is not too destructive in the case of small wood samples, and it removes lignin and a large part of hemicellulose. These treatments omit the post-bleaching bath in base solution (NaOH 17%) which does not appear to be necessary for oak wood.
Mortar
The 14C dating of mortars is a real challenge because the contaminants are of the same nature (CaCO3) as the sample itself. The idea is to date the atmospheric CO2 trapped during the hardening of the binder and which re-carbonated the lime mortar. However, recrystallization, delayed hardening, layered double hydroxide compounds (LDH), fire damage as well as geological carbonate can strongly disturb the dating (Labeyrie and Delibrias Reference Labeyrie and Delibrias1964; Stuiver and Smith Reference Stuiver and Smith1965; Heinemeier et al. Reference Heinemeier, Jungner, Lindroos, Ringbom, von Konow and Rud1997; Lindroos et al Reference Lindroos, Regev, Oinonen, Ringbom and Heinemeier2012; Ricci et al. Reference Ricci, Secco, Marzaioli, Terrasi, Passariello and Addis2020). In the framework of MODIS2 (Mortar Dating Inter-comparison Study number 2), the LMC14 proposed a preparation protocol based on the extraction of CO2 by thermal decomposition. This protocol was coupled to a preliminary study, carried out by a thermal gravimetric analysis (TGA), which made it possible to select the appropriate extraction temperatures (Moreau et al. Reference Moreau, Dumoulin, Jaber, Caffy, Delqué-Količ, Goulas, Hain, Perron, Setti and Sieudatforthcoming).
The mortar was gently crushed with pliers to avoid producing small grains of geological carbonates which can contaminate the lime mortar (Heinemeier et al. Reference Heinemeier, Ringbom, Lindroos and Sveinbjornsdottir2010). Sieves < 100 µm were used to collect the under 100 µm fraction of the powder. The sample was then characterized by TGA to determine the range of temperatures to be applied to release and collect the different CO2 fractions.
An amount of 200 mg of this <100 µm mortar powder was placed in a quartz tube with quartz wool (previously cleaned at 900°C overnight) to prevent the sample from being sucked into the vacuum line. The mortar powder was pre-heated at 550°C for half an hour to remove organic contaminants and layered double hydroxide (LDH) which can introduce young carbon dioxide (Ricci et al. Reference Ricci, Secco, Marzaioli, Terrasi, Passariello and Addis2020; Daugbjerg et al. Reference Daugbjerg, Lindroos, Hajdas, Ringbom and Olsen2021).
The preheating and the heating of the mortar were carried out on the same vacuum line. A succession of different temperature intervals (every 20–30°C) was applied and different fractions were collected to cover the working range determined by TGA. Each sample was graphitized and measured using the ARTEMIS facility (Dumoulin et al. Reference Dumoulin, Comby-Zerbino, Delqué-Količ, Moreau, Caffy and Hain2017; Moreau et al. Reference Moreau, Messager, Berthier, Hain, Thellier and Dumoulin2020). By comparing the different radiocarbon measurements, the aim was to locate a plateau corresponding to the CO2 release of lime mortar, before a dip and an aging created by the release of geological limestone. The correct age of the mortar should be located in this plateau.
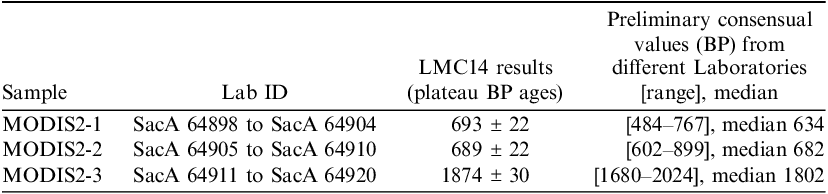
The definitive results for the MODIS2 intercomparison will be presented in a later article (Scott et al. Reference Scott, Lindroos, Barrett, Boudin, Hajdas, Olsen, Maspero, Marzaioli, Michaska, Sironic and Forthcomingforthcoming) but a summary of our results compared to the preliminary results of the laboratories participating to the intercomparison is presented in Table 4. More details can be found in this proceedings (Moreau et al. Reference Moreau, Dumoulin, Jaber, Caffy, Delqué-Količ, Goulas, Hain, Perron, Setti and Sieudatforthcoming).
Table 4 LMC14 results for three MODIS2 mortar samples and preliminary results of the other laboratories with the range of results and the median value. Several Id. Lab labels are shown for each sample, corresponding to the different temperature experiments necessary to determine the plateau zone of 14C.
CONCLUSION
The last overview of the chemical pretreatment procedures for LMC14 14C dating was published in 2017 (Dumoulin et al. Reference Dumoulin, Comby-Zerbino, Delqué-Količ, Moreau, Caffy and Hain2017) and these protocols still give very good results as show the results of last GIRI international intercomparison. While the routine procedures remain the same, new ones have been added to widen our range of datable materials. The studies undertaken by the LMC14 are the result both of collaboration with outside researchers and of active research by the members of the laboratory itself. In the coming years, all the LMC14 team will continue its efforts to address new challenges in 14C dating and to support the French scientific community in different fields and especially in archaeology.
ACKNOWLEDGMENTS
The authors thank Stéphanie Leroy and Enrique Vega from the Laboratoire Archéomatériaux et Prévision de l’Altération (IRAMAT UMR5060 CNRS et NIMBE UMR3685 CEA/CNRS) for their advice and assistance during the iron sample preparation for laser experiment and Maguy Jaber from the LAMS (Sorbonne Université) for the TGA experiments.


