


Introduction
Population-based surveys on the prevalence and causes of hearing loss are vital for planning and monitoring services for ear and hearing care. However, very few have been conducted. Globally, 466 million people are estimated to have moderate or worse hearing loss. This estimate is based on a synthesis of 49 population-based surveys conducted across the globe, a relatively small number of studies compared with the nearly 300 that have been included in global estimates of vision impairment.Reference Stevens, Flaxman, Brunskill, Mascarenhas, Mathers and Finucane1
Global estimates suggest that the prevalence of hearing loss is higher in low- and middle-income countries than high-income countries; however, many low- and middle-income countries lack locally relevant data from which to plan ear and hearing services.Reference Stevens, Flaxman, Brunskill, Mascarenhas, Mathers and Finucane1 No global estimates on the main causes of hearing loss exist. This is because of variation in the procedures followed in assessing causes of hearing loss across population-based surveys (e.g. otoscopy alone vs otoscopy and tympanometry or tuning forks) as well as difficulties faced in assigning causes of hearing loss in cross sectional studies.Reference Stevens, Flaxman, Brunskill, Mascarenhas, Mathers and Finucane1–Reference Bright, Mactaggart, Kim, Yip, Kuper and Polack3 Some of the common causes of hearing loss include otitis media, noise exposure, ototoxicity and ageing (presbycusis).Reference Stevens, Flaxman, Brunskill, Mascarenhas, Mathers and Finucane1,Reference Olusanya, Neumann and Saunders4
In 1999, the World Health Organization (WHO) developed an all-age survey protocol to collect data on the prevalence and causes of hearing loss in population-based surveys. This was an important development as a standardised methodology was lacking. However, the methodology was not widely adopted, partly because the protocol was resource intensive.Reference Bright, Mactaggart, Kim, Yip, Kuper and Polack3 High costs arise from the equipment, personnel and large sample size required to accurately estimate prevalence in an all-age sample. In order to facilitate collection of needed population-based data in low- and middle-income countries, a new survey protocol has been developed: the Rapid Assessment of Hearing Loss.
The aim of the Rapid Assessment of Hearing Loss is to provide baseline data for planning ear and hearing services in a population, which is typically at district or another sub-national level. In addition, Rapid Assessment of Hearing Loss can be used to monitor progress after implementation of interventions. The Rapid Assessment of Hearing Loss survey is rapid because it focusses on people aged over 50 years, based on evidence from two low- and middle-income countries that the majority of hearing loss (more than 70 per cent) is experienced by this age group, and the distribution of causes are representative of the total population.Reference Bright, Mactaggart, Kim, Yip, Kuper and Polack3 Restricting the population to this age group reduces the sample size required, which reduces the time and thus costs of undertaking the survey. Another way to reduce costs is to simplify the examination protocol to assess hearing acuity and determine the causes of hearing loss.
In order to assess hearing acuity in surveys, pure tone audiometry is required to determine the degree of hearing loss. Validated mobile-based alternatives to screening audiometers exist, which are less costly than available alternatives.Reference Bright and Pallawela5–Reference Van Tonder, Swanepoel, Mahomed-Asmail, Myburgh and Eikelboom7 Their portability facilitates data collection in household surveys.Reference Bright, Shan, Xu, Liang, Xiao and Ensink8 Determining the causes of hearing loss is complex. There are three main types of hearing loss: sensorineural (caused by inner-ear pathologies), conductive (caused by outer and middle-ear pathologies) and mixed (a combination of the two).
Sensorineural hearing loss is caused by a range of often overlapping risk factors including: age-related inner-ear degeneration, noise exposure, infectious diseases and ototoxic drugs. A clinical history can help to ascertain probable causes; however, assigning one exact cause of sensorineural hearing loss is difficult. Given that the majority of hearing loss is sensorineural in nature and difficult to accurately attribute cause to,Reference Hopkins, Aminoff, Boller and Swaab9 previous population-based surveys have tended to classify a large proportion of hearing loss as unknown.Reference Bright, Mactaggart, Kuper, Murthy and Polack2,Reference Mulwafu, Kuper and Ensink10,Reference Ferrite, Mactaggart, Kuper, Oye and Polack11 Attempts to diagnose the causes of conductive hearing loss can often be made by otoscopic examination; however, the observations made are subjective, and subtle features, such as those occurring in middle-ear effusions, can be easily missed. Tympanometry is a tool that provides quantitative information on the function of the middle ear (compliance of the tympanic membrane and ear canal volume) including the presence of middle-ear fluid. Tympanometry can therefore point towards a possible conductive component in hearing loss that would otherwise be potentially misclassified as sensorineural with unknown cause. However, the value of including tympanometry in the diagnosis of causes of hearing loss within population-based surveys is unclear.
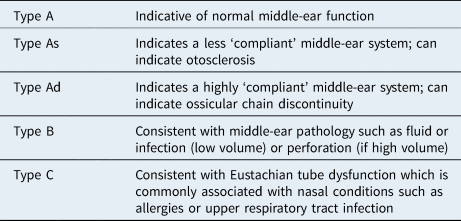
Tympanometry provides a graphical display of middle-ear function in the form of a tympanogram. Tympanograms are classified as type A (peaked, normal), type B (flat, abnormal) and type C (negative middle-ear pressure, possible pathology). A type B tympanogram typically indicates either middle-ear effusion (low ear canal volume) or a perforation (high ear canal volume). The most common cause of middle-ear effusion, and thus type B tympanograms, is otitis media with effusion (OME) or acute otitis media.Reference Onusko12 However, Type B tympanograms can also be found in less common conditions such as middle-ear tumours or tympanosclerosis.Reference Onusko12 Despite widespread use in clinical settings, evidence of the diagnostic accuracy of tympanometry varies across studies. A systematic review found that for the diagnosis of OME in children, tympanometry has a sensitivity of 90–94 per cent, but specificity ranges between 50 and 75 per cent when compared with the ‘gold standard’ of myringotomy, which is not feasible in a survey setting.Reference Rosenfeld R, Shin, Schwartz, Coggins, Gagnon and Hackell13 This suggests a high number of false positives, which may result in unnecessary follow-up appointments or referrals. Similar evidence from adult populations is lacking.
In previous surveys in low- and middle-income countries, acute otitis media and OME have not been reported as major causes of hearing loss in either adults or children.Reference Bright, Mactaggart, Kuper, Murthy and Polack2,Reference Ferrite, Mactaggart, Kuper, Oye and Polack11 This may be because studies have relied on otoscopy without tympanometry and therefore have been unable to detect OME because these conditions do not always result in a hearing loss or because they are not common. Tympanometry could help clinicians to determine the presence of middle-ear disease in the population and therefore reduce the proportion of probable sensorineural hearing loss, the majority of which is because of unknown causes. Thus, tympanometry could reduce the potential for misclassification of the causes of hearing loss. This may have implications for service needs as the majority of outer and middle-ear pathologies require medical and surgical management, whereas sensorineural hearing loss requires rehabilitation such as a hearing-aid fitting. Only 3 of the 21 previous surveys in low- and middle-income countries have included tympanometry in the assessment protocol.Reference Abdel-Hamid, Khatib, Aly, Morad and Kamel14–Reference Ramma and Sebothoma16 One reason for this may be the high cost to purchase and maintain the equipment and consumables. Based on these factors, consideration of whether tympanometry should be included in a rapid population-based survey of hearing loss, alongside otoscopy and clinical history, is essential.
This study aimed to determine the value of adding tympanometry to the Rapid Assessment of Hearing Loss survey protocol, a hearing loss survey of people aged over 50 years. Specifically, the results of the diagnoses made on otoscopy alone are compared with the tympanometry results.
Materials and methods
Settings
A nationally representative population-based survey of adult eye health was carried out in February to July 2019 in The Gambia. Embedded within this survey, the Rapid Assessment of Hearing Loss methodology was completed for one quarter of participants. Although the Rapid Assessment of Hearing Loss typically uses an age cut-off of 50 years, this survey used a younger cut-off point of 35 years to align with the aims of the eye health survey. The methodology of the full survey can be found in Hydara et al.Reference Hydara, Bastawrous, Bell, Boggs, Bright and Bobat17
Design and sample size
A cross-sectional population-based survey design was employed. The sample size, calculated using a standard formula, was adjusted for a design effect of 2.5, a non-response of 20 per cent with a margin of error of 20 per cent around the estimate. With these adjustments, the required sample size was 10 800. The target sample size for the Rapid Assessment of Hearing Loss component was 2700. This sample size was deemed adequate for detecting a 9 per cent prevalence of moderate or worse hearing loss in people aged over 50 years (with 20 per cent margin of error; 1.5 design effect, 95 per cent confidence interval).Reference Bright, Mactaggart, Kim, Yip, Kuper and Polack3
Sampling
A two-stage sampling strategy was employed. In the first stage, clusters were selected using probability proportionate to size sampling with the most recent census (2013) as a sample frame. In each cluster, 30 people were included in the survey. Therefore, to reach the desired sample size, 360 clusters were required (10 800/30). The hearing component was included in 90 of these clusters. Enumeration area maps were provided by The Gambia Bureau of Statistics. All residents aged over 35 years per selected enumeration area were enumerated, and 1 segment of 30 adults was selected at random to participate in the study. All adults in the selected segment were then invited to attend a central location for examination the following day.
Data collection
Data were collected in a central location, which differs from the typical Rapid Assessment of Hearing Loss survey where tests are completed in the household. The reason for this was that the wider survey included a range of examinations (detailed eye examination using desktop slit lamps and mydriatic fundus cameras, blood tests and anthropometry) using equipment that was not portable. Basic sociodemographic information was collected by an enumerator at the household. At the central location, participants completed a questionnaire on clinical history and risk factors for hearing loss and then underwent a hearing test, otoscopy and tympanometry. An audiology nurse conducted all three assessments. All data were collected electronically on mobile tablets using Open Data Kit (Get ODK) software for collecting and managing data.
Hearing test
Hearing assessment was conducted using hearTest (hear X, Pretoria, South Africa), a validated smartphone-based automated audiometry system.Reference Sandstrom, Swanepoel de, Myburgh and Laurent6,Reference Van Tonder, Swanepoel, Mahomed-Asmail, Myburgh and Eikelboom7 Frequencies tested included 500, 1000, 2000 and 4000 Hz in each ear. hearTest is coupled with circum-aural Sennheiser (Wennebostel, Germany) HD280 headphones and is used for air-conduction audiometry only. Calibration was conducted according to International Standards Organisation protocols.
Ear examination and clinical history
Following the hearing test, all participants underwent otoscopic examination by the audiology nurse. A structured questionnaire was completed, detailing the features of the ear canal and tympanic membrane. A decision-support algorithm was written into the mobile-based (Open Data Kit) questionnaire which prompted examiners on the most probable diagnosis based on the observed features. For all ears, regardless of hearing acuity, a diagnosis was made based on the ear examination.
Outcomes included: outer ear condition (otitis externa, impacted wax and foreign body), middle-ear condition (otitis media with effusion, acute otitis media, chronic otitis media (dry or wet), or other middle-ear condition) and normal ear examination.
For ears with hearing loss (pure tone average more than 25 dB), a probable cause was assigned based on ear examination and clinical history. Probable causes included: outer ear condition (as above), middle-ear condition (as above), sensorineural hearing loss with known cause (infectious disease, noise exposure, ototoxic medication, congenital, non-infectious condition), sensorineural hearing loss with unknown cause and mixed (conductive and sensorineural). Sensorineural hearing loss with unknown cause included age-related hearing loss because there is no diagnostic test for this.
Tympanometry
Following the ear examination and diagnosis, tympanometry was completed. A Senteiro Desktop Screening Tympanometer (class 2; Path Medical GmbH, Germering, Germany) was used. Tympanometry was not undertaken for participants with active discharge, excessive wax or foreign body, pain, recent surgery, or canal atresia unless the examiner felt it was safe to do so. The results of tympanometry were recorded in the questionnaire, but the diagnosis made based on otoscopy was not altered based on the results of tympanometry. The tympanometer output included the type of graph (automated analysis), which minimised the amount of interpretation required by the audiology nurse. The types of tympanograms included in the results included those shown in Table 1. If the participant was unable to be tested (because of contraindications or other reasons), this was recorded. Training and observation of fieldwork ensured that this process was followed throughout data collection.
Table 1. Tympanogram types
Data analysis
All data, collected on Open Data Kit, was uploaded to a secure server and imported into Stata (version 15.0; StataCorp, College Station, USA) for management and analysis. The prevalence of hearing loss and ear disease will be reported separately. Descriptive analysis of the attributed proportion of causes of hearing loss using otoscopy only and otoscopy and tympanometry combined are reported. The estimated costs of including tympanometry in a population-based survey protocol were assessed based on the actual costs of equipment used in this survey.
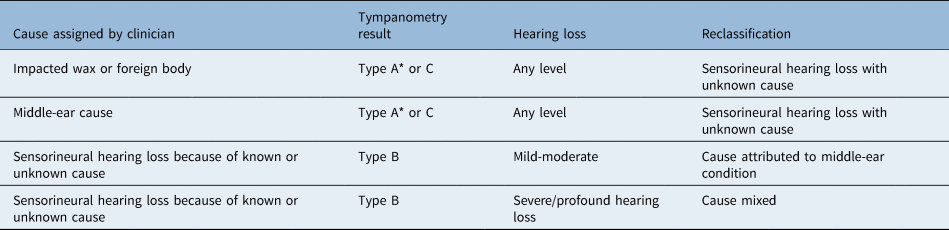
The key Rapid Assessment of Hearing Loss outcomes include prevalence of hearing loss using WHO definitions, probable causes of hearing loss, prevalence of ear disease, and need for ear and hearing services in the population. A sensitivity analysis was conducted to assess how these outcomes differ if tympanometry is included. Two scenarios were compared in the analysis: firstly, Rapid Assessment of Hearing Loss survey outcome using the clinician assigned diagnosis (based on otoscopy and clinical history) and secondly, Rapid Assessment of Hearing Loss survey outcome including the results of tympanometry. In order to make these comparisons, the cause assigned by the clinician during fieldwork was reclassified during analysis based on tympanometry results according to certain assumptions (see Table 2). The diagnosis made based on otoscopy and clinical history was not changed if tympanometry was not performed.
Table 2. Assumptions made to reassign causes of hearing loss according to the results of tympanometry
* Type As and Ad not included
Reclassification of the causes of hearing loss
Among those with hearing loss (pure tone average of more than 25 dB HL in either ear), the clinician-assigned cause (outer ear condition, middle-ear condition, sensorineural (known), sensorineural (unknown), or mixed) was reclassified according to the assumptions shown in Table 2.
The reclassifications were based on evidence of what the types of tympanograms indicate in clinical settings (Table 2). For example, a type A or C tympanogram indicates that there is not an obstruction in the outer ear canal and the middle-ear function is likely to be normal.Reference Onusko12 Therefore, if the clinician assigned the cause of hearing loss as wax or foreign body and a type A or C tympanogram resulted, then the cause was unlikely to be wax or foreign body, and this would be reclassified. Further, if the cause of hearing loss was assigned as a result of a middle-ear condition but a type A or C tympanogram was found, then this was more likely to be sensorineural in nature. Conversely, if a type B tympanogram was present when the diagnosis was sensorineural hearing loss, reclassification was made based on the degree of hearing loss. The maximum conductive hearing is typically accepted to be 60 dB.Reference Feldman18 Thus, for mild or moderate hearing loss with type B tympanograms, the cause was reassigned as a result of a middle-ear condition. For severe to profound hearing loss, the cause was reassigned as mixed.
Reclassification of the prevalence of ear disease
Amongst all participants (with and without hearing loss), the clinician assigned outcome of ear examination (normal, outer ear condition, middle-ear condition) was reclassified according to the assumptions shown in Table 3.
Table 3. Assumptions made to reassign clinician assignment according to results of tympanometry
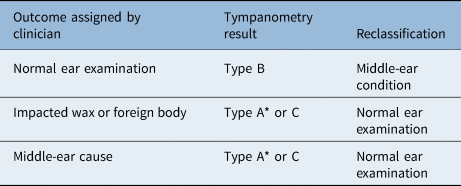
* Type As and Ad not included
Ethical considerations
Ethical approval was obtained from the London School of Hygiene and Tropical Medicine Observational Research Ethics Committee and Medical Research Council Unit – The Gambia Joint Ethics Committee. All participants were given or were read a participant information sheet in the local language that covered the risks and benefits of taking part in the study. Informed consent in the form of a signature or thumb print was obtained from all research participants. If participants were identified as needing ear and hearing services, they were referred to relevant services, and the audiology nurse provided counselling and referrals for those in need.
Results
Table 4 shows the age and sex demographics of the sample. A total of 1671 people completed the hearing component of the survey out of 2800 eligible participants (59.6 per cent response rate). Women made up 70.6 per cent of the sample. The mean age was 49.6 years. In the left and right ears, at least 94 per cent of people had complete tympanometry results. The majority of ears had type A tympanograms (68.8 per cent left; 57.9 per cent right). A type B tympanogram was the outcome in 8.4 per cent of left ears and 13.4 per cent of right ears.
Table 4. Age and sex demographics of sample: number with hearing loss and results of tympanometry

* Pure tone average of thresholds at 500, 1000, 2000, 4000 Hz of more than 25 dB HL
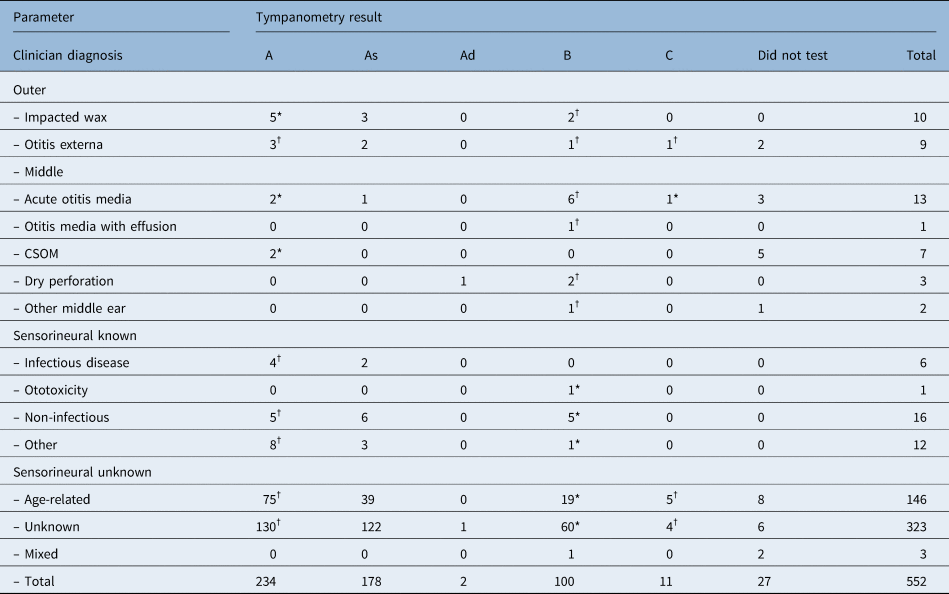
The sensitivity analysis is shown in Table 5 with a more detailed display of the reclassifications in the Appendix (Appendix 1–4). Among people with hearing loss, including tympanometry leads to a higher proportion diagnosed with middle-ear conditions. In the left ear, with otoscopy and clinical history alone, 4.8 per cent (n = 26) were diagnosed with middle-ear conditions; with tympanometry this increased to 12.6 per cent (n = 66). In the right ear, these proportions were 4.7 per cent (n = 26) and 18.1 per cent (n = 100). Thus, by including tympanometry, the proportion of hearing loss assigned to middle-ear conditions will more than double (2.6 times in the left ear and 3.8 times in the right ear). The proportion with sensorineural hearing loss because of unknown cause reduced accordingly in both ears (from 83.2 per cent to 77.9 per cent in the left ear and from 85.0 per cent to 73.4 per cent in the right ear). A small number of people with hearing loss originally recorded as having impacted wax and foreign bodies were reassigned to sensorineural hearing loss, reducing the proportion of people with outer ear conditions in both ears. Overall, 13.9 per cent (n = 76) of causes in the left ear and 17.4 per cent (n = 96) in the right ear were potentially misclassified by using otoscopy and clinical history alone.
Table 5. Diagnosis made on otoscopy and clinical history compared with the recoded diagnosis based on results of tympanometry

Table 6 shows a comparison of results on the presence and type of ear disease with and without using tympanometry. As with the causes of hearing loss, the prevalence of middle-ear disease increased when tympanometry results were considered. In the left ear, the increase was from 2.6 per cent to 8.5 per cent, and in the right ear the increase was from 2.8 per cent to 13.1 per cent. Overall, the proportion that were potentially misclassified in the left ear was 7.4 per cent (n = 124) and in the right ear was 12.4 per cent (n = 203).
Table 6. Diagnosis of presence of outer and middle-ear disease compared with the recoded diagnosis based on the results of tympanometry

Costs
If tympanometry is included in the Rapid Assessment of Hearing Loss protocol, each team would need at least one tympanometer. Based on the full cost of the tympanometer used for this study (£3425), this adds substantial cost to the survey of nearly £7000 for two teams. The hearTest device costs £630, and thus for two Rapid Assessment of Hearing Loss teams the cost is £2520 (2 devices per team). Otoscopes range in cost; however, in this survey we used an ArcLite, which has a cost of £48 (£96 for a two-team survey). Thus, including tympanometry increases the equipment costs for the survey by 72 per cent (£2616 vs £9466).
Discussion
This study aimed to determine the implications of including tympanometry in the recently developed Rapid Assessment of Hearing Loss survey protocol. We found that by including tympanometry, the proportion of hearing loss attributed to middle-ear conditions will more than double (2.6 times in the left ear and 3.8 times in the right ear). The proportion of hearing loss assigned to unknown causes will reduce slightly. Overall, 13.9 per cent of causes of hearing loss in the left ear and 17.4 per cent in the right were potentially misclassified by not including tympanometry. In addition, the overall proportion of people with middle-ear disease increased by including tympanometry because of 7.4 per cent of left ears and 12.4 per cent of right ears being misclassified as having a normal ear examination in the absence of tympanometry.
Few studies are available for comparison. Our findings contrast to a South African study, which compared video otoscopy with tympanometry among 87 patients with human immunodeficiency virus who also underwent audiometry (aged more than 18 years).Reference Sebothoma and Khoza-Shangase19 Two ENT specialists analysed the video otoscopy images independently of tympanometry results and noted the presence or absence of middle-ear pathology using the images alone. Middle-ear pathology was diagnosed in 8 per cent of the sample based on tympanometry and 10.6 per cent when video otoscopy was utilised. In contrast, our study found a higher proportion with middle-ear disease when tympanometry was included compared with otoscopy alone. This may be because of the use of standard otoscopy in our study, rather than video otoscopy. In a Danish study, general practitioners examined 3176 children (aged less than 16 years) with standard otoscopy and provided an initial diagnosis. Subsequently, tympanometry was performed, and the practitioners recorded a final decision about the diagnosis. A change in diagnosis resulted for over a quarter of the children (26.4 per cent) (e.g. normal diagnosis became otitis media with effusion (OME), acute otitis media became OME and OME became a normal diagnosis)..Reference Johansen, Lildholdt, Damsbo and Eriksen20 The authors suggested that this change in diagnosis could result in more appropriate treatment and follow up suggesting that tympanometry improved diagnosis. These findings concur with the findings of our study.
Several studies among children have compared the accuracy of tympanometry with that of pneumatic otoscopy specifically for detecting OME, using myringotomy as a ‘gold standard’. Variable results have been found. One study found tympanometry and pneumatic otoscopy had similar sensitivity but tympanometry had a higher specificity,Reference Finitzo, Friel-Patti, Chinn and Brown21 two studies reported comparable diagnosis on tympanometry and pneumatic otoscopy,Reference Toner and Mains22,Reference Harris, Hutchinson and Moravec23 and one study reported tympanometry had higher sensitivity but lower specificity.Reference Rogers, Boseley, Adams, Makowski and Hohman24 The sample sizes of these studies were typically quite small which may limit generalisability of findings. Furthermore, it is difficult to compare them with the results of our study given that we used standard otoscopy rather than pneumatic and did not measure accuracy.
The use of otoacoustic emissions testing (OAE) was considered as part of the Rapid Assessment of Hearing Loss as it could be considered to provide differentiation between inner- and middle-ear hearing loss. Evaluation of the possible use of OAE determined this not to be useful in respect of Rapid Assessment of Hearing Loss because of cost, accuracy and limitations in determining degree. In addition, the restriction of the Rapid Assessment of Hearing Loss to the over 50-year age group limited the value of OAE.
Implications for rapid assessment of hearing loss
Our findings suggest that including tympanometry in the survey protocol would improve the accuracy of the diagnosis of causes of hearing loss and identification of the presence of ear disease. The aim of Rapid Assessment of Hearing Loss surveys is to inform ear and hearing service planning (i.e. medical and surgical services, provided by ENT specialists, and rehabilitative services, provided by audiologists and speech therapists). Including tympanometry would result in a higher proportion of people identified as needing ENT services, including medication (for acute otitis media) or surgical assessments (for chronic otitis media) and a lower proportion in need of rehabilitation services (for those with sensorineural hearing loss).
There are dangers in these potential misclassifications. For example, one danger is missing an opportunity to provide a simple treatment, such as antibiotics, for acute otitis media and instead referring a participant unnecessarily. Conversely, those misclassified as having middle-ear disease, when instead they need hearing aids, will be referred and counselled incorrectly. This may have an impact on future health-seeking behaviour for participants and creates inefficiencies in already constrained health systems. This is important in contexts where referral uptake for specialist services is typically low, where incorrect counselling may impact patient decision-making.Reference Bright, Mulwafu, Thindwa, Zuurmond and Polack25,Reference Baum, Mulwafu, Phiri, Polack and Bright26 Based on these findings, it is recommended that tympanometry is included in future Rapid Assessment of Hearing Loss surveys. However, this will incur the additional costs of the tympanometers.
Strengths and limitations
This study has several strengths. It was a large population-based survey that used robust multi-stage sampling techniques to select participants. Validated clinical tools were used. It used the standardised Rapid Assessment of Hearing Loss methodology for assessment of hearing acuity and assessment of causes.
There are limitations with this analysis that need to be taken into account when interpreting the results of this study.
We have made substantial assumptions in order to enable meaningful comparisons between clinician judgement and tympanometry. The assumptions used have some limitations. Firstly, a type A tympanogram does not always indicate normal middle-ear function. Type A can result when somebody has tympanosclerosis or otosclerosis, (usually type As) or ossicular chain discontinuity (type Ad). Therefore, we did not reclassify the cause of hearing loss for type As or type Ad as we were not as certain about whether the hearing loss was because of middle- or inner-ear causes.
• Population-based surveys of the prevalence and causes of hearing loss are vital for planning and monitoring services
• No global estimates on the main causes of hearing loss exist
• This study aimed to determine the implications of including tympanometry in the Rapid Assessment of Hearing Loss survey
• The value of adding tympanometry to population-based survey protocols is a higher estimated increased detection of middle-ear disease
• These findings have implications in terms of informing service needs
• A higher number of people will be classified as needing medical or surgical services, and a slightly lower number will need rehabilitative services
Secondly, tympanometry is not the ‘gold standard’ test and can result in false positives: a type B can result when there is no middle-ear condition.Reference Rosenfeld R, Shin, Schwartz, Coggins, Gagnon and Hackell13 The rate of false positives for diagnosis of otitis media with effusion ranges between 25 and 50 per cent.Reference Rosenfeld R, Shin, Schwartz, Coggins, Gagnon and Hackell13 Prior evidence on accuracy comes from paediatric populations. More diagnostic accuracy studies comparing the results obtained on otoscopy and tympanometry to ‘gold standard’ myringotomy among adults are required. We were unable to carry out a study such as this because of limited availability of human, technical and financial resources to perform myringotomy in The Gambia. In addition, it would be unethical to undertake the invasive and painful myringotomy procedure in the context of a population survey.
Thirdly, a type C tympanogram indicates negative middle-ear pressure, which can precede a middle-ear condition; however, there is limited evidence on the accuracy of type C in detecting middle-ear conditions.Reference Rosenfeld R, Shin, Schwartz, Coggins, Gagnon and Hackell13 Type C tympanograms could be further classified into C1 and C2, but given the limited evidence of diagnostic accuracy mentioned above we did not consider this.Reference Rosenfeld R, Shin, Schwartz, Coggins, Gagnon and Hackell13 We also did not wish to complicate grading for the audiology nurse. Another limitation is that a type B tympanogram and mild to moderate hearing loss does not exclude an underlying sensorineural hearing loss. These assumptions were made for pragmatic reasons, but they may result in an overestimation or underestimation of the proportion of hearing loss attributed to middle-ear conditions. Population-based surveys, by their nature, often require assumptions and simplifications, in contrast to clinical ‘gold standards’.
Another limitation is that this study involved one clinician, an audiology nurse. The nurse underwent 11 months of training in audiology in Zambia in 2015 and has completed audiological assessments including otoscopy routinely. There is one ENT doctor in The Gambia, and this doctor was unable to take part in the study. The nurse routinely performs these examinations in clinical practice and has five years of clinical experience. However, given only one clinician conducted the assessment, we are unable to explore inter-rater variability. We were also unable to assess the diagnostic accuracy of the audiology nurse because of the limited availability of ENT doctors in The Gambia. We previously explored the use of video otoscopy and remote grading and found a relatively high proportion of images ungradable. In addition, if images are only graded remotely there is the ethical consideration of participants not being aware of unmet hearing health needs or being referred to relevant services. Thus, this study should be repeated in other settings with different cadres of health workers. Finally, the age group of the study was over 35 years rather than over 50 years (typical Rapid Assessment of Hearing Loss age group). However, the analysis presented is unlikely to change for the two age groups.
Conclusion
The value of adding tympanometry to population-based survey protocols is a higher estimated increased detection of middle-ear disease, resulting in a higher estimated proportion of hearing loss being attributed to middle-ear disease rather than sensorineural causes. This has implications in terms of informing service needs: a higher number of people will be classified as in need of medical or surgical services and a slightly lower number in need of rehabilitative services. Given that the aim of Rapid Assessment of Hearing Loss is to inform service planning, it is highly recommended that tympanometry is included in the protocol despite the additional time and cost burden.
Acknowledgements
This study was funded by the Queen's Diamond Jubilee Trust (grant agreement unique reference number: TG002 3/12/2013 ‘The Commonwealth Eye Health Consortium’).
Competing interests
None declared
Appendix 1. Recoding causes of hearing loss based on the results of tympanometry in the left ear

Appendix 2. Recoding causes of hearing loss based on the results of tympanometry in the right ear
Appendix 3. Recoding ear disease diagnosis based on the results of tympanometry in the left ear

Appendix 4. Recoding ear disease diagnosis based on the results of tympanometry in the right ear


 Open access