


Anthropometry-based measurement of body composition offers the advantage of a simple and cheap estimation of an important parameter, which is associated with major health outcomes( Reference Simões, Severo and Oliveira 1 ). A valid approach can be effectively applied in field research, large cohort surveys, serial assessments and screening. This is in contrast to laboratory and imaging estimates of body composition that are usually costly and technically challenging( Reference Francis 2 – Reference Sheng, Adolph and Smith 4 ). Noteworthy, laboratory and imaging techniques are most valuable as ‘gold standards’ for validation of field measures and as the diagnostic modality for subjects with medical conditions or unusual complexity. Of these, dual-energy X-ray absorptiometry (DEXA) is universally accepted as the ‘gold standard’, due to its reliability and applicability( Reference Cornier, Després and Davis 5 ).
BMI is an example of a field measure that became widely used due to its simplicity. However, BMI correlates poorly with the body fat component estimation by DEXA( Reference Batsis, Mackenzie and Bartels 6 , Reference Pasco, Nicholson and Brennan 7 ), tends to overestimate obesity in people with relatively high lean body mass (LBM), and to underestimate it in people with lower LBM. Over the years, various attempts have been made to construct equations for estimating percentage body fat (%BF) based on skinfold thickness measurements( Reference Siri 8 – Reference Durnin and Womersley 10 ). In general, the skinfolds measurement method is advantageous for quantification of regional adiposity, which by itself is an independent predictor of morbidity at a given level of whole-body adiposity( Reference Kannel, Cupples and Ramaswami 11 ). However, %BF by skinfold measurements suffers a low reproducibility and high inter-observer agreement( Reference Mueller and Malina 12 ). In this regard, predictive equations that are based on body circumferences are a more reliable method for estimating total adiposity. Indeed, waist circumference:height ratio is now the most preferred anthropometric index, due to its ability to estimate both total adiposity and fat distribution by using very simple measurements( Reference Pietrobelli and Brambilla 13 ) and its correlation with major clinical outcomes( Reference Savva, Lamnisos and Kafatos 14 ).
A major limitation of the anthropometry-based measures to estimate %BF is the limited generalisability of the equations to sub-populations whose body composition is very different from the population average( Reference Going, Lee and Blew 15 ). Therefore, a great body of research in recent decades has been dedicated to validating and modifying the conventional %BF equations for children, people with chronic disease, non-European ethnic groups, elderly and athletes( Reference Hronek, Kovarik and Aimova 16 , Reference Kohli, Gao and Lear 17 ). Another limitation is disagreement on the exact way of measuring waist circumference( Reference Ma, Yang and Shih 18 , 19 ), despite being probably the most frequently taken anthropometric measure. In addition, an insufficient number of studies investigated the neck circumference, which nevertheless appears to be a good predictor of metabolic and cardiovascular morbidity( Reference Preis, Massaro and Hoffmann 20 , Reference Vallianou, Evangelopoulos and Bountziouka 21 ). In our study, we attempted to develop a new predictive equation that can be applied for the general population to estimate %BF. To validate our results, we have used DEXA measurements as a ‘gold standard’, allowing also for comparison of the results to other studies.
Methods
Study population
The study consisted of retrospectively reviewing the files of 700 men and women aged 20–60 years (men:women=57 %:43 %) who registered to a health club. The demographic and anthropometric characteristics of this cohort are presented in Table 1. Subjects with poorly stabilised chronic medical conditions who could not be accepted to the health club were excluded from the cohort. The data obtained anonymously from the files included the following: age, sex, weight, height, skinfolds thickness at four sites (suprailiac, biceps, triceps and subscapular), neck circumference and abdominal circumference at the umbilical level. All the subjects also had their body composition measured by DEXA (Lunar; General Electric). A single experienced physical fitness instructor (Y. L.) took all measurements in the morning hours. The institutional review board approved the use of the above secondary data without informed consent (study no. 4195-17).
Table 1 General characteristics of ‘development’ and ‘validation’ study populations (Mean values, standard deviations and ranges)
%BF, percentage body fat.
* Statistically significant between ‘development’ and ‘testing’ groups (P<0·05).
† Calculated, using the four-skinfold equation by Durnin–Womersley.
Age was recorded to the nearest year, weight (kg) was recorded on a digital scale (SECA model 400; Seca North America) while the subject was dressed in shorts (and bra for females), height was measured (in cm) by a wall mounted measuring tape (SECA model 206; Seca North America), and BMI was calculated accordingly. Skinfolds were measured using a digital caliper (Skyndex, LLC) according to the American College of Sports Medicine guidelines( Reference Ratamess 22 ) and %BFSF was calculated by the Durnin–Womersley formulas for men and women( Reference Durnin and Womersley 10 ). Neck and abdomen circumferences were measured (in cm) with a flexible tape at the levels of laryngeal prominence and umbilicus, respectively.
Development of the new equation
The files of two groups, consisting of 476 (68 %) and 224 (32 %) subjects had been reviewed. Each group consisted of all subjects who registered to the health club during two consecutive periods of time, without exclusion. The first group was used for the development of the predictive equation (‘development’ group) and the second group was the ‘validation’ groups. The general characteristics (age, weight, height, BMI) of the ‘development’ and ‘validation’ groups were compared using t tests. All descriptive data are presented as means, standard deviations and ranges (Table 1). The differences between the groups (age, weight, BMI and %BFSF) were statistically significant but not substantial from the clinical perspective, and did not interfere with validation of the equation.
The first step towards constructing the final regression model was finding the univariate linear correlation between each measurement (or an existing equation) and the ‘gold standard’ DEXA measurement. Each correlation was examined visually using the Scatter-gram graph for any linear and non-monotonic relationships. Residuals were analysed to test for accuracy of the prediction models. The Durbin–Watson statistics was used to test for the presence of autocorrelation along each measurement scale and the variance inflation factor was used to check multicollinearity. Next, from the measures that met the criterion of simple usage in a field condition, those having the highest correlation coefficients were chosen. For example, the seven-site skinfold equation by Jackson and Pollock yielded good results but did not meet the requirement of feasibility measuring under field condition. As this did not meet the researchers’ desire to present simple measurement and formulation for implementation, it was not included in further analysis. Sex was included, and two regressions were obtained. The model was adjusted for age group by adding it in the regression. To ensure that the findings were not accidental, the ‘development’ file was randomly split into two halves and tested by using the original formula. The gaps were minimal and the formulas were, therefore, processed for testing in the ‘validation’ set of data without any prior confirmatory analysis. Finally, as ‘age’ did not contribute significantly to the prediction of DEXA value it was omitted from the final equation.
Validation of the new equation
The equations that were developed have been validated in the ‘validation’ group (n 224). The predictive ability of the suggested equation was assessed as agreement with the ‘gold standard’ measurement of body fat by DEXA. The agreement between DEXA and %BFcal was presented separately for men and women, using Bland–Altman plots, by the mean difference between the two measurements, and by the critical difference (half 95 % CI of difference)( Reference Bland and Altman 23 ), and by Lin’s measures of agreement (concordance correlation coefficient, accuracy and precision)( Reference Lin, Hedayat and Sinha 24 ). The accuracy of the equation was also expressed by the percentage of cases whose prediction fell within ±5 % of the DEXA value.
Results
The final equations to predict %BF as measured by DEXA (%BFcal) included height in cm (H), abdominal circumference in cm (A) and neck circumference in cm (N), and were as follows:
 $$\eqalignno{ \,\%\,\,{\rm BF}_{{{\rm cal}}} \,\left( {{\rm men}} \right){\,\equals\,}& {\rm 1}0\!\cdot\!{\rm 111}\,\left( {\!\pm{\rm 6}\!\cdot\!{\rm 541}} \right)-0\!\cdot\!{\rm 239}\,\left( {\!\pm0\!\cdot\!0{\rm 35}} \right)H \cr & \!{\plus}0\!\cdot\!{\rm 8}0{\rm 8}\,\left( {\!\pm0\!\cdot\!0{\rm 29}} \right)A{\rm }-0\!\cdot\!{\rm 518}\,\left( {\!\pm0\!\cdot\!{\rm 128}} \right)N{\rm} $$
 $$\eqalignno{ \%\,\,{\rm BF}_{{{\rm cal}}} \,\left( {{\rm women}} \right){\,\equals\,}& {\rm 19}\!\cdot\!{\rm 197}\,\left( {\!\pm{\rm 7}\!\cdot\!{\rm 439}} \right)-0\!\cdot\!{\rm 239}\,\left( {\!\pm0\!\cdot\!0{\rm 35}} \right)H \cr & \!{\plus}0\!\cdot\!{\rm 8}0{\rm 8}\,\left( {\!\pm0\!\cdot\!0{\rm 29}} \right)A{\rm }-0\!\cdot\!{\rm 518}\,\left( {\!\pm0\!\cdot\!{\rm 128}} \right)N{\rm .} $$
Adjusted R 2 of the models for women and men were 0·65 and 0·78, respectively. The final model, which served as the basis for the above equations had an R 2 of 0·78 and a standard error of the estimate of 4·63 (Table 2).
Table 2 Final equations variables in the ‘validation’ set (β-Coefficients with their standard errors; adjusted R 2 and standard error of the estimates (SEE))
We incorporated the anthropometric measures of the 224 subjects from the ‘validation’ set into the new equations and evaluated the agreement of the calculated values with the corresponding DEXA values. Bland–Altman plots comparing DEXA to %BFcal in men and women are presented in Fig. 1(a) and (b), respectively. The central line demonstrates that there was no significant deviation from 0 (P<0·05), indicating no fixed bias. Limits of agreement that contained 95 % of the %BFcal estimates were ±7·83 % for men and ±8·42 % for women. The Lin concordance coefficient of %BFcal and DEXA was 0·89 in men and 0·86 in women. The accuracy of %BF was 1·0 in both men and women, and precision was 0·9 and 0·88, respectively (Table 3). Accuracy of %BFcal was also presented as percentage of predictions falling within 5 % of the corresponding DEXA value. The suggested equation predicted accurately %BF in 79·5 % of subjects. The remaining 20·5 % were symmetrically distributed: 9·3 % underestimations and 11·2 % overestimations (Table 3, Fig. 2). Overall, the equations appear to be externally valid for a large spectrum of measures (ages: 20–58 years, BMI: 14·4–43·2 kg/m2, Table 1).
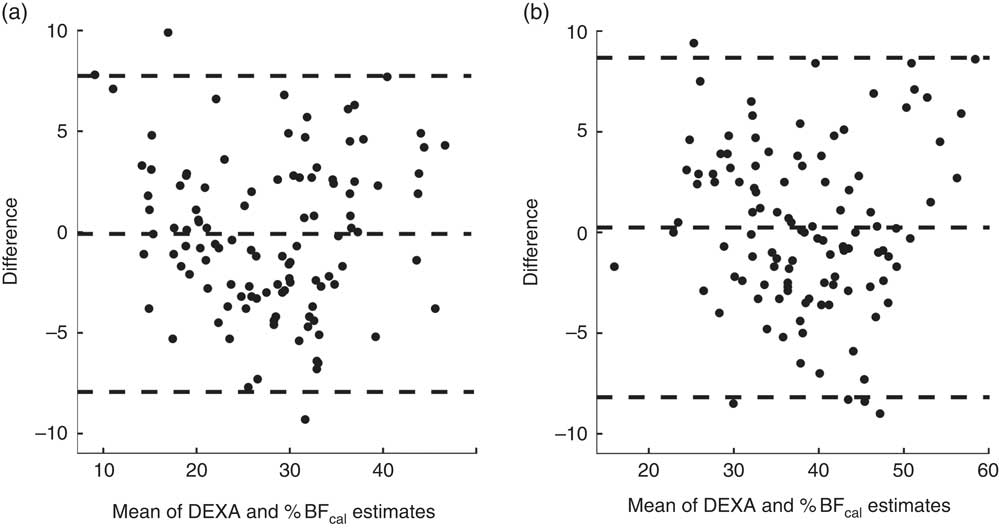
Fig. 1 Bland–Altman plots of agreement between the new anthropometric equation and the ‘gold standard’ body fat percentage (%BF) estimate by dual-energy X-ray absorptiometry (DEXA) in males (a) and females (b).
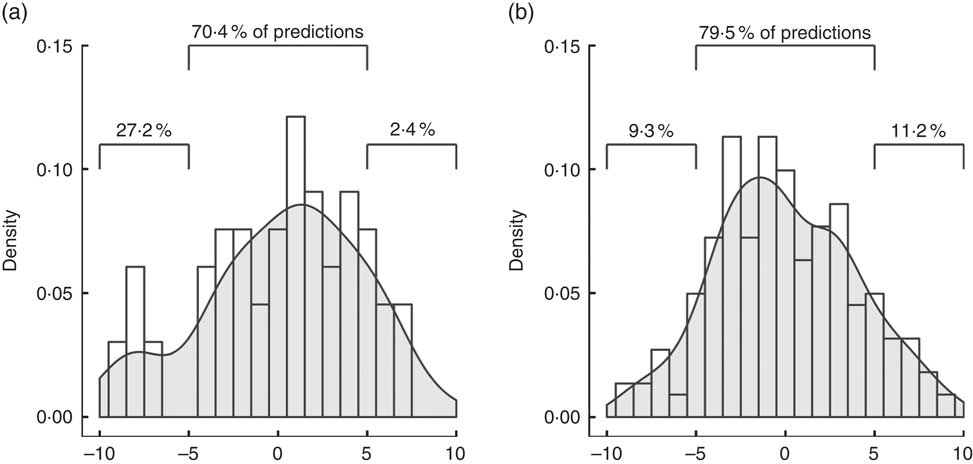
Fig. 2 Accuracy of prediction of percentage body fat (%BF) by skinfolds equation (a) and the circumferences equation (b), represented as percentage of predictions falling within 5 % of the dual-energy X-ray absorptiometry value.
Table 3 Comparison of predictive ability of four skinfold formula (%BFSF) and the new formula (%BFcal)
%BF, percentage body fat; DEXA, dual-energy X-ray absorptiometry.
Discussion
The present study was undertaken to develop a simple but accurate predictive model to assess %BF. Our final equation that consisted of height, waist circumference and neck circumference was proved to be valid, and can be applied for calculation of %BF in the general population of men and women, ages 20–60 years. This predictive equation is extremely useful for field applications due to the simplicity of measurements that it is based on.
Measuring body fat has multiple applications in various health and disease states. Although the direct measurement is impractical and indirect estimates usually employ sophisticated techniques, a great body of research addresses the double-indirect estimates of body adiposity – equations that translate simple anthropometric measurements into %BF. However, most of these measures, including BMI and waist:hip ratio (WHR), though widely used, correlate poorly with %BF and clinical outcomes( Reference Navaneethan, Kirwan and Arrigain 25 ). We have observed similar discordance between BMI, WHR and DEXA also in our study (data not presented).
Equations for the assessment of body fat based on skinfold thickness measurements were developed in the 1950s( Reference Siri 8 – Reference Durnin and Womersley 10 ). They have become a widely used tool as then, despite their relative complexity and questionable repeatability of the measurement technique. Noteworthy, previous studies indicate that measurement of body circumference is less prone to bias than skinfold caliper measurements( Reference Kannel, Cupples and Ramaswami 11 , Reference Himes, Roche and Siervogel 26 ). In addition, recent research has shown the association of neck circumference with indirect measures of adiposity( Reference Yang, Samarasinghe and Kane 27 ) and with major clinical outcomes( Reference Preis, Massaro and Hoffmann 20 , Reference Vallianou, Evangelopoulos and Bountziouka 21 , Reference Luo, Ma and Shen 28 , Reference Huang, Zhu and Wu 29 ). Thus, a great advantage of the newly developed model is the simplicity of measurements. While the models to assess %BF by skinfold thickness provide a better estimate than BMI and WHR the method is challenging as it requires double or triple measurements at each anatomic location taken by a trained and experienced individual. Furthermore, the various models require complex calculations, and reliability among diverse ethnic groups is low( Reference Kohli, Gao and Lear 17 , Reference Davidson, Wang and Thornton 30 ). To note, the skinfold equations were shown to become better predictors of %BF after addition of waist and hip circumferences( Reference Kohli, Gao and Lear 17 ).
Accuracy and precision of the new equation are within the range expected from anthropometric measures, according to values reported by other studies( Reference Peterson, Thomas and Blackburn 31 ). The Durnin–Womersley equation is a popular estimate of %BF based on four skinfold measurements. We have used this estimate (%BFSF) in the validation data set to calculate parameters of agreement with DEXA and compare them with those of the %BFcal equation. Bland–Altman plots demonstrated fixed bias, or underestimation of %BFSF (by −2·48 and −3·01 % in men and women, respectively). This led to asymmetry in prediction of %BF, with about 27·2 % of the subjects having underestimated %BF determined by skinfolds, as opposed to only 9·3 % by %BFcal (Fig. 2). In clinical use, one would opt for overestimation over underestimation of %BF, as the latter implies ‘missing’ patients that could benefit from lifestyle interventions. It follows that in order to accurately predict %BF by the four-skinfolds method, adjustment is required (a correction factor of 1·1 for men and 1·03 for women was calculated for the present set of data). Currently, adding an adjusting coefficient is not the common practice that may add complexity to the already complicated method. Lin’s concordance coefficient, accuracy and precision of %BFcal were higher than for %BFSF. Although 79·5 % of the new predictive model were within ±5 % from the values obtained by DEXA, only 70·4 % of %BFSF were within ±5 % of the ‘gold standard’ (Fig. 2). Even after the above-mentioned adjustments %BFSF was less precise than %BFcal in estimating correctly %BF and only 72 % of the results of men and 76 % of the results in women were within ±5 % of the DEXA values.
There are some limitations to the study, to which the potential user of the proposed equations should be aware. In the study, we used DEXA as a ‘gold standard’. Despite being accepted as the method of choice, it remains an indirect measure of body composition and its results are influenced by technique of testing and by the subjects’ physiological status (e.g. level of hydration). In part this was overcome by taking all measurements in the morning hours. Although we have tried to include a large heterogeneous cohort in our study, the equations were developed using a database of a group of healthy Israeli adults of relatively high socio-economic background, which is implied by their ability to afford visiting a health club. Nevertheless, the validity of the equations appears to be externally valid for a large spectrum of measures (ages: 20–58 years, BMI: 14·4–43·2 kg/m2, Table 1). Yet, the equations presented here require further validation of the formula in sub-populations, such as soldiers, elderly, children and bedridden patients, in whom the use of field measures of adiposity is of importance. The latter may be the greatest beneficiaries from the formula, as it does not require weighing the person to predict %BF.
To summarise, in the community, athletic trainers and nutritionists can effectively use the suggested model due to its simplicity and applicability. The three variables that are used make the model advantageous over all other models, with no need for an expensive device or particular experience.
Acknowledgements
This research received no specific grant from any funding agency, commercial or not-for profit sectors.
All authors contributed to study design, conduct, data collection and analysis, writing and critical review of the final manuscript.
The authors declare that there are no conflicts of interest.


