


Impact Statement
Studying how climate has changed in the past allows placing the current trends into their geological context. Extracting this information from the geological records require the use of diverse data, each with their own idiosyncrasies. Therefore, compiling these records require both expertise and time to annotate. To facilitate this task, a recommender system, PaleoRec, was deployed on the main annotation interface for these data.
1. Introduction
Studying how climate has changed in the past—from the past few centuries to the Ice Ages and beyond—is fundamental for placing the current climate change into broader context. Paleoclimate data can supplement our relatively short instrumental records, providing a unique window into low-frequency climate variations (decadal to multimillennial scale) and into the climate response to various forcings. They also provide a crucial test bed for climate models (Tierney et al., Reference Tierney, Poulsen, Montañez, Bhattacharya, Feng, Ford, Hönisch, Inglis, Petersen, Sagoo, Tabor, Thirumalai, Zhu, Burls, Foster, Goddéris, Huber, Ivany, Kirtland Turner, Lunt, McElwain, Mills, Otto-Bliesner, Ridgwell and Zhang2020).
To reconstruct past climates, researchers use biological, physical, and chemical recorders of past environmental changes such as the rings of trees and changes in the chemical composition of corals and ice, which encode information about climate variations at various locations across the globe. Several mathematical methods have been developed to extract past environmental information from a network of these archives, referred to as “proxies.” The resulting reconstructions (e.g., Mann et al., Reference McKay, Emile-Geay and Khider1998, Reference Morrill, Thrasher, Lockshin, Gille, McNeill, Shepherd, Gross and Bauer2008; Tardif et al., Reference Tardif, Hakim, Perkins, Horlick, Erb, Emile-Geay, Anderson, Steig and Noone2019; Neukom et al., Reference Neukom, Barboza, Erb, Shi, Emile-Geay, Evans, Franke, Kaufman, Lücke, Rehfeld, Schurer, Zhu, Brönnimann, Hakim, Henley, Ljungqvist, McKay, Valler and von Gunten2019a; Neukom et al., Reference Tardif, Hakim, Perkins, Horlick, Erb, Emile-Geay, Anderson, Steig and Noone2019b) are some of the most visible and reused products of paleoclimatology.
Currently, such syntheses are hindered by the time and labor required to access, clean, and wrangle the data into a usable format. This task has been estimated to consume up to 80% of a research time (Dasu and Johnson, Reference Dasu and Johnson2003) and is often performed by early-career scientists. Not only does these data wrangling task involve identifying missing values or outliers in the data, which could be performed automatically, it also entails searching for records across multiple databases, contacting the original authors for the missing data and metadata, and organizing them into a machine-readable format. Often, this requires a deep understanding of each dataset’s intricacies and unwritten rules and practices in the field and cannot, therefore, be fully automated or outsourced to unskilled labor. However, standardizing paleoclimate data is necessary to accelerate scientific progress (McKay and Emile-Geay, Reference Neukom, Steiger, Gómez-Navarro, Wang and Werner2016; Khider et al., Reference Khider, Zhu, Emile-Geay, Hu, James, Kwan, Athreya and Garijo2019; Morrill et al., Reference Paszke, Gross, Massa, Lerer, Bradbury, Chanan, Killeen, Lin, Gimelshein, Antiga, Desmaison, Kopf, Yang, DeVito, Raison, Tejani, Chilamkurthy, Steiner, Fang, Bai, Chintala, Wallach, Larochelle, Beygelzimer, d Alché-Buc, Fox and Garnett2021) and ensure that these data will remain Findable, Accessible, Interoperable, and Reusable (FAIR; Wilkinson et al. (Reference Wilkinson, Dumontier, Aalbersberg, Appleton, Axton, Baak, Blomberg, Boiten, da Silva Santos, Bourne, Bouwman, Brookes, Clark, Crosas, Dillo, Dumon, Edmunds, Evelo, Finkers, Gonzalez-Beltran, Gray, Groth, Goble, Grethe, Heringa, t Hoen, Hooft, Kuhn, Kok, Kok, Lusher, Martone, Mons, Packer, Persson, Rocca-Serra, Roos, van Schaik, Sansone, Schultes, Sengstag, Slater, Strawn, Swertz, Thompson, van der Lei, van Mulligen, Velterop, Waagmeester, Wittenburg, Wolstencroft, Zhao and Mons2016)). Indeed, standardization is key to many scientific endeavors: querying databases, analyzing and visualizing data, lowering the barrier for participation for people outside the narrow field of expertise, and ensuring that the original authors of the study receive proper credits.
Standardization requires three elements (Khider et al., Reference Khider, Zhu, Emile-Geay, Hu, James, Kwan, Athreya and Garijo2019): (a) a standard format for the data, (b) a standard terminology for the data, and (c) standard guidelines for reporting the data. In other words, a standard should specify the objects necessary to label and structure the data (e.g., “title,” “author,” which can fall under a broader “publication” category), agreed upon labels to describe the data (e.g., the use of “degree Celsius” vs. “degC” to report temperature), and guidelines on which object/label pair should be included in the metadata (e.g., location information is of utmost importance in many environmental applications). Every user should follow the same guidelines to report their data; otherwise the classification falls apart and the data may as well be stored randomly on a server. Recommender systems (e.g., Lu et al., Reference Lu, Wu, Mao, Wang and Zhang2015; Fang et al., Reference Fang, Zhang, Shu and Guo2020) can assist users in the annotation of their datasets while ensuring that a standard is being followed, particularly, standard terminology and reporting guidelines. Because of the amount of expertise needed to annotate datasets, the recommender system proposed here is envisioned as an assistant to the expert rather than a substitute. The goal here is to streamline choices offered to an expert in a drop-down menu by providing the most relevant metadata annotation for each field, with the goals of saving experts’ time and promoting re-use and adoption of common terms.
This paper reports on the development of such a recommender system, PaleoRec, which leverages emerging standards (McKay and Emile-Geay, Reference Neukom, Steiger, Gómez-Navarro, Wang and Werner2016; Khider et al., Reference Khider, Zhu, Emile-Geay, Hu, James, Kwan, Athreya and Garijo2019) for standardizing paleoclimate datasets. The remaining sections are organized as follows: Section 2 summarizes the relevant standardization efforts upon which PaleoRec is built and provides an overview of recommender systems. Section 3 describes PaleoRec, its deployment on a web interface used by researchers for annotation, and its current limitations. Finally, Section 4 concludes with a discussion on how recommender systems, such as PaleoRec, can help with making data FAIR.
2. Background
The discussion below is nonexhaustive and only focuses on the relevant efforts that have sparked the creation of PaleoRec.
2.1. Efforts towards a data standard for paleoclimate datasets
2.1.1. LiPD: a standard format for paleoclimate data
Until recently, there was no nonproprietary, universal container to describe, store, and share paleoclimate datasets. Emile-Geay and Eshleman (Reference Evans, Tolwinski-Ward, Thompson and Anchukaitis2013) first introduced the concept of a flexible container for paleoclimate data, where metadata could be stored semantically while the data would be stored in tabular format. This concept was the basis for the Linked PaleoData (LiPD; McKay and Emile-Geay (Reference Neukom, Steiger, Gómez-Navarro, Wang and Werner2016)) format.
LiPD is a universally-readable data container that stores metadata in a JSON-LD file (JavaScript Object Notation for Linked Data) and the data in tables saved in CSV format. Data in the LiPD format are currently stored as the NOAA’s World Data Service for Paleoclimatology (https://www.ncei.noaa.gov/products/paleoclimatology), one of the world’s primary repository for paleoclimate data, as well as other open repositories (mainly the LiPDverse [https://lipdverse.org] and the LinkedEarth platforms [https://wiki.linked.earth/Main_Page]). More than a file format, LiPD is first and foremost a flexible data model that organizes paleoclimate data into six distinct components: root metadata (e.g., dataset name, investigators, and version); location metadata; publication metadata; funding metadata; PaleoData metadata, which includes information about the how the measurements were made and interpreted into environmental variables; and ChronData, which mirrors the PaleoData component with information pertaining to how the ages of the samples were assigned. These components were designed to provide a robust backbone upon which analysis and visualization code (e.g., Khider et al., Reference Konecky, McKay, Churakova (Sidorova), Comas-Bru, Dassié, DeLong, Falster, Fischer, Jones, Jonkers, Kaufman, Leduc, Managave, Martrat, Opel, Orsi, Partin, Sayani, Thomas, Thompson, Tyler, Abram, Atwood, Cartapanis, Conroy, Curran, Dee, Deininger, Divine, Kern, Porter, Stevenson, von Gunten and Members2021; McKay et al., 2021) can be written while retaining enough flexibility to allow users to provide metadata as rich as they wish to provide.
2.1.2. The LinkedEarth Ontology: toward defining a common terminology for paleoclimate data
LiPD gave rise to the LinkedEarth Ontology (Garijo et al., Reference Hidasi, Karatzoglou, Baltrunas and Tikk2019), which formalized the relationship among the various objects used to describe the datasets. At the heart of the LinkedEarth Ontology and the field of paleoclimatology lies the concept of a climate proxy system. Evans et al. (Reference Fang, Zhang, Shu and Guo2013) define a proxy system as consisting of three components: the proxy archive, the proxy sensor, and the proxy observation. The LinkedEarth Ontology represents these concepts as objects and specifies relationships between these objects. In practice, paleoclimatologists make measurements (the ProxyObservations, labeled proxyObservationType in LiPD) on a physical sample (the ProxyArchive, labeled archiveType in LiPD), in which the information about past environmental conditions (the InferredVariable, labeled inferredVariableType in LiPD) is encoded by the ProxySensor. These relationships have a profound implication for the design of a recommender system since the metadata are strongly linked to each other (i.e., if the ProxySensor is marine, then it will most likely encode information about the ocean). Therefore, the recommender system needs to be designed around a sequence of questions a researcher would answer to describe their dataset, in accordance to these relationships.
2.1.3. PaCTS: a crowdsourced reporting standard for paleoclimate data
The Paleoclimate Community reporTing Standard (PACTSv1.0; Khider et al., Reference Khider, Emile-Geay, McKay, Gil, Garijo, Ratnakar, Alonso-Garcia, Bertrand, Bothe, Brewer, Bunn, Chevalier, Comas-Bru, Csank, Dassié, DeLong, Felis, Francus, Frappier, Gray, Goring, Jonkers, Kahle, Kaufman, Kehrwald, Martrat, McGregor, Richey, Schmittner, Scroxton, Sutherland, Thirumalai, Allen, Arnaud, Axford, Barrows, Bazin, Pilaar Birch, Bradley, Bregy, Capron, Cartapanis, Chiang, Cobb, Debret, Dommain, Du, Dyez, Emerick, Erb, Falster, Finsinger, Fortier, Gauthier, George, Grimm, Hertzberg, Hibbert, Hillman, Hobbs, Huber, Hughes, Jaccard, Ruan, Kienast, Konecky, Le Roux, Lyubchich, Novello, Olaka, Partin, Pearce, Phipps, Pignol, Piotrowska, Poli, Prokopenko, Schwanck, Stepanek, Swann, Telford, Thomas, Thomas, Truebe, Gunten, Waite, Weitzel, Wilhelm, Williams, Williams, Winstrup, Zhao and Zhou2019) represents the first crowdsourced effort to capture which information should be reported when annotating paleoclimate data with the goal of maximizing the reuse of these datasets. The process ultimately involved over 135 scientists who overwhelmingly supported a drastic increase in the amount of metadata accompanying paleoclimate datasets. However, these scientists also recognized the time commitment required for annotating these datasets. They proposed two main ways to encourage the adoption of PaCTS: the first is to use technical innovation to lower the barrier to metadata archiving and the second is to change the incentive structure. PaleoRec aims to address the first point using technology to help with annotation on the web interface used to create LiPD files: the LiPD playground (https://lipd.net/playground). The LiPD playground walks a user with metadata annotation through the six objects that can constitute a LiPD file (Section 2.1.1) and validate the entries for specific metadata fields.
2.2. Types and uses of recommender systems
Recommender systems are a proven method to filter information provided to a user based on their preferences extracted from their own ratings and from users with similar profiles. Most recommender systems are based either on collaborative filtering, in which items are recommended based on the similarity of a user to other users, or on content-based approaches, which recommend items based on a user’s history. These approaches mainly depend on the user’s static long-term preferences and interactions with the items. However, in real-world applications, the next-item recommendation also depends on short-term interactions and sequential dependencies in the items recommended to the users. For instance, in a e-commerce setting, it makes sense to recommend a pair of socks when a user has shown interest in buying shoes. Modeling the sequential dependencies is extremely important for paleoclimate metadata annotation since the recommendation for the next piece of metadata strongly depends on the prior selection.
Sequential recommendation systems (SRSs, related to session-based recommendation) aim to not only capture users’ long-term preferences, but also their short-term choices within a session. In fact, for our annotation problem, the short-term interest is more important than the user’s long-term preference in an item since the researcher representing the data in the LiPD format may not be the original creator of the dataset and the researcher may create these files as part of a compilation work, away from their main area of subspecialty within the field of paleoclimatology. For instance, a researcher working on marine archives may need to compare their record with one obtained from a terrestrial archive (e.g., a tree). In this case, their long-term preference in the marine realm does not provide any useful information about their short-term interest in paleoenvironmental information derived from trees. Consequently, PaleoRec uses the sequential recommendation approach.
Fang et al. (Reference Garijo, Khider, Emile-Geay and McKay2020) formally defines three types of SRSs based on the input behavior sequence. They define a behavior object as the item or services the user is interacting with (e.g., movies, shoes, and books for an e-commerce website) and a behavior type as the type of interaction the user is having with the items (e.g., click, add-to-cart, buy, and share). A behavior is thus a 2-tuple of the behavior object and behavior type. Given a user, U and the new item to recommend V, a behavior sequence is a time-ordered list of behaviors formed by the 2-tuples (see figure 3 in Fang et al., Reference Garijo, Khider, Emile-Geay and McKay2020). An SRS thus receives as input a set of user behavior sequences and the recommendation system algorithm needs to predict the next behavior object and/or behavior type. Users in the system do not need to be identified; they can remain anonymous, a feature we will take advantage of in the development of PaleoRec. A discussion about whether user profiles improve upon the quality of the recommendation is provided in Section 3.5. Fang et al. (Reference Garijo, Khider, Emile-Geay and McKay2020) further divided SRSs and their associated behavior sequences into three categories: (a) experience-based behavior sequence, in which a user will interact with the same item (e.g., item Vi) multiple times using different behavior types (e.g., click, buy, and share; see figure 4 in Fang et al., Reference Garijo, Khider, Emile-Geay and McKay2020); (b) transaction-based behavior sequence, in which a user will interact with different items with the same behavior type (e.g., click; see figure 5 in Fang et al., Reference Garijo, Khider, Emile-Geay and McKay2020); and (c) interaction-based behavior sequence, a combination of the two previous types in which a user will interact with different items using different behavior types (see figure 6 in Fang et al., Reference Garijo, Khider, Emile-Geay and McKay2020).
In our annotation problem, the behavior sequences that we wish to model are provided by the LinkedEarth Ontology and adapted for the LiPD standard nomenclature and practices. Ideally, when entering metadata on the LiPD playground, a researcher would first select the ProxyArchive, then enter the ProxyObservation made on that archive and associated units, and finally enter the general climatic interpretation. If possible, a quantitatively based InferredVariable and its units is then provided. At first glance, the interpretation fields seem redundant with the InferredVariable. However, they allow scientists to provide a scientific basis to explain how the measurement can be interpreted in an environmental context, even on a qualitative basis. In some instances, it is difficult, if not impossible, to derive quantitative values from these measurements, and therefore, interpretation remains a qualitative statement about past environmental changes. In other cases, the interpretation and InferredVariable fields will be nearly identical. For instance, the measurements of Mg/Ca on foraminiferal shells found in marine sediments encode information about temperature in the ocean. In this case, the interpretationVariable is temperature. The interpretationVariableDetail allows to give further information about the temperature. Since each species of foraminifera has a preferential depth habitat within the ocean, one can infer that when measurements are made on a species that prefers to live near the surface of the ocean, the interpretationVariableDetail field can be set to sea surface. When quantitative information can be derived, an InferredVariable is then created. In our example, the inferredVariableType is then sea surface temperature. Allowing for a separate interpretation field is also useful when considering that one measurement can have several interpretations if several environmental factors contribute to the encoding of the information into the ProxyArchive. Combining measurements with similar environmental influences may assist in disentangling the signals, resulting in several InferredVariables dependent on several ProxyObservations. For instance, the $ {\delta}^{18}O $
of foraminifera shells records both temperature and the isotopic composition of the seawater in which the shells form. Therefore, the interpretationVariable is temperature and
$ {\delta}^{18}O $
of foraminifera shells records both temperature and the isotopic composition of the seawater in which the shells form. Therefore, the interpretationVariable is temperature and $ {\delta}^{\mathtt{18}}{\mathtt{O}}_{\mathtt{sw}} $
. Combining measurements of Mg/Ca and
$ {\delta}^{\mathtt{18}}{\mathtt{O}}_{\mathtt{sw}} $
. Combining measurements of Mg/Ca and $ {\delta}^{18}O $
, therefore, allows for the joint calculation of inferredVariableType temperature and
$ {\delta}^{18}O $
, therefore, allows for the joint calculation of inferredVariableType temperature and $ {\delta}^{\mathtt{18}}{\mathtt{O}}_{\mathtt{sw}} $
. In this particular case, inferredVariableType
$ {\delta}^{\mathtt{18}}{\mathtt{O}}_{\mathtt{sw}} $
. In this particular case, inferredVariableType $ {\delta}^{\mathtt{18}}{\mathtt{O}}_{\mathtt{sw}} $
is inferred from both proxyObservationType Mg/Ca and
$ {\delta}^{\mathtt{18}}{\mathtt{O}}_{\mathtt{sw}} $
is inferred from both proxyObservationType Mg/Ca and $ {\delta}^{\mathtt{18}}\mathtt{O} $
.
$ {\delta}^{\mathtt{18}}\mathtt{O} $
.
The annotation steps can be encoded into two behavior sequences as shown in Figure 1. The first sequence describes the items designated as archiveType, proxyOberservationType, and proxyObservationUnits while the second sequence describes the items designated as archiveType, proxyOberservationType, interpretationVariable, interpretationVariableDetail, inferredVariableType, and inferredVariableUnits. The first chain represents how the information was obtained from the archive (i.e., which measurements were made on the physical sample) while the second chain concerns itself with the environmental interpretation (the PaleoData in LiPD). We created two sequences since the units do not add valuable information for the prediction of the interpretation and subsequent InferredVariable. For every object (i.e., metadata field), the expected behavior type is the same (i.e., select). Therefore, PaleoRec is an example of a transaction-based SRS with anonymous users. The goal of the recommender is thus to predict the value for the next metadata field given the prior sequence.

Figure 1. Behavior sequences for PaleoRec. PaleoRec is an example of a transaction-based recommender system in which we model the same type of user behavior (select) for different items along a chain defined by the LinkedEarth Ontology.
3. Methods
3.1. PaleoRec
Traditional methods for sequential recommendation include frequent pattern mining, $ k $
-nearest neighbors, Markov chains, matrix factorization, and reinforcement learning (Quadrana et al., Reference Quadrana, Cremonesi and Jannach2018). Recently, deep learning-based methods, especially recurrent neural networks (RNNs) and convolutional neural networks (CNNs), have become more prevalent in the literature (see Fang et al., Reference Fang, Zhang, Shu and Guo2020 for a comprehensive review). RNN-based methods have demonstrated their usefulness in the field of natural language processing since they take into account previous context and the long-term information contained in the inputs, such as the beginning of a sentence to predict the next word. RNNs are designed to take as inputs the previous hidden state and a one-time value to generate an output value and a new hidden state which are then fed into the next RNN cell. This loop-like structure is critical for tasks where the memory of previous inputs are important, such as time-series prediction and text generation. One can consider our current task to be much like a text prediction problem, in which the sentence is given by the sequence of metadata, making RNNs particularly attractive for the development of PaleoRec.
$ k $
-nearest neighbors, Markov chains, matrix factorization, and reinforcement learning (Quadrana et al., Reference Quadrana, Cremonesi and Jannach2018). Recently, deep learning-based methods, especially recurrent neural networks (RNNs) and convolutional neural networks (CNNs), have become more prevalent in the literature (see Fang et al., Reference Fang, Zhang, Shu and Guo2020 for a comprehensive review). RNN-based methods have demonstrated their usefulness in the field of natural language processing since they take into account previous context and the long-term information contained in the inputs, such as the beginning of a sentence to predict the next word. RNNs are designed to take as inputs the previous hidden state and a one-time value to generate an output value and a new hidden state which are then fed into the next RNN cell. This loop-like structure is critical for tasks where the memory of previous inputs are important, such as time-series prediction and text generation. One can consider our current task to be much like a text prediction problem, in which the sentence is given by the sequence of metadata, making RNNs particularly attractive for the development of PaleoRec.
A popular RNN model often used for SRSs are gated recurrent units (GRU; e.g., GRU4Rec; Hidasi et al., Reference Jonkers, Cartapanis, Langner, McKay, Mulitza, Strack and Kucera2016), with various levels of user representations information (e.g., Donkers et al., Reference Donkers, Loepp and Ziegler2017; Quadrana et al., Reference Quadrana, Karatzoglou, Hidasi and Cremonesi2017; Lv et al., Reference Lv, Jin, Yu, Sun, Lin, Yang and Ng2019; You et al., Reference You, Wang, Pal, Eksombatchai, Rosenberg and Leskovec2019). For PaleoRec, we adapted the GRU4Rec architecture with use of a long-short term memory (LSTM) layer, another popular type of RNN (Figure 2). LSTM models are composed of a cell, which remembers values over a time interval (in this case, a sequence of words) and an input gate, output gate and a forget gate, whose roles are to regulate the flow of information in and out of the cell. One of the common problems with RNNs is that during training, the long-term gradients that are back-propagated can vanish (i.e., they tend to zero) or explode (take on an infinite value) since the calculation involved in the process use finite-precision numbers. LSTMs are meant to partially solve the vanishing gradient problem by allowing gradients to flow unchanged. A comparison of the performance given by GRU versus LSTM layers in PaleoRec is given in Section 3.3. One possible drawback with using an LSTM layer over a GRU is scalability. However, the domain vocabulary is fairly constrained (225 words as of June 2021) and the chain length small. Therefore, we do not anticipate scalability issues in the long term.

Figure 2. Architecture of PaleoRec.
The architecture consists of an embedding layer to generate the vector representation, the LSTM layer, and a dense layer (also called the fully connected layer, which allows to connect all the neurons in the preceding layer and is, therefore, used for the prediction). The input to the model consists of a sequence of words as shown in Figure 1. The output consists of $ k $
-ranked predictions for the next item in the sequence. PaleoRec was developed using PyTorch (Paszke et al., Reference Wilkinson, Dumontier, Aalbersberg, Appleton, Axton, Baak, Blomberg, Boiten, da Silva Santos, Bourne, Bouwman, Brookes, Clark, Crosas, Dillo, Dumon, Edmunds, Evelo, Finkers, Gonzalez-Beltran, Gray, Groth, Goble, Grethe, Heringa, t Hoen, Hooft, Kuhn, Kok, Kok, Lusher, Martone, Mons, Packer, Persson, Rocca-Serra, Roos, van Schaik, Sansone, Schultes, Sengstag, Slater, Strawn, Swertz, Thompson, van der Lei, van Mulligen, Velterop, Waagmeester, Wittenburg, Wolstencroft, Zhao and Mons2019). The model was trained for 100 epochs for the chain describing how the measurements are made (Chain 1 in Figure 1) and 150 epochs for the longer chain representing the environmental information (Chain 2 in Figure 1). We used cross-entropy loss as the loss function since our problem requires the prediction of multiple classes and our training set is imbalanced (Section 3.2).
$ k $
-ranked predictions for the next item in the sequence. PaleoRec was developed using PyTorch (Paszke et al., Reference Wilkinson, Dumontier, Aalbersberg, Appleton, Axton, Baak, Blomberg, Boiten, da Silva Santos, Bourne, Bouwman, Brookes, Clark, Crosas, Dillo, Dumon, Edmunds, Evelo, Finkers, Gonzalez-Beltran, Gray, Groth, Goble, Grethe, Heringa, t Hoen, Hooft, Kuhn, Kok, Kok, Lusher, Martone, Mons, Packer, Persson, Rocca-Serra, Roos, van Schaik, Sansone, Schultes, Sengstag, Slater, Strawn, Swertz, Thompson, van der Lei, van Mulligen, Velterop, Waagmeester, Wittenburg, Wolstencroft, Zhao and Mons2019). The model was trained for 100 epochs for the chain describing how the measurements are made (Chain 1 in Figure 1) and 150 epochs for the longer chain representing the environmental information (Chain 2 in Figure 1). We used cross-entropy loss as the loss function since our problem requires the prediction of multiple classes and our training set is imbalanced (Section 3.2).
3.2. Data
Training data for PaleoRec was obtained from four major compilations efforts from the paleoclimate community: PAGES2k (PAGES2k Consortium, Reference Tierney, Poulsen, Montañez, Bhattacharya, Feng, Ford, Hönisch, Inglis, Petersen, Sagoo, Tabor, Thirumalai, Zhu, Burls, Foster, Goddéris, Huber, Ivany, Kirtland Turner, Lunt, McElwain, Mills, Otto-Bliesner, Ridgwell and Zhang2017), which aimed at reconstructing global average temperatures over the past 2,000 years (647 datasets), TEMP12k (Kaufman et al., Reference Khider, Emile-Geay, McKay, Gil, Garijo, Ratnakar, Alonso-Garcia, Bertrand, Bothe, Brewer, Bunn, Chevalier, Comas-Bru, Csank, Dassié, DeLong, Felis, Francus, Frappier, Gray, Goring, Jonkers, Kahle, Kaufman, Kehrwald, Martrat, McGregor, Richey, Schmittner, Scroxton, Sutherland, Thirumalai, Allen, Arnaud, Axford, Barrows, Bazin, Pilaar Birch, Bradley, Bregy, Capron, Cartapanis, Chiang, Cobb, Debret, Dommain, Du, Dyez, Emerick, Erb, Falster, Finsinger, Fortier, Gauthier, George, Grimm, Hertzberg, Hibbert, Hillman, Hobbs, Huber, Hughes, Jaccard, Ruan, Kienast, Konecky, Le Roux, Lyubchich, Novello, Olaka, Partin, Pearce, Phipps, Pignol, Piotrowska, Poli, Prokopenko, Schwanck, Stepanek, Swann, Telford, Thomas, Thomas, Truebe, Gunten, Waite, Weitzel, Wilhelm, Williams, Williams, Winstrup, Zhao and Zhou2020), which aimed at reconstructing global average temperatures over the past 12,000 years (699 datasets), ISO2k (Konecky et al., Reference Mann, Bradley and Hughes2020), which aimed at reconstructing water isotopes over the past 2,000 years (oxygen and hydrogen, themselves indicators of changes in the hydrologic cycle; 506 datasets), and PALMOD (Jonkers et al., Reference Kaufman, McKay, Routson, Erb, Davis, Heiri, Jaccard, Tierney, Datwyler, Axford, Brussel, Cartapanis, Chase, Dawson, de Vernal, Engels, Jonkers, Marsicek, Moffa-Sanchez, Morrill, Orsi, Rehfeld, Saunders, Sommer, Thomas, Tonello, Toth, Vachula, Andreev, Bertrand, Biskaborn, Bringue, Brooks, Caniupan, Chevalier, Cwynar, Emile-Geay, Fegyveresi, Feurdean, Finsinger, Fortin, Foster, Fox, Gajewski, Grosjean, Hausmann, Heinrichs, Holmes, Ilyashuk, Ilyashuk, Juggins, Khider, Koinig, Langdon, Larocque-Tobler, Li, Lotter, Luoto, Mackay, Magyari, Malevich, Mark, Massaferro, Montade, Nazarova, Novenko, Paril, Pearson, Peros, Pienitz, Plociennik, Porinchu, Potito, Rees, Reinemann, Roberts, Rolland, Salonen, Self, Seppa, Shala, St-Jacques, Stenni, Syrykh, Tarrats, Taylor, van den Bos, Velle, Wahl, Walker, Wilmshurst, Zhang and Zhilich2020), which concentrated on reconstructing the marine environment over the past 130,000 years (144 datasets). These compilations represent 1,996 datasets, stored in the LiPD format and available through the LiPDverse (https://lipdverse.org).
Because of the specific goals of these compilation efforts and availability/ease-of-interpretation of the various archiveType, proxyObservationType, inferredVariableType, the resulting set is highly imbalanced (Figures 3–5). This imbalance is also the result of common practices in paleoclimatology and does not only reflect a bias in the compilations themselves. For instance, the proxyObservationType $ \delta 18O $
is one of the most common measurements made in paleoclimatology and is applicable to almost all archiveTypes. Similarly, different ProxyArchives are better suited for different timescales and resolution. So while the climate of the past 2,000 years can be reconstructed from a variety of ProxyArchives (although the PAGES2k compilation is highly biased towards annually-resolved archives), climate reconstructions on longer timescales heavily rely on information contained in marine and lake sediments, ice cores, and to a lesser extent, speleothems.
$ \delta 18O $
is one of the most common measurements made in paleoclimatology and is applicable to almost all archiveTypes. Similarly, different ProxyArchives are better suited for different timescales and resolution. So while the climate of the past 2,000 years can be reconstructed from a variety of ProxyArchives (although the PAGES2k compilation is highly biased towards annually-resolved archives), climate reconstructions on longer timescales heavily rely on information contained in marine and lake sediments, ice cores, and to a lesser extent, speleothems.

Figure 3. Number of datasets with each of the archiveType present in the compilations. The category others lumps archiveType represented less than six times in the datasets.

Figure 4. Number of datasets with each of the proxyObservationType present in the compilations. The category others lumps proxyObservationType represented less than six times in the datasets.
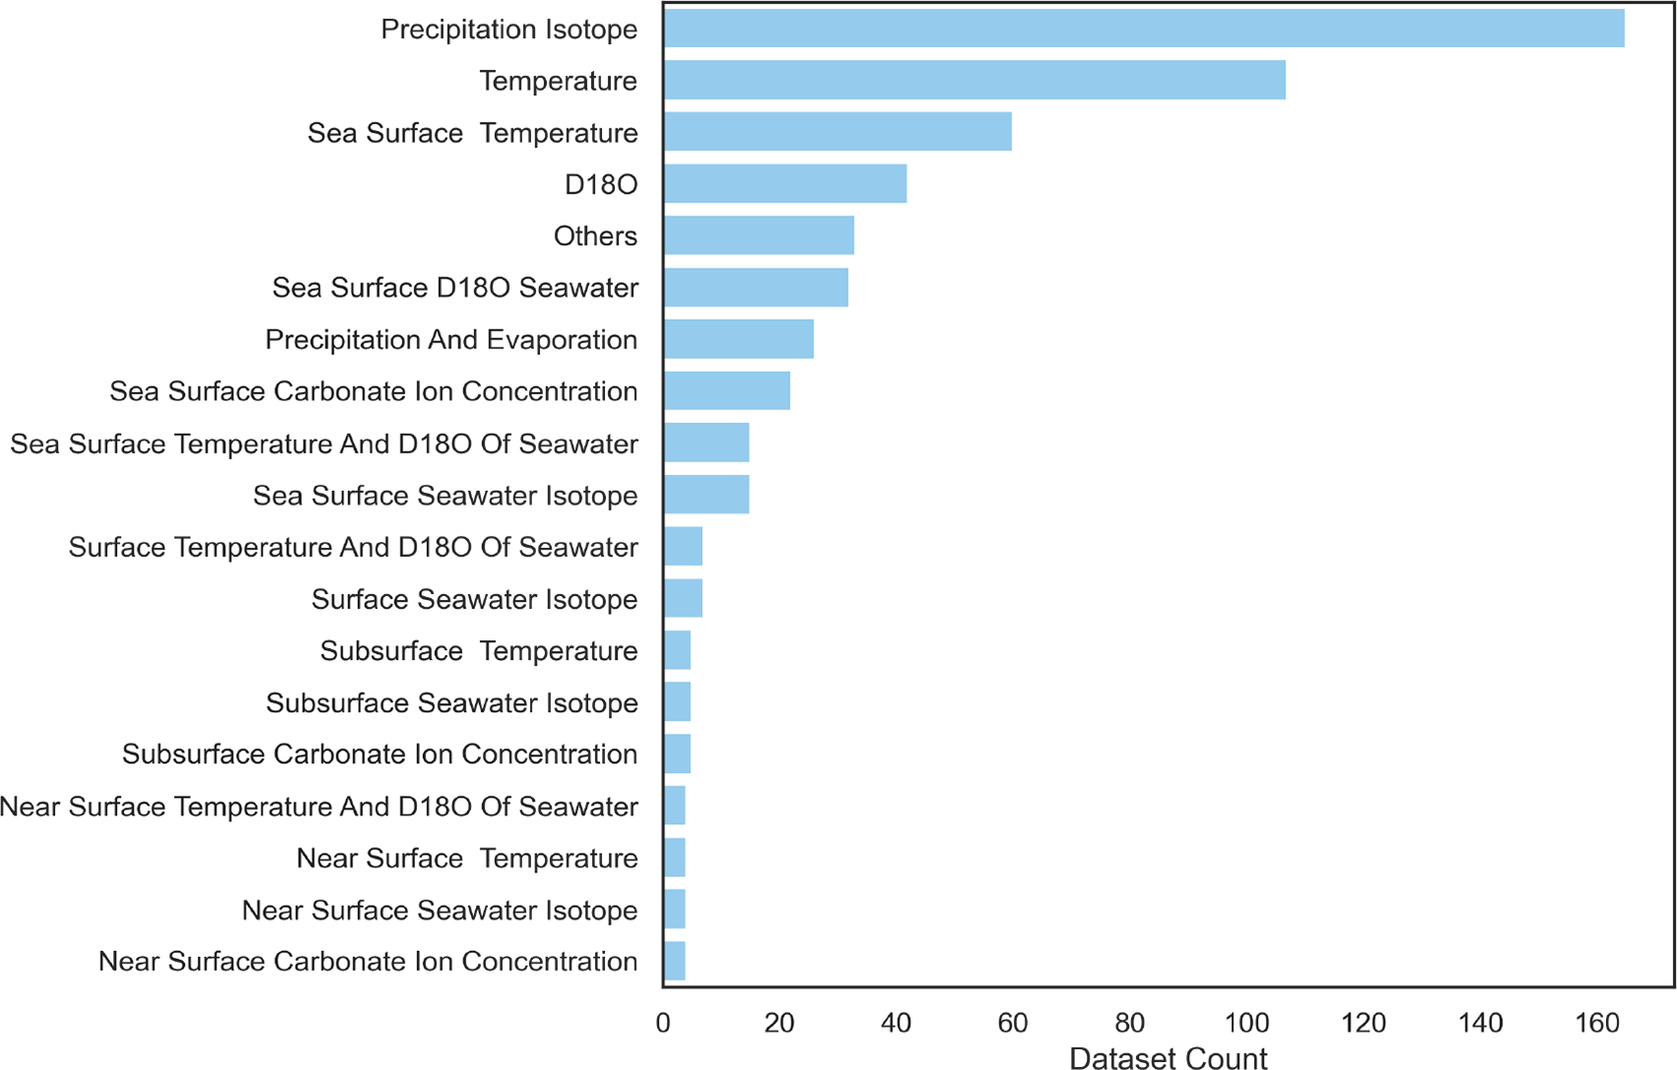
Figure 5. Number of datasets with each of the inferredVariableType present in the compilations. The category others lumps inferredVariableType represented less than six times in the datasets.
Prior to training, we manually cleaned the datasets to remove synonyms (e.g., Mg/Ca is the same as MgCa and mgca) and harmonize archiveType across compilations and the LinkedEarth Ontology (e.g., tree is actually wood, the substrate on which the measurements were made). Note that the system deployed on the LiPD Playground still offers a choice of synonyms for convenience (human labels) which are harmonized in the backend. Finally, when no InferredVariable information was given or the information was not linked to its corresponding ProxyObservation information, the interpretation was used to derive the InferredVariable. Since the recommender system concerns itself with metadata annotation, it does not matter whether the information remains qualitative. To do so, we followed a similar process as our Mg/Ca example in Section 2.2. If more than one interpretation was given, then several sequences were created. In all, we obtained 5,478 sequences from the 1,996 datasets for training, reserving another 1,034 for testing purposes. These two sets do not consider items that are represented only once in the data.
3.3. Evaluation metrics
To evaluate PaleoRec, we used the hit ratio (HR; i.e., recall) and mean reciprocal rank (MRR). The HR is defined as the number of hits in a k-size list of ranked items:
 $$ HR@k=\frac{1}{M}\sum \limits_{u\in U}1\left({R}_{u,{g}_u}\le k\right), $$
where $ k $
is the resultant recommendation set size from PaleoRec,
$ k $
is the resultant recommendation set size from PaleoRec, $ {g}_u $
is the ground truth item,
$ {g}_u $
is the ground truth item, $ {R}_{u,{g}_u} $
is the rank for the ground truth item in the recommendation set, and
$ {R}_{u,{g}_u} $
is the rank for the ground truth item in the recommendation set, and $ M $
is the total number of examples in the test dataset. According to this formula, a hit is defined when the ground truth item is present in the k items recommended by PaleoRec. Both metrics vary between 0 and 1, with a lower score indicative of a miss.
$ M $
is the total number of examples in the test dataset. According to this formula, a hit is defined when the ground truth item is present in the k items recommended by PaleoRec. Both metrics vary between 0 and 1, with a lower score indicative of a miss.
While the HR only gives information about whether the item is present in the recommended set, MRR scores the model on how well it has ranked the item. MRR takes into account the position of the ranked items and calculates the reciprocal of the rank at which the ground truth item was put:
 $$ MRR@k=\frac{1}{M}\sum \limits_{u\in U}\frac{1}{R_{u,{g}_u}} $$
If the ground truth item is consistently at the top of the recommendation, then the HR and MRR are the same. However, in real world situations, we expect the MRR to be lower than the HR.
To evaluate PaleoRec, we considered recommendation set sizes of k = 3, 5, 7, 10, 12, 14, and 16 for calculating the HR and MRR. For most categories, the HR and MRR stays consistently between 0.7 and 1 regardless of the recommendation set size (Figure 6). This is a likely a reflection of two factors: (a) the highly predictable nature of the items in the sequence and (b) the skewness of the data towards specific interpretations of interest to the working groups (i.e., temperature). The most difficult metadata field to predict is the proxyObservationType, which is not surprising since it is our first prediction and only based on the archiveType information. Based on the HR, we recommend presenting the user with 10 items for this category to balance the chances of the right item to be recommended with the nuisance of scrolling over multiple items. Other recommendation sets can be set to five items.

Figure 6. Evaluation metrics: (a) hit ratio and (b) mean reciprocal rank (MRR) for recommendations set size of $ k=\left\{\mathrm{3,5,7,10,12,14,16}\right\} $
for the various metadata fields.
$ k=\left\{\mathrm{3,5,7,10,12,14,16}\right\} $
for the various metadata fields.
3.4. Deployment
PaleoRec has been deployed on the LiPD playground, a web interface for the annotation of paleoclimate datasets and subsequent downloading into the LiPD format (https://lipd.net/playground). This web service was used by scientists for annotating some of the datasets in the compilations that served as the basis for PaleoRec.
When a user enters the playground, the interface first prompts for the root metadata, including the archiveType, a required field for LiPD-formatted data, and geographic information. Once the user has selected their archiveType, PaleoRec will assist a user with entering information in the PaleoData section. There, the user is prompted to choose whether the variable they are describing is measured (i.e., the proxyObservationType), inferred (i.e, the inferredVariableType), or representative of either depth or time. In this context, depth refers to the position in the archive at which the measurement for the ProxyObservation is made. Paleoclimatologists make use of the principle of superposition when assigning a time at which the archive deposited, with the top of the sample representing the youngest time. PaCTS (Khider et al., Reference Khider, Zhu, Emile-Geay, Hu, James, Kwan, Athreya and Garijo2019) defines two time representations: age is represented on a time axis starting from the present and increasing back in time while year follows the Gregorian calendar and is usually used in studies concentrating on the past 2,000 years. When a user selects time or depth, a manually curated list of names and units is given to the user. Otherwise, the LSTM model is used for the recommendation.
If a user chooses to enter a measured variable, the two chains are used in conjunction to recommend items for the proxyObservationType (called Variable Name in the user interface), the proxyObservationUnits, the interpretationVariable, and the interpretationVariableDetail. On the other hand, if a user chooses to describe an InferredVariable, the user is first prompted to assign a measured variable from which the inference is made. PaleoRec then resumes predictions from the interpretationVariableDetail to the inferredVariableType and inferredVariableUnits. In some cases, the original ProxyObservation may not be available. This is often the case for legacy datasets, for which only the inferred environmental variable was archived. PaleoRec then bypasses the ProxyObservation information and makes a direct recommendation for the InferredVariable. For any of the fields supported by PaleoRec, if a user is unhappy with the recommendation, they can write in their preferred choice.
3.5. Limitations
We made two assumptions in the development of PaleoRec: (a) we replaced the GRU layer in GRU4Rec (Hidasi et al., Reference Jonkers, Cartapanis, Langner, McKay, Mulitza, Strack and Kucera2016) with an LSTM layer and (b) we assumed that user profiles do not play a role in the recommendation. Regarding our first assumption, we substituted a GRU layer to test the performance of PaleoRec (Figure 7). Using an LSTM or GRU layer does not significantly impact the performance of the recommender system.

Figure 7. Performance comparison between a gated recurrent units (GRU) and an long-short term memory (LSTM) layer: Left: Hit Ratio for recommendations set size of $ k=\left\{\mathrm{3,5,7,10,12,14,16}\right\} $
for a model using an LSTM layer (top) and a GRU layer (bottom). Right: Same as left for the MMR.
$ k=\left\{\mathrm{3,5,7,10,12,14,16}\right\} $
for a model using an LSTM layer (top) and a GRU layer (bottom). Right: Same as left for the MMR.
To test our second assumption, we modeled users as the original authors from the study. We chose the first author as our hypothetical user, assuming that they would be most likely to work within the same subdomain of paleoclimatology, and most importantly, on the same ProxyArchive. Since the LiPD playground does not collect unique identifiers (such as ORCID) for authors, we assumed that authors with the same last name were the same individual for the purpose of this exercise. Adding user information improves the HR of the proxyObservationType and intepretationVariable but decreases this metric for other metadata fields. On average, there is no benefit from the perspective of the MRR. Overall, user information does not significantly improve the recommendation and we opted for anonymous users (Figure 8).

Figure 8. Performance comparison between PaleoRec with and without user information: left: hit ratio for recommendations set size of $ k=\left\{\mathrm{3,5,7,10,12,14,16}\right\} $
for a model using without user representation (top) and with user representation (bottom). Right: Same as left for the mean reciprocal rank (MRR).
$ k=\left\{\mathrm{3,5,7,10,12,14,16}\right\} $
for a model using without user representation (top) and with user representation (bottom). Right: Same as left for the mean reciprocal rank (MRR).
One limitation of our recommender system relates to its use in filling missing metadata automatically, without human supervision. Despite the high MRR for some of the properties, such as units and InferredVariables names, we would not recommend using PaleoRec without validation by an expert user. The high MRR concerns properties down the chain; therefore, it is critical for the properties at the beginning of the chain to be filled out properly. For these properties (i.e., those related to ProxyObservations), the MRR score is low, around 0.4. Therefore, PaleoRec’s strength rests primarily in its ability to offer a more limited number of items to an expert user in the form of a drop down menu, reducing the proliferation of synonyms compared to free-hand annotations as well as the time spent to enter these metadata. In the case of compilation work (which represents the majority of the data in the LiPDverse and all of the training sets used here), a quality control metadata property is often added to the file.
The main limitation concerns future updates to PaleoRec. The LiPD playground does not require login nor does it track users as they enter their datasets. Therefore, we will update PaleoRec when additional datasets from upcoming compilation work become available. This presents the added advantage that the data have been quality-controlled by a group of experts and allow for offline cleaning of new entries if needed. On the other hand, it will delay user feedback and retraining of the model. Considering the existing bias in user interest from prior compilation work, PaleoRec could recommend poor choices for new types of compilation with a different focus (e.g., precipitation, deep ocean circulation). Furthermore, we will only be able to model the “select” behavior type since the LiPD files will only contain the option the user has selected. Another behavior allowed by the LiPD Playground is to ignore the recommendation and use free text to fill out the metadata. Capturing this behavior may improve on the usability of the system since no recommendation could be better than giving a poor choice, which may be highly frustrating.
PaleoRec was built to recommend metadata options for the PaleoData object, the part of the LiPD file that concerns itself with the environmental data, metadata, and interpretation. A future extension of the recommender system should address the ChronData object (i.e., data, metadata, and interpretation that describe age information). Chronology information follows a similar chain as the PaleoData, in which a measurement (e.g., radiocarbon) is made on a ProxyArchive and transformed into an InferredVariable (in this case time, represented as age or year). Unfortunately, few of the available datasets contained this information and only a few unique sequences could be extracted from the data, preventing training a deep learning model. As more data become available, PaleoRec will be updated to recommend on the ChronObject. This limitation applies to other metadata fields in both the PaleoData and ChronData objects.
4. Discussion
This paper describes PaleoRec, a transaction-based sequential recommendation system for the annotation of paleoclimate data. PaleoRec is based on a LSTM layer and was trained on existing datasets compiled by experts in the field. The performance of the algorithm, as measured by the HR, varies between 0.7 and 1, given a large enough recommendation set. PaleoRec has been deployed on the LiPD playground, the main annotation platform for LiPD-formatted datasets.
PaleoRec aims to assist scientists in annotating paleoclimate datasets, making them more findable and reusable by clearly describing them with comprehensive metadata. We anticipate PaleoRec to accomplish two goals: (a) to accelerate metadata annotation by offering a selection of possible entries to a user and (b) to ensure compliance with the existing vocabulary as provided by the LinkedEarth Ontology. Future work will expand on the capabilities of PaleoRec to other metadata fields as well as the incorporation of NOAA’s PaST thesaurus (Morrill et al., Reference Paszke, Gross, Massa, Lerer, Bradbury, Chanan, Killeen, Lin, Gimelshein, Antiga, Desmaison, Kopf, Yang, DeVito, Raison, Tejani, Chilamkurthy, Steiner, Fang, Bai, Chintala, Wallach, Larochelle, Beygelzimer, d Alché-Buc, Fox and Garnett2021), which extensively describes concepts in paleoclimatology. Together with previous efforts in (meta)data standardization for paleoclimate datasets (McKay and Emile-Geay, Reference Neukom, Steiger, Gómez-Navarro, Wang and Werner2016; Garijo et al., Reference Hidasi, Karatzoglou, Baltrunas and Tikk2019; Khider et al., Reference Khider, Zhu, Emile-Geay, Hu, James, Kwan, Athreya and Garijo2019), PaleoRec will contribute to make these data FAIR and increase their value and relevance to our understanding of current environmental changes.
Data Availability Statement
The raw, training data are available through the LiPDverse: https://lipdverse.org. The code for PaleoRec can be found on GitHub: https://github.com/paleopresto/paleorec (doi:10.5281/zenodo.5108095) and includes the cleaning, training, and testing code. A Jupyter Notebook served through Binder can be used to test the recommender system outside of the LiPD playground. The code to reproduce the figures in this paper is available on GitHub: https://github.com/paleopresto/recommender (doi:10.5281/zenodo.5107652). PaleoRec is deployed on the LiPD playground: https://lipd.net/playground.
Author Contributions
Conceptualization: D.K., N.M., J.E.G., and C.R.; Data curation: S.M. and D.K.; Formal analysis: S.M. and D.K.; Funding acquisition: N.M., J.E.G., D.K., and C.R.; Investigation: S.M. and D.K.; Methodology: S.M. and D.K.; Project administration: D.K. and N.M.; Resources: S.M., D.K., C.H., and N.M.; Software: S.M., C.H., and D.K.; Supervision: D.K.; Validation: S.M. and D.K.; Visualization: S.M. and D.K; Writing—original draft: S.M., D.K., N.M., J.E.G., and C.R.; Writing—review and editing: S.M., D.K., N.M., J.E.G., and C.R. All authors approved the final submitted draft.
Funding Statement
This research was supported by grants from the National Science Foundation (NSF) under research grant EAR 1948822 and EAR 1948746. The funder had no role in study design, data collection and analysis, decision to publish, or preparation of the manuscript.
Competing Interests
The authors declare no competing interests exist.


 Open access