


1. Introduction
Evaporation of sessile droplets has been studied vastly in the past decades (Cazabat & Guéna Reference Cazabat and Guéna2010; Brutin Reference Brutin2015; Zang et al. Reference Zang, Tarafdar, Tarasevich, Choudhury and Dutta2019; Lohse & Zhang Reference Lohse and Zhang2020; Wang et al. Reference Wang, Orejon, Takata and Sefiane2022). Beyond the scope of fundamental research, the interest also originates from its huge relevance to various technological and biological applications, e.g. inkjet printing (Park & Moon Reference Park and Moon2006; Lohse Reference Lohse2022), surface patterning (Kuang, Wang & Song Reference Kuang, Wang and Song2014), disease diagnostics (Brutin et al. Reference Brutin, Sobac, Loquet and Sampol2011), and microfabrication (Kong et al. Reference Kong, Tamargo, Kim, Johnson, Gupta, Koh, Chin, Steingart, Rand and McAlpine2014), among others. A comprehensive physical picture of the evaporative lifetime of small airborne droplets can even be crucial to better understand the spreading of the coronavirus in the current pandemic (Mittal, Ni & Seo Reference Mittal, Ni and Seo2020; Chong et al. Reference Chong, Ng, Hori, Yang, Verzicco and Lohse2021; Wang et al. Reference Wang, Alipour, Soligo, Roccon, De Paoli, Picano and Soldati2021a).
While the evaporation (or analogous dissolution) behaviour of pure droplets has been well understood extensively (Deegan et al. Reference Deegan, Bakajin, Dupont, Huber, Nagel and Witten1997; Popov Reference Popov2005; Ristenpart et al. Reference Ristenpart, Kim, Domingues, Wan and Stone2007; Cazabat & Guéna Reference Cazabat and Guéna2010; Gelderblom et al. Reference Gelderblom, Marin, Nair, van Houselt, Lefferts, Snoeijer and Lohse2011; Stauber et al. Reference Stauber, Wilson, Duffy and Sefiane2014; Lohse & Zhang Reference Lohse and Zhang2015; Hatte et al. Reference Hatte, Pandey, Pandey, Chakraborty and Basu2019; Zang et al. Reference Zang, Tarafdar, Tarasevich, Choudhury and Dutta2019; Chong et al. Reference Chong, Li, Ng, Verzicco and Lohse2020; Shiri et al. Reference Shiri, Sinha, Baumgartner and Cira2021), much less research has been done on multicomponent droplets. However, most droplet systems encountered in nature and technology are multicomponent, containing either multiple solutes (Bennacer & Sefiane Reference Bennacer and Sefiane2014; Kim et al. Reference Kim, Boulogne, Um, Jacobi, Button and Stone2016; Diddens et al. Reference Diddens, Tan, Lv, Versluis, Kuerten, Zhang and Lohse2017; Jiang et al. Reference Jiang, Chen, Wu, Ding and Li2021; Wang et al. Reference Wang, Karapetsas, Valluri, Sefiane, Williams and Takata2021b; Williams et al. Reference Williams, Karapetsas, Mamalis, Sefiane, Matar and Valluri2021; Wu, Doi & Man Reference Wu, Doi and Man2021) or dispersed particulates (Manoharan, Elsesser & Pine Reference Manoharan, Elsesser and Pine2003; Lauga & Brenner Reference Lauga and Brenner2004; Marin et al. Reference Marin, Gelderblom, Lohse and Snoeijer2011; Thayyil Raju et al. Reference Thayyil Raju, Koshkina, Tan, Riedinger, Landfester, Lohse and Zhang2021). The difficulty stems from the complex physicochemical hydrodynamics brought by the selective evaporation of each component in the mixture systems, including the coupling of the mutual interactions between species (Brenn et al. Reference Brenn, Deviprasath, Durst and Fink2007), contact line dynamics (Mouat et al. Reference Mouat, Wood, Pye and Burton2020), shape formation (Pahlavan et al. Reference Pahlavan, Yang, Bain and Stone2021), flow structures (Christy, Hamamoto & Sefiane Reference Christy, Hamamoto and Sefiane2011; Edwards et al. Reference Edwards, Atkinson, Cheung, Liang, Fairhurst and Ouali2018; Li et al. Reference Li, Diddens, Lv, Wijshoff, Versluis and Lohse2019; Diddens, Li & Lohse Reference Diddens, Li and Lohse2021; Moore, Vella & Oliver Reference Moore, Vella and Oliver2021), and even phase segregation (Tan et al. Reference Tan, Diddens, Lv, Kuerten, Zhang and Lohse2016; Li et al. Reference Li, Lv, Diddens, Tan, Wijshoff, Versluis and Lohse2018, Reference Li, Diddens, Segers, Wijshoff, Verluis and Lohse2020a; Karpitschka Reference Karpitschka2018; Kim & Stone Reference Kim and Stone2018; Sadafi et al. Reference Sadafi, Rabani, Dehaeck, Machrafi, Haut, Dauby and Colinet2020). Over the past 20 years, a growing interest in such complex evaporative systems appears in the literature, which was reviewed recently by Lohse & Zhang (Reference Lohse and Zhang2020).
In (partially) volatile multicomponent droplets, in general, phase segregation emerges, as such systems are out of equilibrium. This is due to evaporation (Tan et al. Reference Tan, Diddens, Lv, Kuerten, Zhang and Lohse2016; Li et al. Reference Li, Lv, Diddens, Tan, Wijshoff, Versluis and Lohse2018; Karpitschka Reference Karpitschka2018; Kim & Stone Reference Kim and Stone2018; Sadafi et al. Reference Sadafi, Rabani, Dehaeck, Machrafi, Haut, Dauby and Colinet2020) or dissolution (Dietrich et al. Reference Dietrich, Rump, Lv, Kooij, Zandvliet and Lohse2017), or crystallization (Mailleur et al. Reference Mailleur, Pirat, Pierre-Louis and Colombani2018; Li et al. Reference Li, Salvator, Wijshoff, Versluis and Lohse2020b). Commonly, the emerging segregative patterns lead to a non-volatile shielding or an entrapment, where one liquid on the surface of the droplets covers the others, hindering its further evaporation. A detailed understanding of the shielding and the entrapment is crucial for many industrial and technical applications which require precise control of the droplet drying time, e.g. inkjet-printed droplets drying on paper. Moreover, liquid–liquid phase segregations are also essential in many biochemical reactions (Hyman, Weber & Jülicher Reference Hyman, Weber and Jülicher2014). As a very recent example, a resemblant arch-shaped liquid–liquid phase segregation pattern triggered by evaporation has been observed in an aqueous mixture droplet of polyethylene glycol (PEG) and dextran (Guo et al. Reference Guo, Kinghorn, Zhang, Li, Poonam, Tanner and Shum2021), which is potentially a robust method for prebiotic compartmentalization.
Our recent study on an evaporating 1,2-hexanediol–water binary droplet reported a liquid–liquid phase segregation of the non-volatile (at room conditions) component, i.e. 1,2-hexanediol, during the evaporative process (Li et al. Reference Li, Lv, Diddens, Tan, Wijshoff, Versluis and Lohse2018). We demonstrated that for that particular binary droplet system, the concentration gradient on the droplet surface caused by the preferential evaporation of water leads to only a small gradient of the surface tension. The resulting solutal Marangoni flow is then initially insufficient to homogenize the component distribution within the entire droplet. Therefore, the accumulated solute separates from the mixture, starting with the nucleation of a series of small 1,2-hexanediol droplets at the contact line. These then merge to arch-shaped structures. The droplet lifetime is extended significantly due to the shielding effect of this non-volatile component. The volatile water remains trapped in the interior of the droplet.
In that study, we also showed that the flow structure changes drastically due to the emergence of the segregation. An evolution of flow structure was characterized by the temporal evolution of the vorticity (see figure 1), as follows.
(i) At the early stage before the segregation occurs, a radial flow near the substrate towards the droplet edge is driven by Marangoni forces.
(ii) After the first emergence of a segregated phase of 1,2-hexanediol, the radial flow evolves to a state of multiple vortices.
(iii) Eventually, the vortices decay as the evaporation ceases.
While the flow transitions were characterized by the evolution of vorticity, to the best of our knowledge, a comprehensive understanding of the complex flow dynamics induced by the segregation is still missing, especially the one within the segregative phase. Hence a systematic investigation is required. In this work, we thus revisit the evaporating droplet system of a 1,2-hexanediol–water binary solution with multiple experimental means, focusing mainly on the dynamics after the segregation has emerged, aiming to study systematically the growth of the liquid–liquid phase segregation patterns and the resulting flow structure. We also offer a theoretical understanding of the local flow structure within the segregative patterns, and of the decay of the flow intensity at the final stage of the evaporation.
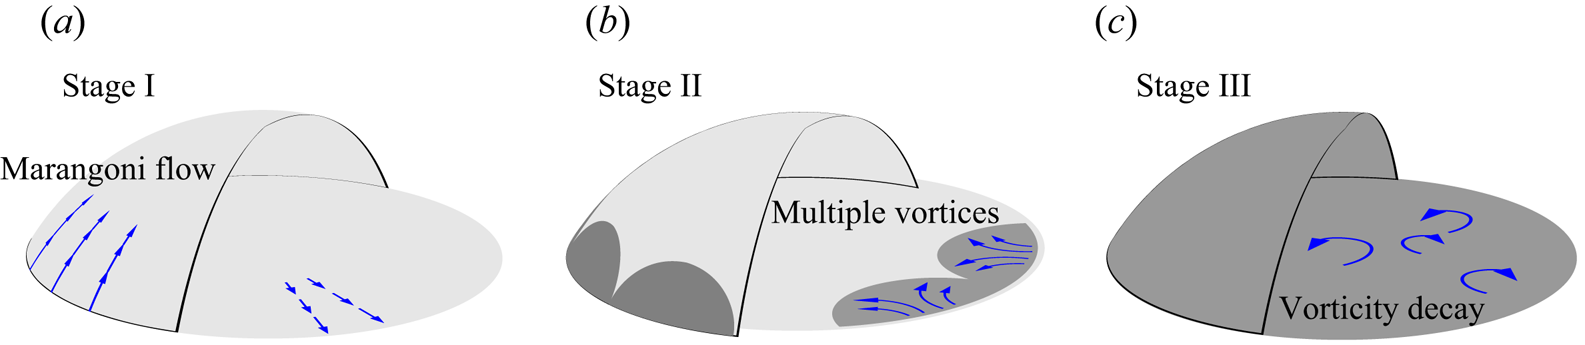
Figure 1. Schematics of the three life stages of an evaporating 1,2-hexanediol–water binary droplet.
The paper is organized as follows: In § 2, we introduce the employed experimental techniques. In § 3, we show the experimental observations on the overall physicochemical hydrodynamics of the evaporating process, and identify three successive life stages (Stages I, II and III) by the combination of the direct observation of the flow structures and the quantification of the temporal radial flow velocity. In § 4, we show briefly and discuss the flow structure at Stage I prior to the occurrence of the segregation, summarizing and confirming the results of Li et al. (Reference Li, Lv, Diddens, Tan, Wijshoff, Versluis and Lohse2018). In § 5, we then focus on Stage II, in which the segregative patterns emerge and grow. We interpret quantitatively the growth dynamics of the segregative patterns and the local flow structures within them. In § 6, we quantify and explain quantitatively the flow in the final Stage III, namely the decay of the flow intensity when the evaporation gradually ceases. The paper ends with a summary and further discussions (§ 7).
2. Experimental methods
2.1. Solution and substrate preparation
The binary solution that we used in our droplet system consisted of 90 %/w Milli-Q water (Reference A $+$, Merck Millipore,
  $25\,^\circ {\rm C}$) and 10 %/w 1,2-hexanediol (Sigma-Aldrich,
  $\geqslant$98 %). The experiments were performed on a hydrophobized glass slide coated with octadecyltrichlorosilane (OTS, Sigma-Aldrich, >90 %) (Peng et al. Reference Peng, Xu, Hughes and Zhang2014). Before each measurement, the substrates were processed with a sonication cleaning in 99.8 % ethanol and in Milli-Q water for 15 and 5 min sequentially, and subsequently dried with compressed N
 $_2$ gas flow for 30 s. The droplets were deposited by a glass syringe with a full metal needle (Hamilton,
  $10\ \mathrm {\mu }{\rm l}$, Model 701 NWG SYR, Cemented NDL).
2.2. Confocal microscopic measurement
Confocal microscopy was employed to conduct a series of measurements on the evaporation dynamics of the droplet. The observations were carried out by utilizing an inverted Nikon A1 confocal laser scanning microscope system (Nikon Corporation, Tokyo, Japan) with a  $10\times$ dry objective (Nikon, Plan Fluor
  $\times$10/0.30, OFN25, DIC, L/N1).
2.2.1. Micro-particle image velocimetry
For flow field visualization, we performed micro-particle image velocimetry ( $\mu$PIV) by adding fluorescent particles (microParticles GmbH; PS-FluoRed-5.0: Ex/Em 530 nm/607 nm) into the working fluids. The PIV measurements were also conducted on the confocal microscopy set-up. The particles were excited by a laser at wavelength 561 nm, and the fluorescent signals were captured at frame rate 25 frames per second (f.p.s.). We measured the flow field near the substrate quantitatively by adding 520 nm diameter fluorescent particles at concentration
  $2 \times 10^{-3}$ vol% into the droplet. For prepossessing the PIV images, we removed the background noise outside the droplet by applying a contact line detection algorithm, and subsequently a pixel-wise minimum intensity background was subtracted from every image to enhance the signal-to-noise ratio. To obtain the velocity vector field, we performed iterative two-dimensional cross-correlations with multiple interrogation window sizes with a 50 % overlap, which were
  $64 \times 64$ pixels,
  $32 \times 32$ pixels and
  $16\times 16$ pixels, sequentially. A Gaussian fitting function was used to determine the subpixel displacement. The velocity vector calculation was performed using open-source software PIVlab (Thielicke & Stamhuis Reference Thielicke and Stamhuis2014).
2.2.2. Refracted shadowgraphy
We modified a method originally proposed by Chao & Zhang (Reference Chao and Zhang2001), namely laser refracted shadowgraphy, and applied it to the confocal microscopy. A white-light beam was collimated to a vertically parallel beam and then passed perpendicularly through a test droplet, placed on an OTS glass substrate. The white-light beam produced a refractive image of the sessile droplet that was captured by the transmitted light detector at 25 f.p.s. (Lv et al. Reference Lv, Le The, Eijkel, van den Berg, Zhang and Lohse2017). The disturbances caused by local concentration variances within the test droplet refracted light rays, leading to shadows on the refractive images.
2.2.3. Fluorescence image acquisition
To visualize the local details within the segregative patterns, the binary mixture was labelled with two different dyes, Dextran and Nile Red (Li et al. Reference Li, Lv, Diddens, Tan, Wijshoff, Versluis and Lohse2018). Dextran dissolves preferentially in water, and it was excited by a laser at wavelength 488 nm, while Nile Red is a lipophilic dye that dissolves only in 1,2-hexanediol and was excited by a laser at wavelength 561 nm simultaneously. Two-dimensional (2-D) images were obtained by scanning in the focal plane with depth of field  $0.957\ \mathrm {\mu }{\rm m}$ at the bottom of the droplet
  ${\sim }10\ \mathrm {\mu }{\rm m}$ above the substrate. This allows us to monitor the evolution of both the segregative patterns and the flow structure during the entire evaporation process. The scan started as soon as the droplet was deposited on the glass substrate. Operating in resonant mode, the 2-D images were captured with frame rate 25 f.p.s. To increase the contrast of images for further analysis, we converted the images to be binary (black and white) coloured.
3. Overall phenomenology: hydrodynamics induced by phase segregation and the three identified life stages
To obtain the overall phenomenology of the physicochemical hydrodynamics during the evaporation process in the 1,2-hexanediol–water binary droplet system, we first optically monitor the whole evaporation process, by using refracted shadowgraphy in combination with  $\mu$PIV. The multiple channels of the confocal microscope allow us to perform the two visualization methods simultaneously; see figures 2(a0–a2).
(i) The transmitted light detector captures the refracted light through the droplet for shadowgraphy.
(ii) The laser channel captures the fluorescent signal for
 $\mu$PIV.

The focal plane is located at the bottom of the droplet, slightly above the substrate ( ${\sim }10\ \mathrm {\mu }{\rm m}$). Figure 2(a1) displays the shadowgraph, in which the strong shadows indicate the segregative patterns, whereas the bright areas represent water-rich regions. Figure 2(a2) shows a typical snapshot of fluorescent particles for
  $\mu$PIV at the same instant.

Figure 2. Confocal microscopic measurement of an evaporating 1,2-hexanediol–water droplet. (a) Transmitted light through the droplet and fluorescent signals of tracer particles captured simultaneously by two channels of the confocal microscopy. (b1–b6) Morphological evolution of convective structures with the emergence of phase segregation in an evaporating 1,2-hexanediol–water droplet. Here, (b1) corresponds to Stage I, (b2–b5) to Stage II, and (b6) to the final stage III. The three-dimensional sketch illustrates the flow pattern in (b3). The dark blue arrows represent fast flow streams (inwards at the droplet surface and outwards close to the substrate), and the light blue arrows slow secondary flows. The white stripes represent the water-rich paths, which also correspond to slow-flow streams. The tip of each arch becomes a stagnation point of the slow-flow streams. (c) A refractive image of the droplet recorded by a transmitted light detector (c1), and the corresponding flow field at the same instant (c2). Here, the droplet is in Stage II.
3.1. Axial symmetric breaking induced by inhomogeneous nucleation of 1,2-hexanediol droplets
Figures 2(b1–b6) display a series of refracted shadowgraphs of an evaporating 1,2-hexanediol–water droplet with the emergence of the segregation ( $t = t_s = 50$ s). It starts with a homogeneous appearance of the entire droplet without the segregation at the beginning of the evaporation (figure 2b1). Then 1,2-hexanediol microdroplets nucleate at the rim of the binary droplet (figure 2b2). The emergence of nucleation sites is not distributed homogeneously along the contact line, but initially is local at one particular point and only then extends to the rest of the rim. These inhomogeneous nucleations of segregative patterns induce an axial symmetric breaking of flow structures in the following process.
Without the pinning of the contact line, the contact area features a continuous shrinkage during the entire evaporation process. During the growth of the nucleated arch-shaped patterns, multiple water-rich streams emerge, revealed by the bright paths connecting the centre of the droplet and the tip of each arch pattern (figure 2b3). This resembles the thermocapillary instability appearing in heated droplets of ethanol (Sefiane et al. Reference Sefiane, Moffat, Matar and Craster2008; Sáenz et al. Reference Sáenz, Wray, Che, Matar, Valluri, Kim and Sefiane2017). We note that the surface tension varies with both the local temperature and the local solutal concentration, that is,  $\gamma = \gamma _0 - \partial _T\gamma (T-T_0)-\partial _c\gamma (c-c_0)$; normally for binary droplets,
 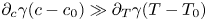 $\partial _c\gamma (c-c_0) \gg \partial _T\gamma (T-T_0)$. Therefore, the convective flow can be simplified to a purely soluto-capillary flow, neglecting the thermal Marangoni effect.
The schematic in figure 2(b3) illustrates a fingering flow pattern, namely the growing arches impeding the Marangoni flow towards the edge of the droplet, causing the slow-flow stream. The tip of each arch becomes a stagnation point of the slow-flow streams (see sketch in figure 2b3). The radially outward flow in the streams continues towards the contact line region along the boundaries of the arches. During further evaporation, the arches grow and merge with neighbouring ones, which leads to the formation of new slow-liquid streams (figure 2b4). Due to the breaking of axial symmetry caused by the non-uniform growth of the segregative patterns, irregular convection cells appear and evolve (figure 2b5). Eventually, the convection cells disappear once the evaporation ceases (figure 2b6). As shown in the previous section, the expansion of the arches reverses the flow direction in the vicinity of the contact line, namely from originally outward to inward. We compare qualitatively the shadowgraph with the  $\mu$PIV results in figures 2(c1–c2): the inward radial flow (indicated by blue colour) in the contact line region shown in the velocity field (figure 2c2) corresponds to the patterns within segregative region shown in the shadowgraph (figure 2c1).
3.2. Life stages identified by transitions in the flow
To quantify further the evolution of flow structure, we analyse the measured results from the  $\mu$PIV. In our previous study (Li et al. Reference Li, Lv, Diddens, Tan, Wijshoff, Versluis and Lohse2018), the different life stages of an evaporating 1,2-hexanediol–water droplet were identified by the temporal evolution of the spatially averaged vorticity. Here, by combining the
  $\mu$PIV results and the observations from shadowgraphy, more quantitative details of the flow transitions can be identified by the evolution of the local radial velocity.
Figure 3(a) depicts a three-dimensional (3-D) map showing the temporal evolution of the radial velocity along the radial position, which is normalized by the time-dependent footprint radius  $R(t)$ of the droplet. The colour bar displays the intensity of the radial flow velocity, where positive values indicate outward direction. Three distinct stages of flow structure are identified.
(i) Stage I: before the segregation occurs, the flow is radially outwards and most intensive in the vicinity of the contact line, whereas the flow in the interior is barely visible.
(ii) Stage II: with the emergence of segregation, the radial flow reverses from the contact line region, and the flow structure becomes irregular.
(iii) Stage III: the flow intensity starts to decay to nearly zero, until the evaporation ceases finally.
With the simultaneous observation from shadowgraphy, another two sub-regimes within Stage II can be distinguished, namely the fingering pattern and the convective cells shown in figures 2(b3–b5). Stage III begins when the convection cells disappear. In this final stage, the flow intensity starts to decay to nearly zero, until the evaporation ceases finally.
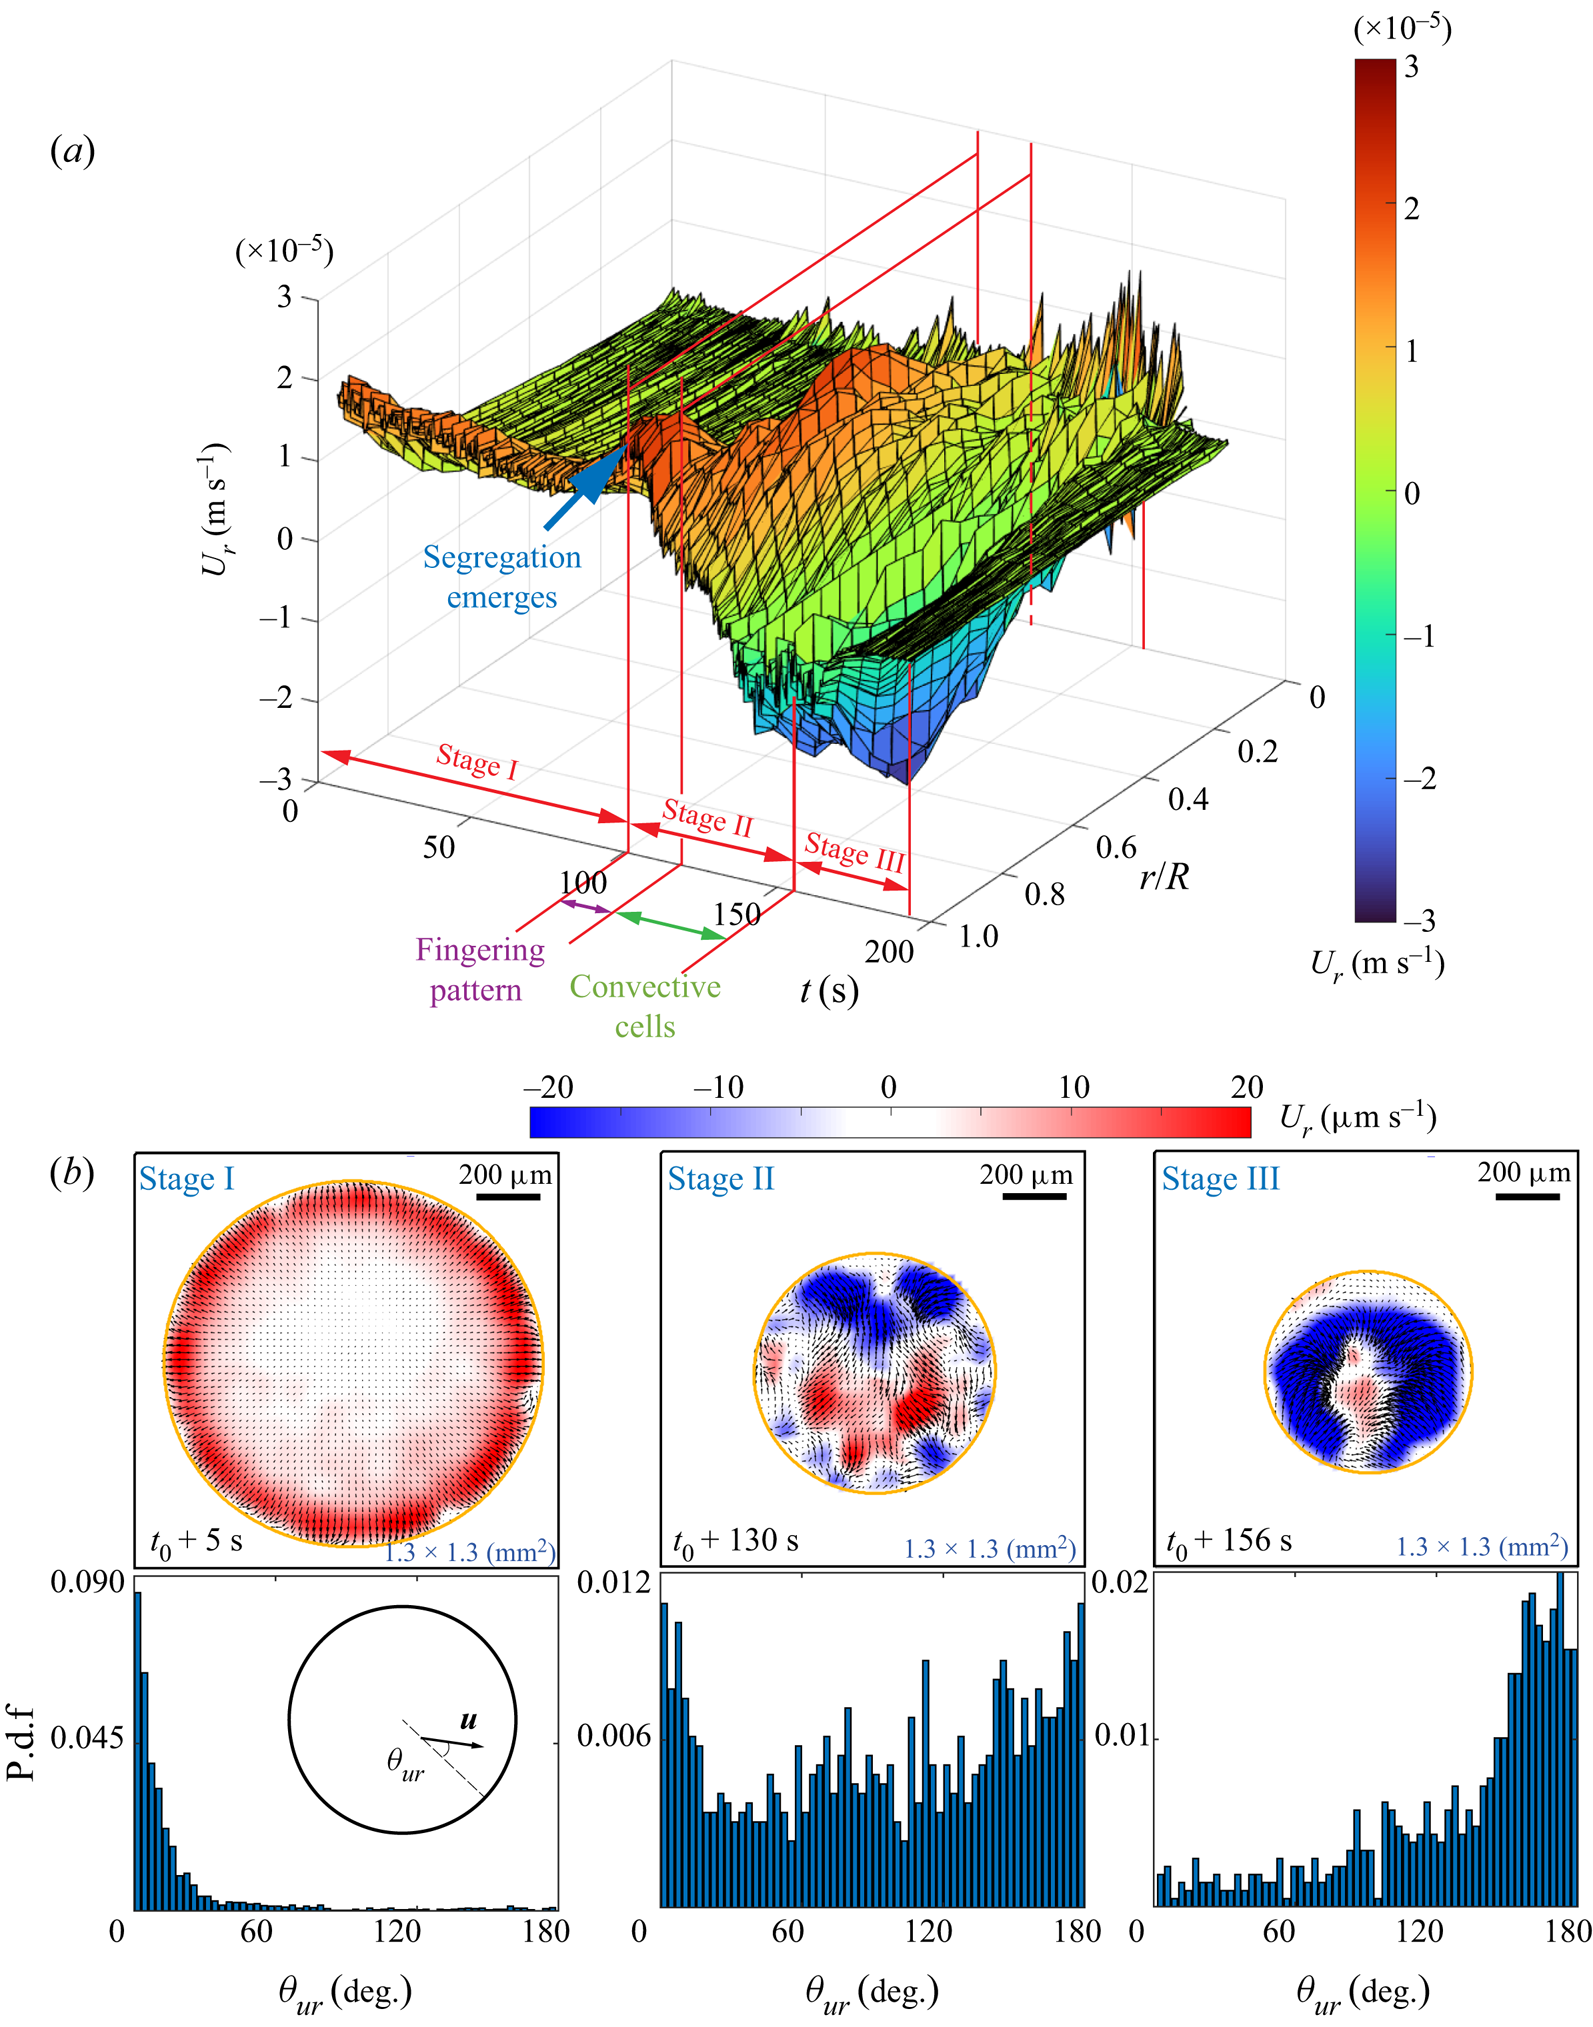
Figure 3. Results from micro-particle image velocimetry ( $\mu$PIV) in an evaporating 1,2-hexanediol–water binary droplet. The flow field near the substrate is revealed. (a) A 3-D map showing the temporal evolution of the radial velocity averaged in azimuthal angle along the radial position. (b) The probability distribution function (p.d.f.) of the azimuthal angle of the flow velocity versus the radial direction at three different life stages.
Figure 3(b) displays three snapshots of flow fields at different life stages. The first row shows the corresponding flow field at each instant. The second row shows the probability distribution function (p.d.f.) of the azimuthal angle  $\theta _{ur}$ of the local velocity (i.e. the angle between velocity
  $u$ and radial direction) versus the radial direction.The first column exhibits the flow structure in Stage I, which is before the occurrence of segregation. Driven by the Marangoni forces along the liquid–air interface, the flow is mainly radial towards the edge of the droplet (seen by the accumulation of the p.d.f. at
  $\theta _{ur} = 0$), where the flow is also more intensive than in the interior. With the emergence of segregation, Stage I undergoes a transition to Stage II. As seen in the second column, the p.d.f. of the velocity direction in Stage II becomes more uniform, indicating a more irregular flow pattern, which can be seen in the snapshot of the velocity field. We attribute this to the existence of multiple vortices induced by segregation. The last column shows the velocity vector field at the beginning of Stage III, when the segregative patterns grow and finally fully occupy of the whole droplet. Then the p.d.f. shows an opposite distribution as compared to Stage I, indicating that the inward flow radially towards the interior of the droplet is dominant.
4. Stage I: Marangoni-effect-dominant flow before segregation
In our previous work (Li et al. Reference Li, Lv, Diddens, Tan, Wijshoff, Versluis and Lohse2018), we have studied the early period of the evaporation process before the occurrence of the segregation (i.e. Stage I), revealing the Marangoni-effect-dominant flow structure and the mechanism leading to the segregation. Due to the preferential evaporation of water, a relatively high concentration of 1,2-hexanediol is left behind and thus accumulates in the contact line region. This leads to a surface tension gradient at the liquid–air interface, driving a Marangoni flow from the contact line to the apex of the droplet. This interfacial flow also induces convective flows in the bulk of the droplet. Near the substrate, this convective flow is directed radially outwards to the rim of the droplet, which is consistent with our observation here in figures 2(b1) and 3(a). For details of this early Stage I and a quantitative analysis, we refer to Li et al. (Reference Li, Lv, Diddens, Tan, Wijshoff, Versluis and Lohse2018).
In the following sections of this paper, we focus on Stages II and III, and the segregative patterns and resulting flow structures during these later stages, and offer theoretical interpretations of them.
5. Stage II: evolution of segregative patterns and induced local flow structure
At Stage II (after the first segregation has emerged), a radial flow reversal induced by the growth of the segregation occurs. To study this, a detailed local observation of the segregative patterns is required. Experimentally, we employ the fluorescence image technique coupled with confocal microscopy, i.e. labelling the segregated phase with different dyes, in order to resolve locally the details of the flow field within the segregated phase. Recently, Seyfert & Marin (Reference Seyfert and Marin2022) reported an experimental study on the influence of added dye on the Marangoni bursting phenomenon. In our case, the observations by labelling with fluorescent dyes show the emergence of nucleation sites distributed more homogeneously along the contact line, rather than the inhomogeneous nucleation sites there. Note that phenomenologically, the two cases with or without the dyes show similar behaviours with respect to the growth of the segregation and the resulting flow structure within the segregative patterns.
5.1. Growth dynamics of the liquid–liquid phase segregation
Before the study of the local flow structure within the segregative patterns of 1,2-hexanediol, we aim first to understand its growth dynamics. The images in figures 4(a1–a5) are taken by confocal microscopy from the bottom view: the dark regions shaping as arches in the vicinity of the contact line are the segregated phase of 1,2-hexanediol, whereas the grey counterpart is the mixture phase. The phase segregation starts with the emergence of various tiny nuclei distributed evenly along the contact line of the binary droplet (figure 4a1). With further evaporation of water, arch-shaped segregation areas grow, and then merge with their neighbours (figures 4a2–a4). Eventually, these areas occupy fully the entire droplet (figure 4a5). Figure 4(b) shows the temporal evolution of the azimuthal undulations  $W(\theta,t)$ of the growing arches, namely the radial distance between the tip of the arches and the contact line of the droplet. The total number
  $N_s$ and projected area
  $A_s$ of the arches are displayed in the inset of figure 4(c).
Figure 4. Growth dynamics of the segregated 1,2-hexanediol phase. (a) Bottom-view snapshots, captured via confocal microscope, highlighting the temporal growth of the phase segregation of 1,2-hexanediol in an evaporating binary droplet with 10 %/90 % (w/w) 1,2-hexanediol/water initial concentration. (b) Temporal evolution of the azimuthal undulations  $W(\theta )$ of the nucleated droplets along the binary droplet radius during the growth of the segregated phase shown in sequence in (a). (c) Scaled master curve of the segregated phase area
  $A_s/A_t$ versus time
  $(t-t_s)/(t_f-t_s)$. Inset: raw data for the temporal evolution of
  $A_s$ and the number of nucleated droplets
  $N_s$ versus the time
  $t$.
$t$.
We interpret that the growth of liquid–liquid phase-segregation patterns is controlled by the depleted water concentration due to evaporation. The mass reduction rate of the mixture phase is proportional to the evaporative flux rate of water, i.e.  $\textrm {d}m_m/\textrm {d}t \sim -R_m D_{w,air}\,\Delta c$ (Sobac & Brutin Reference Sobac and Brutin2014; Li et al. Reference Li, Diddens, Segers, Wijshoff, Verluis and Lohse2020a), where
  $R_m$ is the distance from the centre of the droplet to the front of the arches (see figure 4a3),
  $D_{w,air}$ is the diffusion coefficient of water vapour in air, and
  $\Delta c$ is the vapour concentration difference between the droplet surface and the surroundings. The concentration dependence of the mixture liquid density
  $\rho _m$ is neglected here. With the geometrical relations among the volume
  $V_m$, the projected area
  $A_m$ and the radius
  $R_m$ of the mixture phase, i.e.
  $V_m \sim A_m^{3/2}$ and
  $R_m \sim A_m^{1/2}$, the change of the droplet mass is
 \begin{equation} \frac{\textrm{d}m_m}{\textrm{d}t} = \frac{\textrm{d}(\rho_mV_m)}{\textrm{d}t} = \frac{\textrm{d}\rho_m}{\textrm{d}t}\,V_m + \rho_m\, \frac{\textrm{d}V_m}{\textrm{d}t}, \end{equation}
in which  $\rho _m = (\rho _wV_w+\rho _HV_H)/(V_w+V_H) \approx \textrm {const.}$, with the density of water
  $\rho _w = 997\ {\rm kg}\ {\rm m}^{-3}$, and the density of 1,2-hexanediol
  $\rho _H = 951\ {\rm kg}\ {\rm m}^{-3}$ at room temperature. So we obtain
 \begin{equation} \frac{\textrm{d}m_m}{\textrm{d}t} \approx \rho_m\, \frac{\textrm{d}V_m}{\textrm{d}t} \sim \rho_m\,\frac{\textrm{d}(A_m^{3/2})}{\textrm{d}t}, \end{equation}
and the mass depletion by evaporation is
 \begin{equation} \frac{\textrm{d}m_m}{\textrm{d}t} \sim{-}R_m D_{w,air}\,\Delta c \sim{-}A_m^{1/2}D_{w,air}\,\Delta c. \end{equation}
From equating (5.2) and (5.3), we obtain 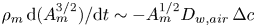 $\rho _m\,\textrm {d}(A_m^{3/2})/\textrm {d}t \sim -A_m^{1/2}D_{w,air}\,\Delta c$, which yields
 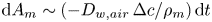 $\textrm {d}A_m \sim (-D_{w,air}\,\Delta c/\rho _m)\,\textrm {d}t$, i.e. linear shrinkage in time for the projected area of the mixture phase
 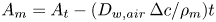 $A_m = A_t -(D_{w,air}\,\Delta c/\rho _m)t$. Here,
  $A_t$ is the total initial footprint area, and
  $D_{w,air}$ and
  $\Delta c$ were assumed to remain nearly constant. The segregated area
  $A_s$ then is
  $A_s=A_t-A_m$. Rescaling with the lifetime of the droplet
  $t_f$ and the time until the emergence of the first segregation
  $t_s$, which are all constant for each case, yields
 \begin{equation} \frac{A_s}{A_t} \sim \frac{t-t_s}{t_f-t_s}, \end{equation}
i.e. linear growth of the segregated area. Equation (5.4) is verified in figure 4(c) by displaying the temporal evolution of the area of the segregated phase, compensated by the total footprint area  $A_s/A_t$ in logarithmic scale. The observed linear growth indeed supports that the growth rate of the segregated phase patterns is controlled by the evaporation rate of water.
5.2. Local flow structure within segregative patterns
Following the understanding of the growth dynamics of the phase segregation of 1,2-hexanediol, we further conducted a direct measurement of the local flow structure within the segregative patterns, in order to better understand the observed radial flow reversal at Stage II.
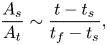
We utilized the water-soluble dye Dextran as ‘tracer’ to realize the flow visualization in those regions. The dye is originally dissolved in the mixture system but then separates from the droplet together with 1,2-hexanediol at the contact line due to the preferential evaporation of water there. Some of the separated Dextran attaches on the solid surface, causing pinning of the contact line. Some other Dextran is transported into the 1,2-hexanediol phase by the local flow (see figure 5a). Because of its insolubility in 1,2-hexanediol, Dextran aggregates as small clusters in the segregated phase, which then play the role as tracer particles (see figure 5a). By extracting the fluorescent signal of Dextran, we can visualize the trajectories of these tracers, which are indicative of the flow in the arches. We average the intensity of 30 consecutive images to illustrate qualitatively the flow structure within the arches, as shown in figures 5(a2–a4).
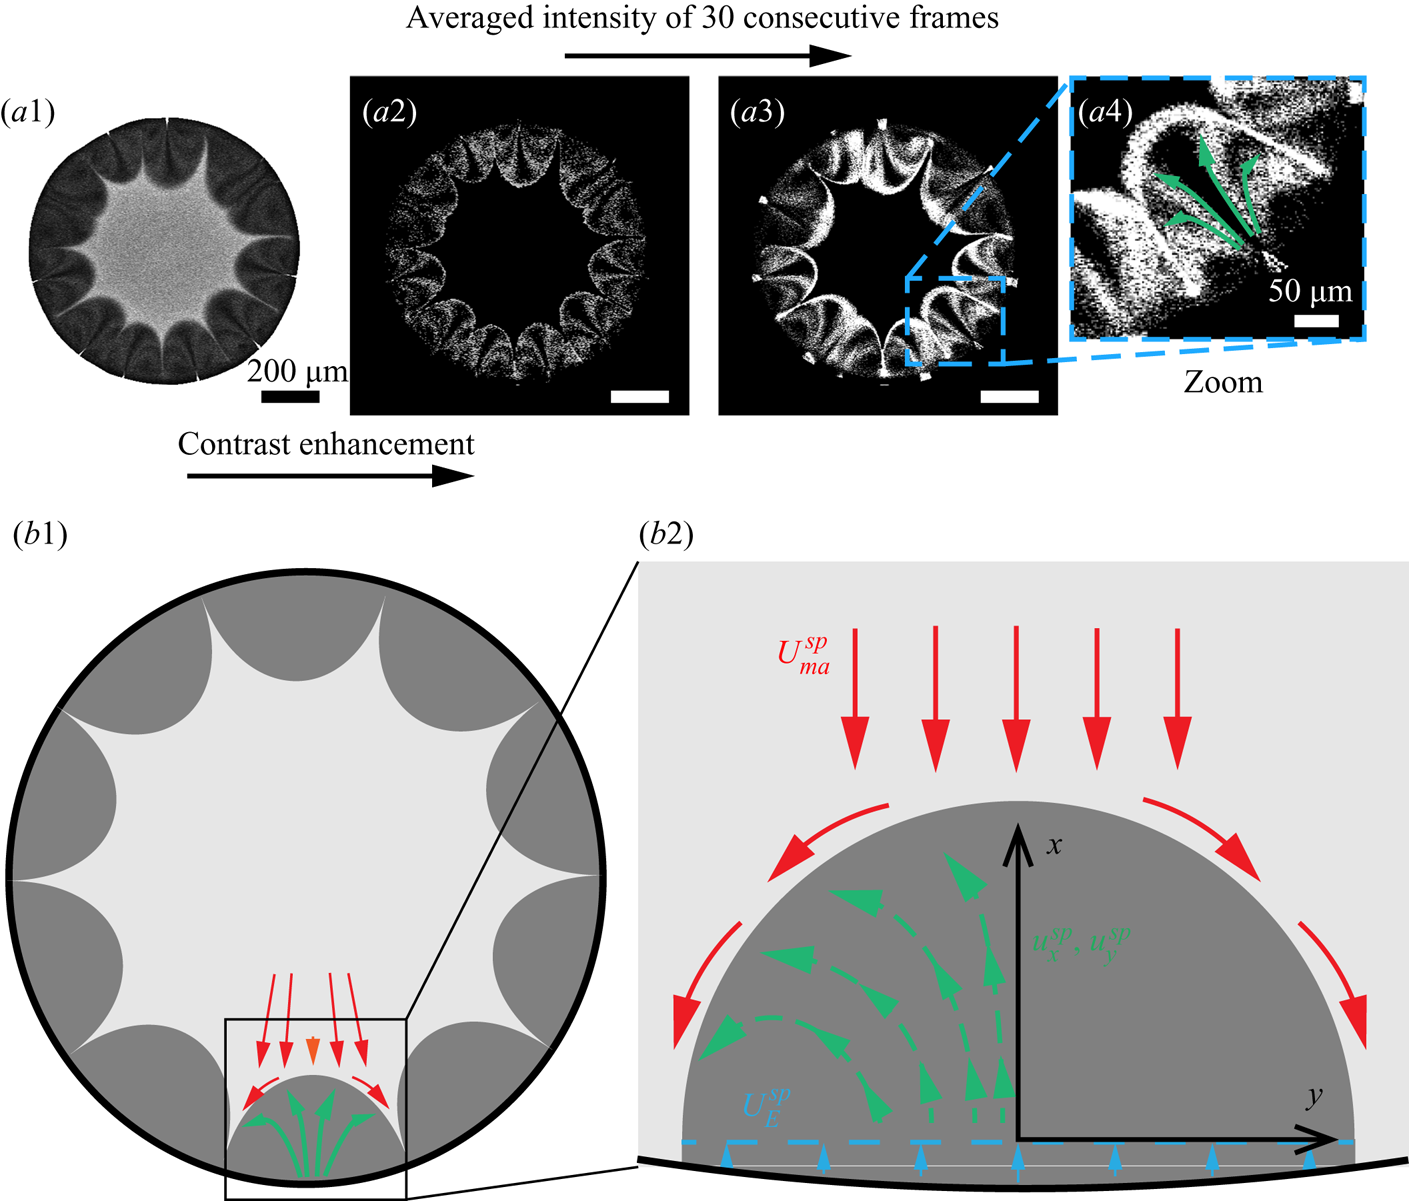
Figure 5. Flow structure within the segregated phase patterns. (a1) The fluorescent signal at the focal plane near the substrate. (a2) The fluorescent signal of Dextran within segregative phase patterns. (a3) Contrast-enhanced image by averaging the intensity of 30 consecutive frames. (a4) A zoom-in image of the signal within one of the patterns. (b1–b2) Schematics of the flow structure within a segregative pattern.
From the figures, we see that the flow structure inside the arch-like patterns consists of two counter-rotating convective rolls originating from the periphery of the binary droplet, which is indicated by the green arrows in figure 5(a4). It is reminiscent of the convective rolls inside the arch-shaped patterns observed in an evaporative ethanol–water binary system confined in a Hele-Shaw cell, which is driven by a Marangoni instability caused by the gradient of ethanol at the interface (Linde, Pfaff & Zirkel Reference Linde, Pfaff and Zirkel1964; de la Cruz et al. Reference de la Cruz, Diddens, Zhang and Lohse2021). However, in our case, the generation of the convective rolls follows a different route. It is shown schematically in figures 5(b1–b2) that the expansion of the arches induces the flow originating from the edge towards the tip of the arches; then it encounters the outward radial flow outside the arches (indicated by red and orange arrows; figure 5b1), and recirculates backwards to the edge. Note that the flow differs both from capillary flows caused by a pinned contact line and from Marangoni flows driven by surface tension gradients; instead, remarkably, it is driven by the growth of the segregative patterns.
To confirm quantitatively that the radial flow is driven mainly by the growing phase segregation, we first performed  $\mu$PIV within the segregative patterns by utilizing the demixing Dextran as
  $\mu$PIV ‘tracers’. A typical snapshot of the flow field within the segregative patterns is shown in figures 6(a1–a2). A proper
  $\mu$PIV analysis is possible only after the segregation reaches a certain size, so that the area of each pattern is 3–4 times larger than the interrogation window size.
Figure 6. (a1–a2) Experimental results of the flow field within the arch-shaped patterns. The colour map displays the vorticity (a1) and radial velocity (a2). (b1–b2) Analytical prediction of the flow field within one segregative pattern with respect to figures 5(b1–b2).
We argue that the flow structure within every individual arch-shaped pattern is induced by the expansion of the segregation and its interaction with the surrounding flow. Due to the relative flatness of the droplet ( $h/R \ll 1$), we consider the system in a 2-D planar geometry, that is, the 2-D incompressible flow is predominant in our system (Ryu et al. Reference Ryu, Kim, Park and Kim2021). To obtain an analytically solvable model, a few assumptions are taken to simplify the system. (i) Every individual segregative pattern is simplified as a half-circular domain by neglecting the curvature at the contact line. (ii) For the small time scale in which the patterns remain considerably the same shape, the mass conservation holds in the half-circular domain that is pushed towards the interior of the droplet by the growing segregation at the contact line region with the velocity
  $U^{sp}_E \approx 50\ \mathrm {\mu }{\rm m}\ {\rm s}^{-1}$. (iii) The coalescence between neighbouring patterns is not considered. We then obtain the theoretical flow velocity
  $(u^{sp}_x, u^{sp}_y)$ within the segregative region (
 $x\leqslant R_{sp}$,
  $|y|\leqslant R_{sp}$,
 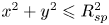 $x^2+y^2 \leqslant R_{sp}^2$) in Cartesian coordinates
  $(x,y)$ in the laboratory frame of reference, as shown in figure 5(b2) (for more details, see supplementary materials available at https://doi.org/10.1017/jfm.2022.614):
 \begin{gather} u^{sp}_x = \left(1-\frac{x^2+3y^2}{R_{sp}^2}\right)(U^{sp}_{ma}+U^{sp}_E)+U^{sp}_E, \end{gather}
 \begin{gather}u^{sp}_y = \frac{2xy}{R^2_{sp}}\,(U^{sp}_{ma}+U^{sp}_E), \end{gather}
where  $U^{sp}_{ma} \approx 20\ \mathrm {\mu }{\rm m}\ {\rm s}^{-1}$ is the velocity of the convective flow induced by Marangoni effect, and
  $R_{sp}$ is the radius of the segregative pattern. Figures 6(b1–b2) show a representative local flow structure within the segregative pattern described theoretically by (5.5) and (5.6).
The comparison between the experimental results (figures 6a1–a2) and the analytical predictions by (5.5) and (5.6) (figures 6b1–b2) shows good agreement of vorticity and velocity fields within the segregative patterns. It indicates that the inward flow structure (flow reversal) at the contact line region is induced by the expansion of the segregative patterns, and the two counter-rotating circulations are caused by the interaction between the expansion of the segregation and its surrounding outward flow.
6. Stage III: decay of flow intensity
When the segregated 1,2-hexanediol phase evolves to an almost full occupation of the entire droplet (see figure 4a5), the evaporation process enters its final Stage III, which is characterized by the decay of the flow intensity. In this section, we study quantitatively the decay of the flow intensity by the spatially averaged vorticity. A similar decrease of the magnitude of vorticity has been observed within the flow transition in an evaporating ethanol–water binary droplet (Christy et al. Reference Christy, Hamamoto and Sefiane2011; Bennacer & Sefiane Reference Bennacer and Sefiane2014; Diddens et al. Reference Diddens, Tan, Lv, Versluis, Kuerten, Zhang and Lohse2017). The transition in that flow occurs at the period when the ethanol is almost depleted by evaporation.
In our 1,2-hexanediol–water droplet, we notice that the start of the decay of the mean vorticity  $\left \langle w(t)\right \rangle$ corresponds to the moment when the convective cells disappear. After that, the contact area still shrinks slightly, reflecting that the contact angle recovers from the dynamic receding angle to the final equilibrium angle (Li et al. Reference Li, Lv, Diddens, Tan, Wijshoff, Versluis and Lohse2018). We argue that at this stage, there is still some water entrapped in the residue of the droplet, which causes a weak surface tension gradient at the liquid–air interface, which drives some solute Marangoni flow. We estimate the Marangoni number
  $Ma = (\Delta \gamma \,R)/(\mu D_{w,h}) \approx 10^{2}$, with the diffusion coefficient
  $D_{w,h} \approx 10^{-10}\ {\rm m}^2\ {\rm s}^{-1}$ for water in 1,2-hexanediol, the dynamic viscosity
 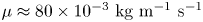 $\mu \approx 80 \times 10^{-3}\ {\rm kg}\ {\rm m}^{-1}\ {\rm s}^{-1}$, and the surface tension difference
  $\Delta \gamma \approx 10\ \mathrm {\mu }{\rm N}\ {\rm m}^{-1}$. Here,
  $\Delta \gamma$ is estimated from the numerical simulation in our previous work (Li et al. Reference Li, Lv, Diddens, Tan, Wijshoff, Versluis and Lohse2018), which shows that in the late stage of evaporation, the variance of mass concentration of 1,2-hexanediol along the droplet surface has order
  ${\sim }1\,\%$. It corresponds to a surface tension variance
  $\Delta \gamma \sim 10\ \mathrm {\mu }{\rm N}\ {\rm m}^{-1}$ (Romero et al. Reference Romero, Páez, Miranda, Hernández and Oviedo2007). Furthermore, the Rayleigh number in our case is
 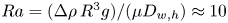 $Ra = (\Delta \rho \,R^3g)/(\mu D_{w,h}) \approx 10$, with density difference
 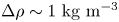 $\Delta \rho \sim 1\ {\rm kg}\ {\rm m}^{-3}$, and gravitational acceleration
  $g = 9.8$ m s
 $^{-2}$. Therefore, given these estimations of
  $Ma$ and
  $Ra$, the Marangoni convection is stronger than the Rayleigh convection in this life stage (Diddens et al. Reference Diddens, Li and Lohse2021); see the inset of figure 7(b).

Figure 7. Temporal evolution of the normalized vorticity within an evaporating 1,2-hexanediol–water droplet at the focal plane near the substrate. The blue dots represent the experimental measurement, and the red line shows the analytical prediction from (6.5) for the late phase, with  $h_0 \approx 80\ \mathrm {\mu }{\rm m}$, and dynamics viscosity
  $\mu = 80\times 10^{-3}\ {\rm kg}\ {\rm m}^{-1}\ {\rm s}^{-1}$. The time
  $t^* = 0$ s indicates the start of the vortex decay. (a) The measured temporal spatially averaged vorticity
  $\left \langle \omega \right \rangle$ normalized by the value
  $\left \langle \omega _0 \right \rangle$ at the beginning of the decay (
 $t^* = 0$) for the whole drying process. (b) The same measured dataset in Stage III. The inset shows the prediction by Diddens et al. (Reference Diddens, Li and Lohse2021). The dark green square at
  $Ma = 10^2$,
  $Ra = 10^1$ indicates a typical experimental data point of this work, which clearly lies in the Marangoni-flow-dominant regime, as do all data points of this work.
The out-of-equilibrium state is generated by the non-uniform concentration distribution. The dynamic mixing can be described by the general advection–diffusion equation  $\partial _tC=\boldsymbol {\nabla }\boldsymbol {\cdot }(D\,\boldsymbol {\nabla } C)-\boldsymbol {\nabla }\boldsymbol {\cdot }(\boldsymbol {u}C) + S$, where
  $S$ describes the source term. In this late stage of the evaporation process, we neglect the source term
  $S$, take the diffusion coefficient
  $D$ as constant, and describe the velocity field as an incompressible flow that has zero divergence (i.e.
  $\boldsymbol {\nabla }\boldsymbol {\cdot }\boldsymbol {u} = 0$). Then the formula simplifies to
  $\partial _tC=\boldsymbol {\nabla }\boldsymbol {\cdot }(D\,\boldsymbol {\nabla } C)-\boldsymbol {u} \boldsymbol {\cdot }\boldsymbol {\nabla } C$. With the typical velocity
  $U \approx 10^{-5}\ {\rm m}\ {\rm s}^{-1}$, the Péclet number can be estimated by
  $Pe = UR/D_{w,h} \approx 10$, which reflects the dominating role of advection as compared to diffusion in this case. In order to capture the scales of both sides of the equation at leading order, we further neglect the diffusion term, hence
 \begin{equation} \partial_t C \sim{-}\boldsymbol{u}\boldsymbol{\cdot}\boldsymbol{\nabla} C. \end{equation}
 The typical flow velocity  $\boldsymbol {u}$ is characterized by the velocity at the liquid–air interface driven by the surface tension gradient. It is expected to have magnitude
 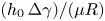 $(h_0\,\Delta \gamma )/(\mu R)$ (Kim et al. Reference Kim, Boulogne, Um, Jacobi, Button and Stone2016) throughout the droplet, where
  $h_0$ is the height of the droplet. We then take the spatial derivative of both sides of (6.1):
 \begin{equation} \partial_t(\boldsymbol{\nabla} C) \sim{-}\frac{h_0}{\mu}\,\frac{\Delta \gamma}{R}\boldsymbol{\cdot} \boldsymbol{\nabla}(\boldsymbol{\nabla} C). \end{equation}
 The local concentration gradient  $\boldsymbol {\nabla } C$ induces the surface tension gradient, which results in a local shear stress
  $\tau \sim \boldsymbol {\nabla } \gamma \sim \boldsymbol {\nabla } C\boldsymbol {\cdot }\partial _c\gamma$. The vorticity perpendicular to the image plane is induced by the local stress
  $\omega _z \propto \tau$, which is defined as the curl of the in-plane velocity
  $(u_x, u_y)$, i.e.
  $\omega _z = |\boldsymbol {\nabla } \times {\boldsymbol {u}}|_z = |\partial _x u_y - \partial _y u_x|$. Here, we consider only the vorticity perpendicular to the image plane
  $\omega _z$, which is dominant over the other two components due to the low contact angle of the droplet. We hence argue that a scaling relation
  $\omega _z \propto \boldsymbol {\nabla } C$ holds (Christy et al. Reference Christy, Hamamoto and Sefiane2011). By replacing
  $\boldsymbol {\nabla } C$ with
  $\omega _z$, we then obtain the scaling relation
 \begin{equation} \frac{\partial\omega_z}{\partial t} \sim{-}\frac{h_0}{\mu}\,\frac{\Delta \gamma}{R}\boldsymbol{\cdot}\boldsymbol{\nabla}\omega_z \sim{-}\frac{h_0}{\mu}\,\frac{\Delta \gamma}{R}\,\frac{\omega_z}{R}, \end{equation}
implying
 \begin{equation} \frac{{\rm d}\omega_z}{\omega_z} \sim{-}\frac{h_0\,\Delta\gamma}{\mu R^2}\,{\rm d}t. \end{equation}
By taking the vorticity  $\omega _0$ at the beginning moment
  $t_d$ of the decay as the initial condition, integration in time gives an exponential decaying of the vorticity,
 \begin{equation} \omega \sim \omega_0\exp\left(-\frac{h_0\,\Delta \gamma}{\mu R^2}\,t^*\right), \end{equation}
with  $t^* = t-t_d$.
Figure 7 shows good agreement between the analytical prediction and the measurement of the normalized mean vortex  $\left \langle \omega \right \rangle /\left \langle \omega _0 \right \rangle$ during decay. Note that beyond 10 s after the start of the decay, the vorticity experiences a more rapid decay than predicted by our model. At this late stage of decaying, the flow velocity
  $U$ decreases to less than
  $10^{-6}\ {\rm m}\ {\rm s}^{-1}$, which corresponds to
  $Pe < 1$. Besides the convection, the mutual diffusion also plays a significant role in the dynamical mixing to homogenize the concentration gradient. Hence the intensity of the flow decays faster than the prediction by the model, which considers only the convective mixing. The solution indicates that the decay of vorticity is due mainly to the mixing effect by the surface tension gradient, and the viscosity delays the mixing process by slowing down the convective flow.
7. Concluding remarks and discussion
In summary, we have studied the physicochemical hydrodynamics of an evaporating 1,2-hexanediol–water binary droplet on a flat substrate, in which the preferential evaporation of water leads to the segregation of 1,2-hexanediol. We characterize quantitatively the evolution of convective flow structures, and identify three successive life stages by flow transitions, namely Stages I, II and III. Stage I is defined as the period before the segregation occurs. The flow is controlled mainly by the Marangoni effect caused by the surface tension gradient induced by selective evaporation. At Stage II, a radial flow reversal originating from the contact line area is observed with the emergence of the segregation. We show that the growth rate of the segregative patterns is controlled by the depletion of water due to evaporation. Then we visualize the flow structure within the segregative arch-shaped patterns and interpret that the inward radial flow is induced remarkably by the growth of the segregative patterns. At the late Stage III of the evaporation, i.e. when the non-volatile segregative phase almost fully occupies the entire droplet, a vortex decay is observed, and the distribution of the entrapped water is homogenized by the Marangoni effect, which is again caused by the surface tension gradient. In contrast, the viscosity delays the mixing effect. Generally, the flow structures undergo transitions from surface-tension-driven to segregation-driven and again to surface-tension-driven states, which shows clearly the richness of the hydrodynamics induced by the segregative behaviour.
This work still requires further investigations of the various processes. The complex flow structure (e.g. the convective cells) in the entire droplet is 3-D, but our present observations have been limited to a 2-D focal plane at the bottom of the droplet only. In order to understand comprehensively the flow behaviour, either an experimental or a numerical technique that is able to reconstruct a complete 3-D flow field is required.
Supplementary material and movie
Supplementary material and a movie are available at https://doi.org/10.1017/jfm.2022.614.
Funding
This work is part of an Industrial Partnership Programme (IPP) of the Netherlands Organization for Scientific Research (NWO). This research programme is co-financed by Canon Production Printing Holding B.V., University of Twente and Eindhoven University of Technology. D.L. gratefully acknowledges support by his ERC-Advanced Grant DDD (project no. 740479).
Declaration of interests
The authors report no conflict of interest.


 Open access