In 2014, the WHO reported that 38 % of men and 40 % of women were classified as overweight and 11 % of men and 15 % of women were classified as obese, with prevalence of both trending upwards (1) . Total alcohol per capita consumption also increased from 2005 to 2010 and predicted an upward trajectory (2) . With an energy density of 29 kJ/g, second only to dietary fat, it is logical to hypothesise that in those who voluntarily consume alcoholic beverages, this will contribute to their overall energy intakeReference Traversy and Chaput (3) . However, the relationship between alcoholic beverage consumption and overweight and obesity is complex and inconsistentReference Traversy and Chaput (3) . Alcohol type, habitual consumption patterns and sex are factors that may mediate the relationship between alcohol consumption and body weight. Evidence suggests that type of alcoholic beverage is important; for example, wine has been shown to be more protective against weight gain than beer and spirits in observational studiesReference Sayon-Orea, Martinez-Gonzalez and Bes-Rastrollo (4) . In women, mild to moderate alcohol consumption is associated with lower weight, whereas in men, moderate intake was associated with higher weightReference Sayon-Orea, Martinez-Gonzalez and Bes-Rastrollo (4) . Bendsen et al. Reference Bendsen, Christensen and Bartels (5) reviewed thirty-five observational studies on the association between beer consumption and general obesity. A positive association or no association between beer consumption and general obesity was observed in men, whereas an inverse association or no association with general obesity was observed in womenReference Bendsen, Christensen and Bartels (5) . Analyses conducted on the 2008–2014 Healthy Survey for England and the Scottish Health Survey found that in both male and female young adults, those consuming the highest levels of alcohol on a single drinking session were more likely to be overweight or obese compared with those with the lowest intakeReference Albani, Bradley and Wrieden (6) .
Aside from alcohol type and sex differences, it has been suggested a dose-dependent response exists as ‘heavy’ alcohol drinking, defined as greater than two to three standard drinks per d, was more positively associated with increased body weight compared with low to moderate alcohol drinkingReference Sayon-Orea, Martinez-Gonzalez and Bes-Rastrollo (4) . Across all WHO regions in 2014, the prevalence of heavy episodic drinking in people aged 15 years and over was 12·3 and 2·9 % for males and females, respectively (2) . To add further complexity, a J-shaped association between alcohol consumption and negative health outcomes has been reported, with low to moderate alcohol consumption correlated with reduced risk of multiple cardiovascular outcomes; whereas high alcohol consumption is correlated with increased risk of oral, pharyngeal and oesophageal cancersReference Bagnardi, Rota and Botteri (7 , Reference Ronksley, Brien and Turner 8) .
Alcohol consumption has been suggested to stimulate appetite and potentially increase food intake. Although the mechanisms are unclear, it has been postulated that ingestion of alcohol appears to bypass the satiety mechanisms that modulate short term food intakeReference Yeomans, Caton and Hetherington (9) . Alcohol has been proposed to support an overall increase in food intake in two different pathways: (1) binding to type-A gamma-aminobutyric acid (GABAA) receptors and stimulating the release of opioid and (2) decreasing the serotonin response, a hunger suppresserReference Traversy and Chaput (3 , Reference Yeomans, Caton and Hetherington 9) . Alcoholic beverages may contribute to passive overconsumption of energy from foods. The relatively high energy density of alcoholic beverages may be additive to food energy intake, meaning it may be easier to unintentionally consume excess dietary energyReference Yeomans, Caton and Hetherington (9 , Reference Yeomans 10) .
Studies consistently demonstrate that energy gained through the consumption of alcoholic beverages is not compensated for by eating less food in the short-termReference Yeomans (10 – Reference Poppitt, Eckhardt and McGonagle 12) . Energy compensation involves the modification of energy intake in response to previous consumption of either food or beverage and is fundamental for regulating energy balanceReference Almiron-Roig, Palla and Guest (13 , Reference Blundell, de Graaf and Hulshof 14) . Energy compensation in response to consumption of beverages is generally poor, particularly when compared with energy compensation in response to consumption of semi-solid or solid foodReference Almiron-Roig, Palla and Guest (13) . A combination of increased appetite and poor compensation of energy from alcohol could contribute to the impact on energy intake in regular consumers of alcoholic beverages.
The effects of alcohol consumption on food intake have been reviewed before 2012Reference Yeomans, Caton and Hetherington (9 , Reference Yeomans 10 , Reference Yeomans 15 – Reference Gee 17) . Three narrative reviewsReference Yeomans, Caton and Hetherington (9 , Reference Yeomans 10 , Reference Yeomans 15) suggested that alcohol consumption increases acute food intake, and a meta-analysisReference Chapman, Benedict and Brooks (16) concluded that alcohol consumption increased the total energy intake. A minireviewReference Gee (17) with limited scope further supported that alcohol consumption increased food energy intake, however, only at high alcohol doses and cautioned the findings due to the small sample sizes of the included studiesReference Griffiths (18) . No extensive systematic review with meta-analysis has been previously conducted to investigate the effects of alcohol consumption on both food energy intake and total energy intake in adult humans.
Hence, the aim of this review was to determine the impact of alcohol consumption on (1) food energy intake and (2) total energy intake (the sum of both the beverage and food consumption). This review aimed to elicit a stronger understanding of whether there is a dose response to alcohol consumption that impacts energy intake or whether other factors, such as the energy content of the comparator beverage, is important.
Methods
A systematic review with meta-analysis of aggregate data was reported in accordance with the Preferred Reporting Items for Systematic Reviews and Meta-Analyses guidelinesReference Moher, Liberati and Tetzlaff (19) . A review protocol does not exist.
Eligibility criteria
The participant, intervention, comparator, outcome, study design was used to develop eligibility criteria for study inclusion (Table 1). Original peer-reviewed randomised controlled trials (RCT), randomised crossover or non-randomised crossover trials only were eligible for inclusion.
Table 1 Participant, intervention, comparator, outcome, study design, inclusion and exclusion criteria used to determine study eligibility
Search strategy
A systematic search was conducted for studies comparing alcohol consumption against a non-alcoholic comparator on ad libitum food energy intake in healthy adult participants (≥18 years of age) with no date limits and all papers up to 1st February 2018 were included. A database search was conducted of CINAHL Plus, Embase, Medline and PsycINFO by one author (A. K.). A proximal search strategy was employed, linking the terms or variations of ‘alcohol drinking’, ‘alcoholic beverages’, ‘beer’, ‘wine’, ‘spirits’, ‘food intake’, ‘energy intake’, ‘eating behaviour’, ‘appetite’ and ‘satiety’. Table 2 provides the Ovid Medline search strategy. Limits were applied to exclude non-English-language articles and animal studies.
Table 2 Full search strategy for Ovid Medline
Literature screening
All retrieved articles were independently assessed for inclusion by two authors (A. K. and G. P.) after duplicates were removed electronically. Endnote X7 (Clarivate Analytics) was used to store all the references, and Covidence (Covidence) was used to screen articles for eligibility. Studies were excluded on the basis of title and abstract. Full-text articles were then obtained and assessed for eligibility independently by two authors. A third author (H. T.) was consulted for any discrepancies.
Data extraction
Data extraction for each eligible study was conducted independently by two authors (A. K. and G. P.) using a specifically developed standardised data extraction tool, which included publication details, study design, study procedures and classification of hierarchy of evidence according to the National Health and Medical Research Council guidelines (20) . Sample size and participant characteristics were extracted including age, sex, baseline BMI, usual alcohol consumption and degree of restrained eating. Specific to alcohol, details of the dose, type of alcoholic beverage, volume and the non-alcoholic comparator were recorded. Non-alcoholic comparators used in the included studies were coded into three groups: (1) beverages that contained no or negligible energy (NE-beverage), (2) no beverage (N-beverage) and (3) energy-containing beverages (E-beverage). The timing of the alcohol and comparator beverage provision relative to the consumption of the food was recorded along with compliance measures, time to follow-up, potential study bias and funding sources. Outcome measures for both the alcoholic and non-alcoholic beverage comparators included differences in food energy intake (kJ), total energy intake (kJ) or food mass (g) consumed. Total energy intake was defined as the sum of food energy intake and beverage energy intake. Body weight change was also recorded where reported. For each measure, the mean and either the standard deviation or the standard error of the mean were recorded where reported as well as corresponding P values between the intervention and comparator groups. All data extraction were completed on Microsoft Excel 2013 (Microsoft). Any disparities in the data extracted were discussed between the two authors (A. K. and G. P.). A third author (H. T.) was consulted with unresolved discrepancies. Authors were contacted in an attempt to retrieve missing data. A total of twenty-two requests for data were sent to authors, with a response rate of 45 % (ten requests). However, of the ten respondents, four did not have access or no longer held these data.
Risk of bias and quality
Study quality and risk of bias were independently assessed by two authors (A. K. and G. P.) using the Effective Public Health Practice Project (EPHPP) quality assessment tool for quantitative studiesReference Thomas, Ciliska and Dobbins (21) . The EPHPP quality assessment tool for quantitative studies was chosen as this systematic review included non-randomised quantitative studies. Each paper was rated as strong, moderate or weak. Any discrepancies were dealt with by consensus discussion with the third author (H. T.).
Statistical analysis
To analyse the impact of alcohol dose on food energy intake via meta-analyses, the alcohol dose from the alcoholic beverage intervention was categorised into either low (<30 g or <0·6 g/kg) or high dose (≥30 g or ≥0·6 g/kg). As different countries have different guidelines for low-risk drinking, a fixed alcohol dose of 30 g was used to define low and high alcohol doses based on the Australian National Guidelines for Alcohol ConsumptionReference Kalinowski and Humphreys (22 , 23) . An alcohol dose of 30 g is the midpoint between low-risk drinking per d (20 g) and the maximum dose to reduce the risk of alcohol-related injury from a single occasion (40 g) in both males and females (23) . An adjusted alcohol dose of 0·6 g/kg of body weight was considered as a priming dose for increasing alcohol consumption and potentially increasing food consumptionReference Rose, Hardman and Christiansen (24 , Reference Rose and Duka 25) .
We conducted combined analyses of food energy intake and total energy intake, where reported or provided by authors, and sub-group analyses of comparator type (NE-beverage, N-beverage and E-beverage comparators) and alcohol dose. Groups were combined for pairwise comparisons where required. The mean difference and standard error of the mean difference from each study was used to analyse data. For randomised crossover trials and non-randomised crossover trials, a correlation coefficient of 0·5 was used to impute the standard error of the mean difference in food energy intake and total energy intake, if not reported in the publication or provided by the authors. Sensitivity analysis was conducted using correlation coefficients of 0·2 and 0·8. Heterogeneity was assessed using the Q statistic, and its P value and inconsistency were assessed using an extension of the Q statistic, the I 2 statistic. Values of P<0·10 or values of I 2 >50 % suggested substantial heterogeneity. Given the diversity in clinical characteristics across studies, and our aim to estimate the average (rather than common) effect across studies, we used a random-effects model in all meta-analyses and sub-group analyses. For our primary analyses, we used the between-study variance estimator developed by DerSimonian & LairdReference DerSimonian and Laird (26) and calculated the Wald-type normal distribution CI. We also performed a sensitivity analysis using the Hartung–Knapp–Sidik–Jonkman (HKSJ) method for random-effects meta-analysesReference IntHout, Ioannidis and Borm (27) . Both a qualitative (funnel plot) and a quantitative (Egger’s regression test) approach were used to examine the potential small-study effects, the tendency for smaller studies to have systematically different results when compared with larger studies. An influence analysis was conducted using the random-effects model (DerSimonian and Laird) to determine the effect of removing each included study on the overall effect and 95 % CI. The meta-analyses, funnel plot and Egger’s regression test were conducted using Stata 13 software (Stata Corp.) with the metan, metafunnel and metabias packages. The influence analysis was conducted using MetaXL 5.3 (Epigear International). A P value of <0·05 for meta-analyses was considered statistically significant.
Results
Study selection and characteristics
A total of 18 427 papers were retrieved (Ovid Medline=5509, EMBASE=9480, CINAHL Plus=2259, PsycINFO=1179). One paperReference Hollister (28) reported two different studies of which both were eligible, whereas two papersReference Buemann, Toubro and Astrup (29 , Reference Tremblay and St-Pierre 30) reported two different studies with only one being eligible in each paper. In total, twenty-two separate studies met the PICOS inclusion criteria and were included (Fig. 1). The study characteristics for the twenty-two studies are provided (Table 3). Nine studiesReference Tremblay and St-Pierre (30 – Reference Polivy and Herman 38) were excluded and justification for exclusion is provided in online Supplementary Table S1.
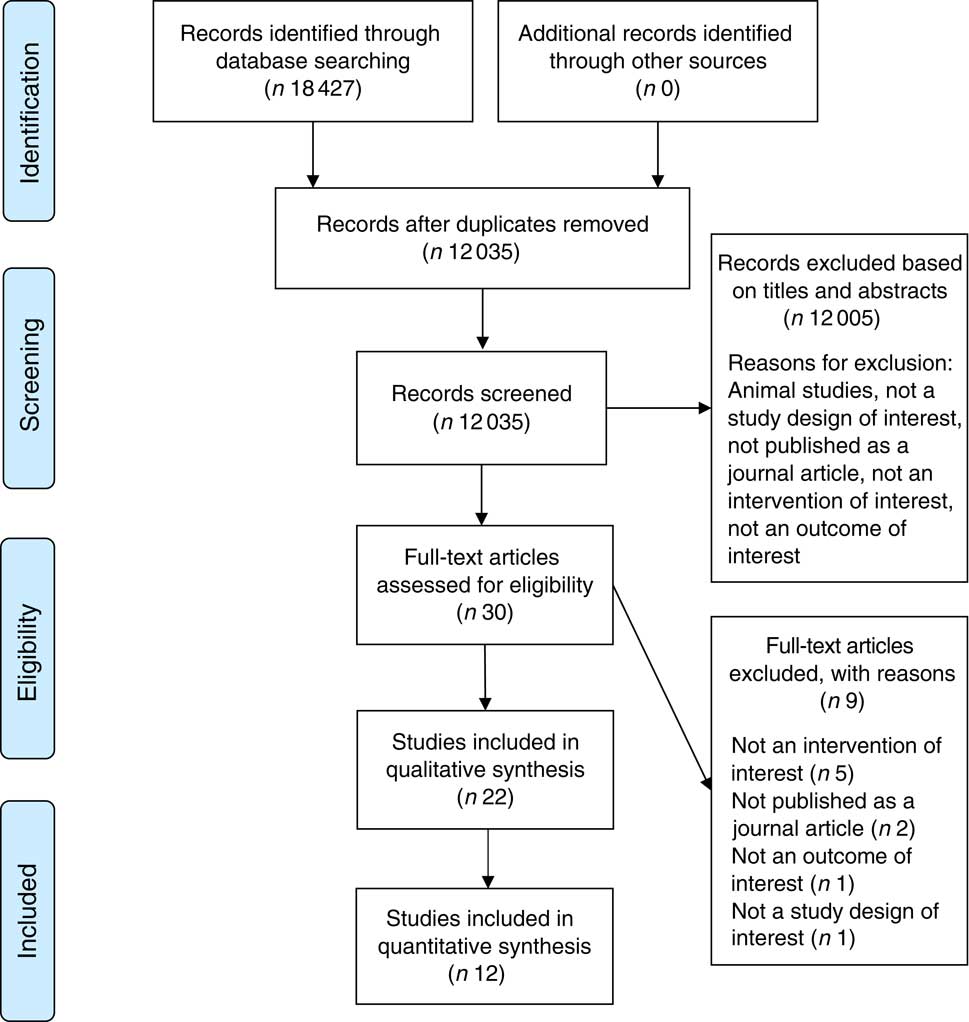
Fig. 1 Study selection flow diagram.
Table 3 Study characteristics for the twenty-two trials meeting the full inclusion criteria
RCT, randomised controlled trial; NR, not reported; OJ, orange juice.
* ml/kg of body weight.
† g/kg of body weight.
‡ Grams of beverage was reported.
Study design
Thirteen studiesReference Poppitt, Eckhardt and McGonagle (12 , Reference Hollister 28 , Reference Buemann, Toubro and Astrup 29 , Reference Caton, Ball and Ahern 39 – Reference Caton, Bate and Hetherington 41 , Reference Hetherington, Cameron and Wallis 45 , Reference Mattes 47 , Reference Schrieks, Stafleu and Griffioen-Roose 49 – Reference Westerterp-Plantenga and Verwegen 51 – Reference Yeomans 54) employed a randomised crossover trial design, four utilisedReference Rose, Hardman and Christiansen (24 , Reference Christiansen, Abigail and Randall-Smith 42 , Reference Hofmann and Friese 46 , Reference Ouwens, van Strien and van der Staak 48) a randomised parallel trial design and five, a non-randomised crossover trial designReference Foltin, Kelly and Fischman (11 , Reference Cordain, Bryan and Melby 43 , Reference Cordain, Melby and Hamamoto 44 , Reference Yeomans, Hails and Nesic 52 , Reference Yeomans and Phillips 53) .
Sixteen studiesReference Poppitt, Eckhardt and McGonagle 12 , Reference Rose, Hardman and Christiansen 24 , Reference Hollister 28 , Reference Caton, Ball and Ahern 39 , Reference Caton, Marks and Hetherington 40 , Reference Christiansen, Abigail and Randall-Smith 42 , Reference Hetherington, Cameron and Wallis 45 – Reference Schrieks, Stafleu and Griffioen-Roose 49 , Reference Westerterp-Plantenga and Verwegen 51 – Reference Yeomans 54) utilised a pre-load paradigm design where ingestion of a beverage occurred a set period of time before the consumption of food. The time between consuming the pre-load and consuming the first test food varied between studies, from 10 minReference Hofmann and Friese (46) up to 2 hReference Hollister (28) . In all of these studies, alcohol ingestion was compared with non-alcoholic comparator conditions. Six studiesReference Poppitt, Eckhardt and McGonagle (12 , Reference Buemann, Toubro and Astrup 29 , Reference Caton, Ball and Ahern 39 – Reference Caton, Bate and Hetherington 41 , Reference Hetherington, Cameron and Wallis 45) provided a standardised control meal for participants before the start of the study, fiveReference Hollister (28 , Reference Schrieks, Stafleu and Griffioen-Roose 49 , Reference Yeomans, Hails and Nesic 52 - Reference Yeomans 54) instructed participants to consume their own ‘usual’ meal and one studyReference Hollister (28) instructed participants to fast before the testing.
Of the twenty-two studies, fifteen included an E-beverage comparatorReference Foltin, Kelly and Fischman (11 , Reference Poppitt, Eckhardt and McGonagle 12 , Reference Buemann, Toubro and Astrup 29 , Reference Caton, Ball and Ahern 39 , Reference Caton, Marks and Hetherington 40 , Reference Hetherington, Cameron and Wallis 45 – Reference Yeomans 54) , nine included an NE-beverage comparatorReference Poppitt, Eckhardt and McGonagle (12 , Reference Rose, Hardman and Christiansen 24 , Reference Hollister 28 , Reference Christiansen, Abigail and Randall-Smith 42 , Reference Mattes 47 , Reference Westerterp-Plantenga and Verwegen 51 – Reference Yeomans and Phillips 53) and four included an N-beverage comparatorReference Foltin, Kelly and Fischman (11 , Reference Caton, Bate and Hetherington 41 , Reference Hetherington, Cameron and Wallis 45 , Reference Westerterp-Plantenga and Verwegen 51) . The two longer term studiesReference Cordain, Bryan and Melby (43 , Reference Cordain, Melby and Hamamoto 44) did not specify the comparator type as participants abstained from consuming alcoholic beverages in free-living conditions. Two studies by the same authorReference Hollister (28) used NE-beverage comparators comprising diet soft drink with marijuana, dextroamphetamine sulphate or marijuana with the cannaboids removed.
The energy content of the E-beverage was important to take into account, and five studiesReference Foltin, Kelly and Fischman (11 , Reference Schrieks, Stafleu and Griffioen-Roose 49 , Reference Westerterp-Plantenga and Verwegen 51 , Reference Yeomans and Phillips 53 , Reference Yeomans 54) included an E-beverage comparator that was energy matched with the alcoholic beverage and eleven studiesReference Poppitt, Eckhardt and McGonagle (12 , Reference Buemann, Toubro and Astrup 29 , Reference Caton, Ball and Ahern 39 , Reference Caton, Marks and Hetherington 40 , Reference Hetherington, Cameron and Wallis 45 – Reference Ouwens, van Strien and van der Staak 48 , Reference Tremblay, Wouters and Wenker 50 , Reference Yeomans, Hails and Nesic 52 , Reference Yeomans 54) included a hypoenergetic E-beverage comparator, which was lower in energy content compared with the alcoholic beverage.
Participants
A total of 706 participants were in the included studies. The minimum number of participants in a study was sixReference Foltin, Kelly and Fischman (11) , while the maximum was 119Reference Ouwens, van Strien and van der Staak (48) . There were a higher proportion of female (n 424, 60 %) than male participants (n 282, 40 %). Twelve studiesReference Foltin, Kelly and Fischman (11 , Reference Hollister 28 , Reference Buemann, Toubro and Astrup 29 , Reference Caton, Ball and Ahern 39 – Reference Caton, Bate and Hetherington 41 , Reference Cordain, Bryan and Melby 43 , Reference Hetherington, Cameron and Wallis 45 , Reference Schrieks, Stafleu and Griffioen-Roose 49 , Reference Tremblay, Wouters and Wenker 50 , Reference Yeomans, Hails and Nesic 52 , Reference Yeomans and Phillips 53) recruited only male participants, and six studies recruited only female participantsReference Poppitt, Eckhardt and McGonagle (12 , Reference Christiansen, Abigail and Randall-Smith 42 , Reference Cordain, Melby and Hamamoto 44 , Reference Hofmann and Friese 46 , Reference Ouwens, van Strien and van der Staak 48 , Reference Yeomans 54) . Studies mainly recruited younger participants whose mean age ranged from 19·6Reference Christiansen, Abigail and Randall-Smith (42) to 37·0 yearsReference Poppitt, Eckhardt and McGonagle (12) . Mean body weight was reported in five studiesReference Foltin, Kelly and Fischman (11 , Reference Rose, Hardman and Christiansen 24 , Reference Cordain, Bryan and Melby 43 , Reference Cordain, Melby and Hamamoto 44 , Reference Tremblay, Wouters and Wenker 50) and it ranged from 65·4Reference Rose, Hardman and Christiansen (24) to 78·6 kgReference Cordain, Melby and Hamamoto (44) . Where reported, the mean BMIReference Poppitt, Eckhardt and McGonagle (12 , Reference Caton, Bate and Hetherington 41 , Reference Christiansen, Abigail and Randall-Smith 42 , Reference Cordain, Melby and Hamamoto 44 , Reference Hofmann and Friese 46 – Reference Tremblay, Wouters and Wenker 50 , Reference Yeomans, Hails and Nesic 52 , Reference Yeomans and Phillips 53 , Reference Yeomans 54) ranged from 20·8Reference Christiansen, Abigail and Randall-Smith (42) to 29·8 kg/m2 Reference Cordain, Melby and Hamamoto (44) . Fourteen studiesReference Foltin, Kelly and Fischman (11 , Reference Rose, Hardman and Christiansen 24 , Reference Buemann, Toubro and Astrup 29 , Reference Caton, Ball and Ahern 39 – Reference Hetherington, Cameron and Wallis 45 , Reference Mattes 47 , Reference Ouwens, van Strien and van der Staak 48 – Reference Tremblay, Wouters and Wenker 50) reported either participants’ usual alcohol consumption or participants’ specified usual alcohol consumption in their participant eligibility criteria, where the intake ranged from a minimum of 28·0 g alcohol per monthReference Cordain, Bryan and Melby (43 , Reference Cordain, Melby and Hamamoto 44) to 267·3 g alcohol per weekReference Ouwens, van Strien and van der Staak (48) .
Outcomes
Food energy intake and the total energy intake for the included studies are presented in the online Supplementary Table S2.
Food energy intake
Participants’ food energy intake was reported by twelve studiesReference Foltin, Kelly and Fischman (11 , Reference Poppitt, Eckhardt and McGonagle 12 , Reference Rose, Hardman and Christiansen 24 , Reference Hollister 28 , Reference Caton, Bate and Hetherington 41 , Reference Christiansen, Abigail and Randall-Smith 42 , Reference Hetherington, Cameron and Wallis 45 , Reference Mattes 47 , Reference Westerterp-Plantenga and Verwegen 51 – Reference Yeomans and Phillips 53) when compared with NE- or N-beverage comparator conditions. Alcohol consumption increased food energy intake in three studiesReference Caton, Bate and Hetherington (41 , Reference Christiansen, Abigail and Randall-Smith 42 , Reference Hetherington, Cameron and Wallis 45) and remained unchanged in eightReference Poppitt, Eckhardt and McGonagle (12 , Reference Rose, Hardman and Christiansen 24 , Reference Hollister 28 , Reference Mattes 47 , Reference Westerterp-Plantenga and Verwegen 51 – Reference Yeomans and Phillips 53) . One studyReference Foltin, Kelly and Fischman (11) demonstrated a dose-dependant effect, with no change in food energy intake with a low-dose alcoholic beverage, but a significant decrease with the high-dose alcoholic beverage.
Of the fifteen studiesReference Foltin, Kelly and Fischman (11 , Reference Poppitt, Eckhardt and McGonagle 12 , Reference Buemann, Toubro and Astrup 29 , Reference Caton, Ball and Ahern 39 , Reference Caton, Marks and Hetherington 40 , Reference Hetherington, Cameron and Wallis 45 – Reference Yeomans 54) that compared an alcohol dose against an E-beverage on food energy intake, sevenReference Caton, Marks and Hetherington (40 , Reference Hetherington, Cameron and Wallis 45 , Reference Hofmann and Friese 46 , Reference Schrieks, Stafleu and Griffioen-Roose 49 , Reference Westerterp-Plantenga and Verwegen 51 , Reference Yeomans and Phillips 53 , Reference Yeomans 54) reported a significant increase in food energy intake and eight studiesReference Foltin, Kelly and Fischman (11 , Reference Poppitt, Eckhardt and McGonagle 12 , Reference Buemann, Toubro and Astrup 29 , Reference Caton, Ball and Ahern 39 , Reference Mattes 47 , Reference Ouwens, van Strien and van der Staak 48 , Reference Tremblay, Wouters and Wenker 50 , Reference Yeomans, Hails and Nesic 52) reported no significant change. Of the five studiesReference Foltin, Kelly and Fischman (11 , Reference Schrieks, Stafleu and Griffioen-Roose 49 , Reference Westerterp-Plantenga and Verwegen 51 , Reference Yeomans and Phillips 53 , Reference Yeomans 54) utilising an isoenergetic non-alcoholic comparator, fourReference Schrieks, Stafleu and Griffioen-Roose (49 , Reference Westerterp-Plantenga and Verwegen 51 , Reference Yeomans and Phillips 53 , Reference Yeomans 54) showed that alcohol consumption increased food energy intake, when compared with the comparator. Of the thirteen studiesReference Foltin, Kelly and Fischman (11 , Reference Buemann, Toubro and Astrup 29 , Reference Caton, Ball and Ahern 39 , Reference Caton, Marks and Hetherington 40 , Reference Hetherington, Cameron and Wallis 45 , Reference Hofmann and Friese 46 , Reference Ouwens, van Strien and van der Staak 48 – Reference Yeomans 54) that compared a low-dose alcoholic beverage (<30 g or <0·6 g/kg) with E-beverages, seven studiesReference Caton, Marks and Hetherington (40 , Reference Hetherington, Cameron and Wallis 45 , Reference Hofmann and Friese 46 , Reference Schrieks, Stafleu and Griffioen-Roose 49 , Reference Westerterp-Plantenga and Verwegen 51 , Reference Yeomans and Phillips 53 , Reference Yeomans 54) demonstrated that food energy intake increased with consumption of a low-dose alcoholic beverage when compared with E-beverages and six studiesReference Foltin, Kelly and Fischman (11 , Reference Buemann, Toubro and Astrup 29 , Reference Caton, Ball and Ahern 39 , Reference Ouwens, van Strien and van der Staak 48 , Reference Tremblay, Wouters and Wenker 50 , Reference Yeomans, Hails and Nesic 52) showed no significant change. In contrast, of the four studiesReference Foltin, Kelly and Fischman 11 , Reference Poppitt, Eckhardt and McGonagle 12 , Reference Caton, Ball and Ahern 39 , Reference Mattes 47) that compared a high-dose alcoholic beverage (≥30 g or ≥0·6 g/kg) with E-beverages, all four studiesReference Foltin, Kelly and Fischman (11 , Reference Poppitt, Eckhardt and McGonagle 12 , Reference Caton, Ball and Ahern 39 , Reference Mattes 47) demonstrated no significant change in food energy intake.
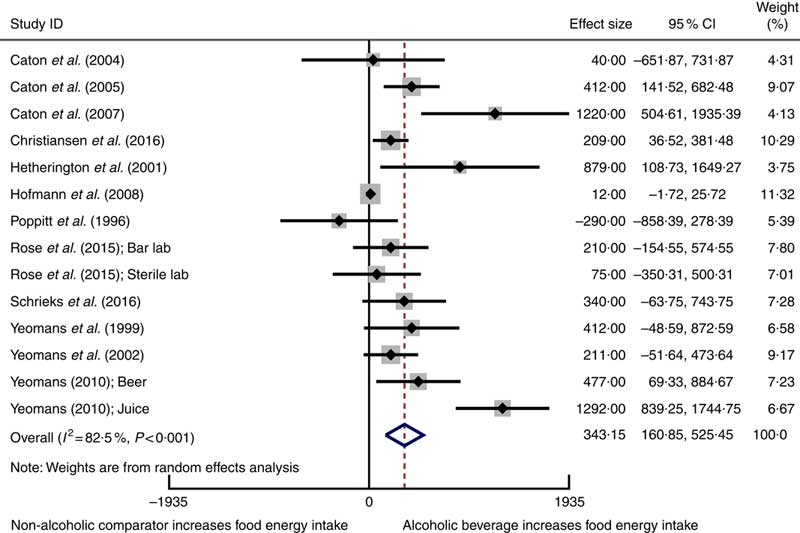
Twelve studiesReference Poppitt, Eckhardt and McGonagle (12 , Reference Rose, Hardman and Christiansen 24 , Reference Caton, Ball and Ahern 39 – Reference Christiansen, Abigail and Randall-Smith 42 , Reference Hetherington, Cameron and Wallis 45 , Reference Hofmann and Friese 46 , Reference Schrieks, Stafleu and Griffioen-Roose 49 , Reference Yeomans, Hails and Nesic 52 – Reference Yeomans 54) involving 417 participants reported mean data on food energy intake for both intervention and comparator groups enabling them to be included in a meta-analysis using a random-effects model. Alcoholic beverages resulted in statistically significant higher food energy intake compared with non-alcoholic beverage comparators (weighted mean difference 343 kJ, 95 % CI 161, 525 kJ) (Fig. 2). Statistically significant heterogeneity and a substantial amount of inconsistency were observed. Sensitivity analysis using the HKSJ methodReference IntHout, Ioannidis and Borm (27) resulted in wider CI, although this did not change our conclusion (weighted mean difference 343 kJ, 95 % CI 109, 577 kJ).
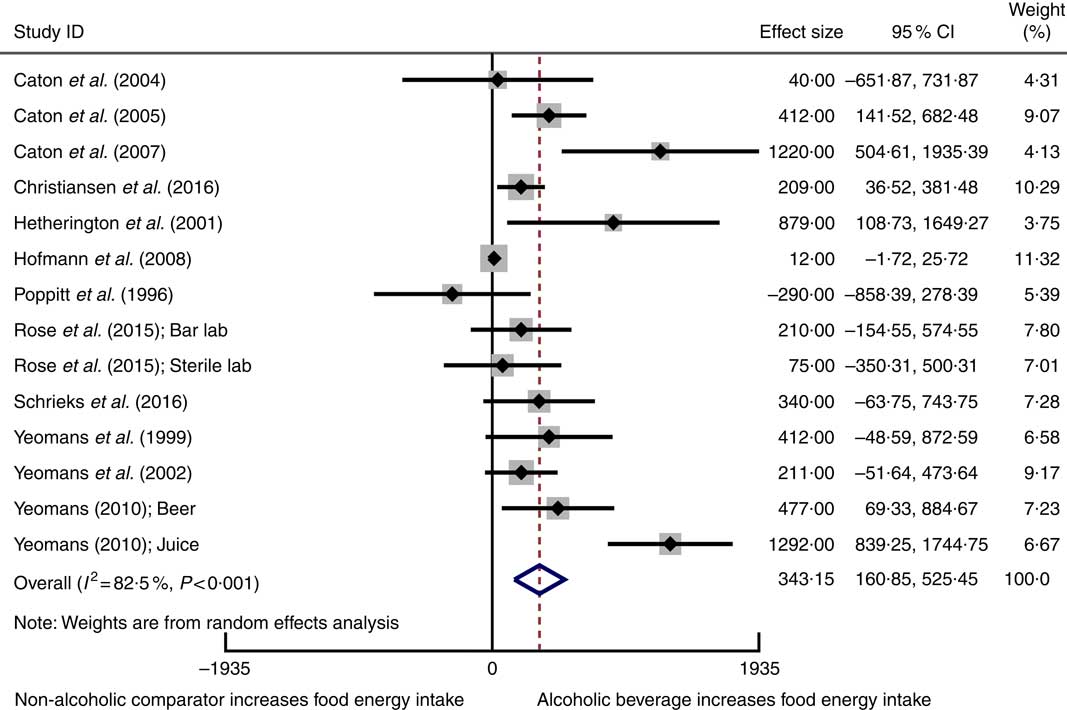
Fig. 2 Forest plot for changes in food energy intake (kJ) as a result of alcoholic beverage consumption using the random-effects model. The black squares represent the mean difference from each study, the grey squares represent the weight assigned to that study, while the left and right extremes of the squares represent the corresponding 95 % CI. The hollow diamond represents the overall pooled effects while the left and right points of the diamond represent the corresponding 95 % CI.
The asymmetrical funnel plots and Egger’s regression test suggests small-study effects may exist in the meta-analysis for food energy intake (Egger’s test: P=0·002) (online Supplementary Fig. S1). There are several possible reasons for this asymmetry, including reporting biases, or clinical and methodological heterogeneity. A sensitivity analysis conducted using correlation coefficients of 0·2 and 0·8 to estimate the standard error of the mean difference in crossover trials did not substantially change the results of the meta-analysis. The influence analysis demonstrated that removing each study one by one did not substantially alter the overall effect (online Supplementary Table S3).
Total energy intake
Total energy intake (the sum of both the beverage and food consumption) was reported in eight studiesReference Foltin, Kelly and Fischman (11 , Reference Poppitt, Eckhardt and McGonagle 12 , Reference Rose, Hardman and Christiansen 24 , Reference Caton, Bate and Hetherington 41 , Reference Christiansen, Abigail and Randall-Smith 42 , Reference Mattes 47 , Reference Westerterp-Plantenga and Verwegen 51 , Reference Yeomans and Phillips 53) that compared the alcohol dose with either an NE-beverage or an N-beverage. Seven of those studiesReference Foltin, Kelly and Fischman (11 , Reference Poppitt, Eckhardt and McGonagle 12 , Reference Rose, Hardman and Christiansen 24 , Reference Caton, Bate and Hetherington 41 , Reference Christiansen, Abigail and Randall-Smith 42 , Reference Westerterp-Plantenga and Verwegen 51 , Reference Yeomans and Phillips 53) showed a significant increase in the total energy intake with alcohol consumption, and one studyReference Mattes (47) demonstrated no change with low-dose (31·3 g alcohol) but a significant increase with high-dose (54 g alcohol) alcoholic beverages. Of the seven studies that increased the total energy intake, fiveReference Foltin, Kelly and Fischman (11 , Reference Poppitt, Eckhardt and McGonagle 12 , Reference Rose, Hardman and Christiansen 24 , Reference Caton, Bate and Hetherington 41 , Reference Christiansen, Abigail and Randall-Smith 42) utilised an alcohol dose ≥30 g or ≥0·6 g/kg.
Total energy intake was reported in nine studiesReference Foltin, Kelly and Fischman (11 , Reference Poppitt, Eckhardt and McGonagle 12 , Reference Buemann, Toubro and Astrup 29 , Reference Caton, Ball and Ahern 39 , Reference Caton, Marks and Hetherington 40 , Reference Mattes 47 , Reference Tremblay, Wouters and Wenker 50 , Reference Westerterp-Plantenga and Verwegen 51 , Reference Yeomans and Phillips 53) that compared the alcohol dose with an E-beverage. Alcohol consumption increased the total energy intake compared with E-beverages in two studiesReference Caton, Marks and Hetherington (40 , Reference Yeomans and Phillips 53) , no significant change was observed in three studiesReference Foltin, Kelly and Fischman 11 , Reference Buemann, Toubro and Astrup 29 , Reference Westerterp-Plantenga and Verwegen 51) , and both a significant increase in total energy intake and no significant change was observed in four studiesReference Poppitt, Eckhardt and McGonagle (12 , Reference Caton, Ball and Ahern 39 , Reference Mattes 47 , Reference Tremblay, Wouters and Wenker 50) .
Two separate studies conducted by Cordain et al. Reference Cordain, Bryan and Melby (43 , Reference Cordain, Melby and Hamamoto 44) did not specify the type of non-alcoholic beverage comparator as these were both long-term free-living studies, however, they reported no significant change in the total energy intake between the alcohol consumption and abstinence periods. None of the studies reported a decrease in food energy intake or total energy intake following consumption of alcohol.
Eight studiesReference Poppitt, Eckhardt and McGonagle (12 , Reference Rose, Hardman and Christiansen 24 , Reference Caton, Ball and Ahern 39 – Reference Christiansen, Abigail and Randall-Smith 42 , Reference Yeomans, Hails and Nesic 52 , Reference Yeomans and Phillips 53) involving 269 participants reported data on total energy intake and were pooled and included in the meta-analysis. Total energy intake was increased with consumption of an alcoholic beverage compared with a non-alcoholic beverage or no beverage (weighted mean difference 1072 kJ, 95 % CI 820, 1323 kJ) (Fig. 3). When compared with a non-alcoholic beverage, consumption of an alcoholic beverage resulted in an increase in total energy intake. Statistically significant heterogeneity and a substantial amount of inconsistency were observed. The 95 % CI for the meta-analysis when using the HKSJ methodReference IntHout, Ioannidis and Borm (27) were wider, although this did not alter the conclusion (weighted mean difference 1072 kJ, 95 % CI 693, 1450 kJ).
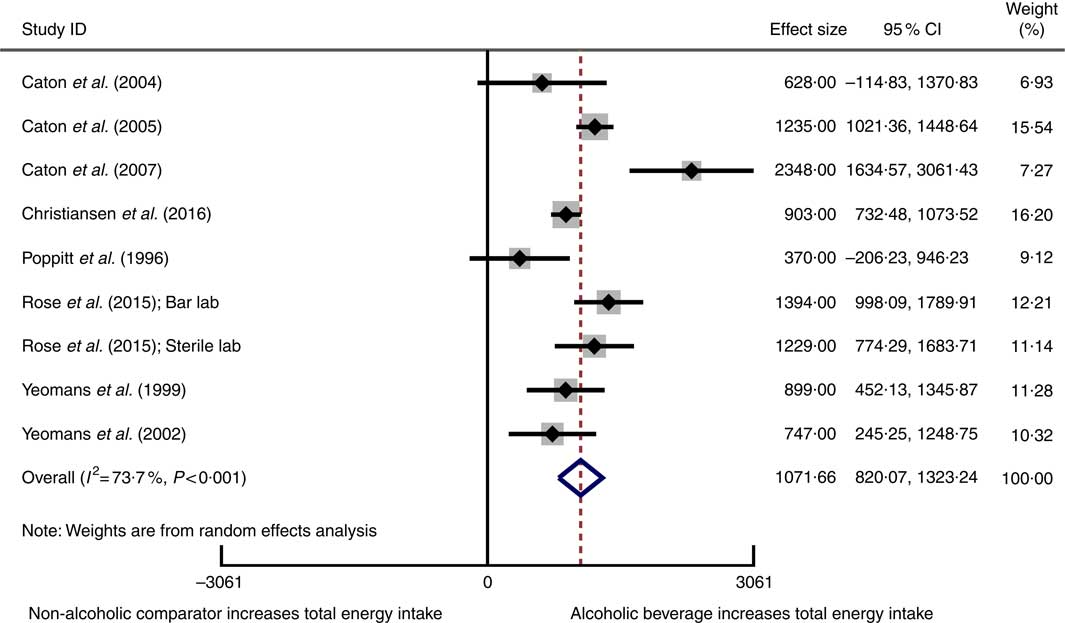
Fig. 3 Forest plot for changes in total energy intake (kJ) as a result of alcoholic beverage consumption using the random-effects model. The black squares represent the mean difference from each study, the grey squares represent the weight assigned to that study, while the left and right extremes of the squares represent the corresponding 95 % CI. The hollow diamond represents the overall pooled effects while the left and right points of the diamond represent the corresponding 95 % CI.
No evidence of small-study effects in the meta-analysis of total energy intake was observed, based on visual inspection of a funnel plot and Egger’s regression test (P=0·8) (online Supplementary Fig. S2). A sensitivity analysis conducted using correlation coefficients of 0·2 and 0·8 to estimate the standard error of the mean difference in crossover trials did not substantially change the results in the meta-analysis. The influence analysis demonstrated that removing each study one by one did not substantially alter the overall effect (online Supplementary Table S4).
Impact of comparator type, alcohol dose and sex on food energy intake and total energy intake
To explore the effects of comparator drink (NE-, N- and E-beverages), alcohol dose (defined by low and high alcohol dose) and sex (male only studies and female only studies), subgroup analyses were performed (Table 4). The subgroup analyses for comparator type indicated that alcohol consumption significantly increased food energy intake when compared with NE- and N-beverages as well as E-beverages. While food energy intake increased to a greater extent with alcohol consumption when E-beverages were compared with NE- and N-beverages, overlapping 95 % CI were observed. Alcohol consumption significantly increased the total energy intake when compared with both NE- and N-beverages and E-beverages. The total energy intake increased to a greater extent with alcohol consumption when NE- and N-beverages were compared with E-beverages; however, overlapping 95 % CI were observed. For food energy intake, both low-dose and high-dose alcohol increased food energy intake. Low-dose alcohol increased food energy intake to a greater extent compared with high-dose alcohol, although overlapping 95 % CI were observed. Both low-dose and high-dose alcohol increased the total energy intake, when compared with non-alcoholic comparators. High-dose alcohol increased to a greater extent than low-dose alcohol, although overlapping 95 % CI were observed. Subgroup analyses for sex demonstrated that with both male-only studies and female-only studies, alcohol consumption significantly increased food energy intake, when compared with non-alcoholic comparators. Food energy intake was increased to a greater extent with alcohol consumption in male-only studies when compared with female-only studies; however, overlapping 95 % CI were observed. Both male-only studies and female-only studies observed a significant increase in the total energy intake when compared with non-alcoholic comparators. Similar to food energy intake, total energy intake was increased to a greater extent with alcohol consumption in male-only studies when compared with female-only studies; however, overlapping 95 % CI were observed.
Table 4 Meta-analyses of food energy intake and total energy intake with sub-groups defined by ‘low alcohol’ and ‘high alcohol’ dose

N-beverage, no beverage; NE-beverage, beverages that contained no or negligible energy; E-beverage, energy-containing beverages.
Body weight change
Body weight change was reported in three studies which had a duration of between 13 d and 10 weeksReference Foltin, Kelly and Fischman (11 , Reference Cordain, Bryan and Melby 43 , Reference Cordain, Melby and Hamamoto 44) . Two of the studies reported no significant differences in body weight change between the alcoholic intervention period, abstention period and baselineReference Cordain, Bryan and Melby (43 , Reference Cordain, Melby and Hamamoto 44) . One study reported that weight increased significantly by a mean of 0·9(SE 0·4) kg between the first and last day, although this weight change could not be directly attributable to the consumption of a specific beverageReference Foltin, Kelly and Fischman (11) .
Quality assessment and risk of bias
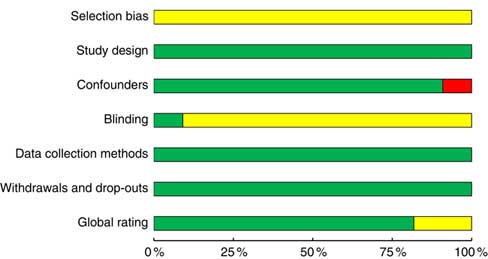
Eighteen studiesReference Foltin, Kelly and Fischman (11 , Reference Poppitt, Eckhardt and McGonagle 12 , Reference Rose, Hardman and Christiansen 24 , Reference Buemann, Toubro and Astrup 29 , Reference Caton, Ball and Ahern 39 – Reference Hetherington, Cameron and Wallis 45 , Reference Mattes 47 , Reference Schrieks, Stafleu and Griffioen-Roose 49 – Reference Yeomans 54) achieved a strong rating as defined by the EPHPP quality assessment tool, four studiesReference Hollister (28 , Reference Hofmann and Friese 46 , Reference Ouwens, van Strien and van der Staak 48) were moderate and no studies were identified as weak (Fig. 4 and online Supplementary Table S5). Inadequate reporting of the randomisation method was the main reason for lower quality ratings. Nine studiesReference Rose, Hardman and Christiansen (24 , Reference Caton, Ball and Ahern 39 , Reference Caton, Marks and Hetherington 40 , Reference Christiansen, Abigail and Randall-Smith 42 , Reference Mattes 47 , Reference Ouwens, van Strien and van der Staak 48 , Reference Yeomans, Hails and Nesic 52 – Reference Yeomans 54) did not report a source of funding that would present a conflict of interest, and five studiesReference Poppitt, Eckhardt and McGonagle (12 , Reference Buemann, Toubro and Astrup 29 , Reference Cordain, Bryan and Melby 43 , Reference Cordain, Melby and Hamamoto 44 , Reference Westerterp-Plantenga and Verwegen 51) reported either industry funding or industry supply of alcohol for the study. Only two experimentsReference Hollister (28) used double-blind conditions, while twelve studiesReference Foltin, Kelly and Fischman (11 , Reference Poppitt, Eckhardt and McGonagle 12 , Reference Buemann, Toubro and Astrup 29 , Reference Caton, Ball and Ahern 39 , Reference Caton, Marks and Hetherington 40 , Reference Christiansen, Abigail and Randall-Smith 42 , Reference Hetherington, Cameron and Wallis 45 – Reference Tremblay, Wouters and Wenker 50) were single-blinded. Single-blind conditions were achieved by disguising either the true nature of the study to participants or the non-alcoholic beverage or a combination of both.

Fig. 4 Summary of the Effective Public Heath Practice Project quality assessment tool for quantitative studies within the included studies across the seven domains: selection bias, study design, confounders, blinding, data collection methods, withdrawals and drop-outs and global rating. The proportion of included studies with each judgement:
![]() , strong rating;
, strong rating;
![]() , moderate rating;
, moderate rating;
![]() , weak rating.
, weak rating.
Discussion
To our knowledge, this is the first systematic review with meta-analyses performed for all available RCT and non-randomised crossover studies that compared the effect of alcohol consumption on both food energy intake and total energy intake in humans. All twenty-two studies consistently demonstrated that participants did not reduce their food energy intake to compensate for the energy consumed from alcoholic beverages.
Food energy intake
Previously, it has been suggested that alcoholic beverage consumption may increase food energyReference Yeomans (10) . In this review, the studies indicate that energy consumption as food is acutely increased by an average of 343 kJ after alcohol consumption when compared with non-alcoholic beverages. These results could be attributed to a combination of mechanisms. Alcohol’s effects on human expectancy (previously learned associations between alcohol consumption and appetite stimulation), disinhibiting eating restraint and the satiety hormones have been proposed as possible mechanisms for increased food intake with alcohol consumptionReference Traversy and Chaput (3 , Reference Yeomans 10 , Reference Caton, Nolan and Hetherington 55) . However, others have suggested that these mechanisms are unlikely to induce the proposed stimulation of alcohol consumption on appetite and potential increased food intake in human participantsReference Yeomans (10) . Rather, alcohol’s pharmacological effects on several neurotransmitters in the central nervous system that influence behaviour may explain this effectReference Yeomans (10 , Reference Lobo and Harris 56) . Alcohol binds to GABAA receptors at low to moderate doses, which is involved in the control of food intake in miceReference Yeomans, Caton and Hetherington (9 , Reference Lobo and Harris 56 , Reference Kumar, Porcu and Werner 57) . In vitro and animal studies have also shown that alcohol consumption stimulates the release of opioid peptides, which has been postulated to be associated with orosensory reward aspects that influence food intakeReference Widdowson and Holman (58 , Reference Yeomans and Gray 59) .
The only studyReference Caton, Ball and Ahern 39) in this review that investigated a dose–response relationship between alcohol and food consumption reported that alcohol increased food energy intake only after consumption of 32 g of alcohol. Conversely, the present review found no increase in food energy intake after consumption of a high alcohol dose (≥30 g or ≥0·6 g/kg) when compared with NE- or N-beverages and E-beverages. The discrepancy in findings may be due to the differences in methodologies among the reviewed studies as well as the review pooling available data from the included studies. Reviewed studies used both fixed and adjusted alcohol, different alcohol doses and types of alcohol. However, the highest fixed dose of alcohol used in a study was 54 gReference Mattes (47) and the highest adjusted alcohol dose was 0·75 g/kgReference Hollister (28) . In 2016, 26·9 % of the UK drinking population reported binge drinking alcohol on their heaviest drinking day, which means that males and females had consumed in excess of 64 and 48 g of alcohol, respectively (60) . This is greater than the included review’s highest alcohol doses of 54 g and 0·75 g/kg in one sitting, for fixed dose and adjusted dose, respectively. As this review’s findings are inconsistent with the findings with one studyReference Caton, Ball and Ahern (39) that investigated a dose–response relationship, further research is warranted to investigate a possible dose–response relationship between alcohol consumption and food energy intake. Differences in study populations, types of alcoholic beverages provided and the usual eating habits could vastly influence the dose–response relationship observedReference Caton, Ball and Ahern (39) .
In addition, the combination of the type of alcohol ingested and the types of food served may influence results. It has previously been suggested that consumers value food pairings with wine, although this was less important with beerReference Simone and Steve (61) , which was reported to pair well with ‘junk or snack-type food’. Food that were identified to be consumed with beer were snacks or convenience foods such as nuts and crispsReference Simone and Steve (61) . In the studies reviewed here, beer was predominantly used as the intervention alcoholic beverage, although the food provided varied. More research needs to be performed to see whether types of alcoholic beverages and their consumption with specific types of food influence food energy intake. For example, if drinkers were provided a choice when they drink beer, it would be insightful to investigate whether they prefer to consume more or less energy-dense foods.
Total energy intake
The present review demonstrated that alcohol consumption, when compared with non-alcoholic NE- or N-beverages, increased the total energy intake by an average of 1072 kJ, which is the sum of food energy and beverage energy intake. However, due to inconsistent reporting of total energy intake within the five studies that used isoenergetic non-alcoholic E-beverages comparators, no associations were able to be determined. All twenty-two reviewed studies consistently reported that participants did not compensate for the energy that was consumed as part of the alcoholic beverage by eating less food, which was similarly reported by YeomansReference Yeomans (10) .
An increase in total energy intake following consumption of alcohol is supported in a previous meta-analysisReference Chapman, Benedict and Brooks (16) . The high energy content of the alcoholic beverages used in the intervention conditions contributes to the increase in total energy intake reported in the studies and therefore is more evident when compared with the negligible energy content of NE-beverages or N-beverages.
The subgroup analyses showed that both low-dose (<30 g or <0·6 g/kg) and high-dose (≥30 g or ≥0·6 g/kg) alcoholic beverages increased the total energy intake, although high-dose alcoholic beverages increased it to a greater extent; however, overlapping 95 % CI were observed. This present review suggests that high alcohol dose may stimulate total energy intake, when compared with N- or NE-beverage, as five of the eight studies that increased the total energy intake used a high alcohol dose. The observed increase in total energy intake is likely due to the higher energy content of the high-dose alcoholic beverages compared with the low-dose alcoholic beverages. Interestingly, when considering epidemiological studies and the relationship between alcohol consumption levels and body weight, only heavy alcohol consumption is associated with increased body weight in malesReference Sayon-Orea, Martinez-Gonzalez and Bes-Rastrollo (4) . It is likely this was due to the limited reporting of total energy intake in low alcohol dose studies and the inclusion of the two studies that used a low alcohol dose with relatively longer study durations. Furthermore, the finding that total energy intake increased in response to high alcohol dose to a greater extent than low alcohol dose was not supported when the high alcohol doses were compared with E-beverages. This suggests that E-beverages also increase the total energy intake, which may negate any marked differences in the increased total energy intake when compared with alcoholic beverages. The review and subgroup meta-analyses suggest that alcohol consumption increases the total energy intake, with the review’s findings suggesting that high-dose alcohol has a stronger effect on increasing the total energy intake than the low-dose alcohol.
Implications
As obesity continues to increase globally, there is a need to understand the impact of habitually consuming energy-dense alcohol. Passive overconsumption of dietary energy, with poor compensation for energy intake consumed as alcoholic beverages, may lead to positive energy balance and promote weight gain in people who regularly consume alcohol. Previous reviews have reported conflicting evidence on the relationship between the consumption of alcoholic beverages in generalReference Sayon-Orea, Martinez-Gonzalez and Bes-Rastrollo (4) or specifically beerReference Bendsen, Christensen and Bartels (5) and body weight. Alcohol dose and type of beverage may also be a confounding factor that is evident in two crossover studies included in the present review. These studies measured changes in body weight with alcohol consumption and failed to detect any changes after 6 weeksReference Cordain, Bryan and Melby (43) of daily and 10 weeksReference Cordain, Melby and Hamamoto (44) of 5 d/week of red wine consumption (27·6 g alcohol/d). Over longer periods of time, wine consumption has been reported to be protective against weight gain, which could be attributed to its resveratrol content, whereas consumption of beer and spirits has been positively associated with weight gain, particularly at heavy consumption levelsReference Sayon-Orea, Martinez-Gonzalez and Bes-Rastrollo (4) .
Our findings suggest alcohol consumption can likely predispose individuals to energy imbalance by increasing both acute food energy intake and total energy intake. This was not only evident for consumption of low alcohol doses but for higher doses as well. Although further investigation with additional high-quality studies to confirm the effect of alcohol consumption on food energy intake is strongly warranted, the present review has implications for alcohol consumption guidelines. Alcohol consumers need to be aware that whether they fail to compensate for the energy ingested from alcohol the next day, this becomes an additional source of energy that will influence the overall energy balance. These public health messages have to focus on the settings where alcoholic beverages are commonly consumed, such as restaurants, pubs, sporting events and at home. Furthermore, these messages can be directed at vulnerable population groups who frequently consume alcoholic beverages or frequently consume a high number of alcoholic beverages on single occasions and who may also be at risk of weight-related problems due to the low socioeconomic status. The vulnerable population groups in both Great Britain and Australia are young adults and middle-aged adults who are particularly at risk (60 , Reference Brown 62 , 63) .
Strengths
This is the first systematic review and meta-analyses to specifically investigate alcohol consumption and quantify its effect on both food energy intake and total energy intake. Food energy intake has not previously been investigated in a systematic review or meta-analysis. A broad scoping search was applied to four databases, which retrieved an extensive number of records and with no date limits applied with the search strategy, the authors are confident that the search strategy retrieved all relevant studies.
Limitations
A number of limitations were identified. First, studies were conducted predominantly with young adult female participants and hence, the generalisability of these studies to other age groups, such as older males and females, is limited. Second, reporting of participant baseline characteristics, such as age, BMI, usual alcohol consumption levels and ethnicity, was not consistent across the twenty-two studies. Third, the cut-offs used to classify unrestrained and restrained eaters were markedly different for studies that measured this factor, despite using similar questionnaires such as the DEBQ, TFEQ or their respective restraint subscales. Finally, the definitions regarding low, moderate and high usual alcohol consumption levels were not consistent across studies as they were conducted in different countries with different interpretations for the alcohol content of a standard drink and different guidelines for consumption.
Experimental designs and methodologies differed considerably, which created challenges in comparing studies and the synthesis of data. A range of different alcoholic beverage types and doses were utilised for the interventions. Blood alcohol concentration (BAC) is influenced by the alcohol type, dose and rate of drinking. As an example, consumption of spirits are shown to result in a higher BAC than wine and beer, despite ingestion of the same alcohol doseReference Mitchell, Teigen and Ramchandani (64) . Furthermore, associations have been demonstrated between spirits and beer and body weight, which are stronger than the associations found between wine and body weightReference Sayon-Orea, Martinez-Gonzalez and Bes-Rastrollo (4) . The impact of alcohol on body weight is further influenced by characteristics such as sex, alcohol type and total consumption patternsReference Sayon-Orea, Martinez-Gonzalez and Bes-Rastrollo (4 , Reference Bendsen, Christensen and Bartels 5) . Despite this, many factors, known to have an impact on body weight, have not been accounted for in previous studiesReference Traversy and Chaput (3) ; such as sex, physical activity levels and sleep habits and, therefore, may contribute to the lack of a clear demonstrable relationship between alcohol consumption and body weight. In addition, the use of deception and disguising of the non-alcoholic beverages was utilised irregularly across studies.
The test food provided varied between studies, with different savoury and sweet foods used, such as chocolate snacks and pasta meals. Also, the primary outcomes of food energy intake and the total energy intake were not consistently reported. Lastly, very few studies measured the participants’ liking of the food provided, which may have influenced the amount of food they consumedReference Finlayson and Dalton (65 , Reference Finlayson, King and Blundell 66) .
At the review level, limitations are that non-English-language studies were excluded from the search strategy, which may have resulted in language bias. Furthermore, a number of studies that investigated the effects of alcohol consumption on the intake of liquid meals were also excluded. No hand searching of the reference list of the included studies was conducted due to the extensive number of records retrieved. There are several potential limitations with the meta-analysis. First, since this was an aggregate data meta-analysis, there is potential for ecological fallacy, specifically Simpson’s Paradox, to existReference Rucker and Schumacher (67) . Second, some of the statistically significant findings may have been due to chance, given the large number of statistical tests that were conducted. Third, as the studies were not randomly assigned to covariates or subgroups in the meta-analysis, they are considered to be observational in nature, and the results of the subgroup analyses do not support causal inferences. Lastly, some of the sub-group meta-analyses were conducted on the basis of small numbers of studies with high I 2 values, which may have influenced the findings.
Further work/directions
The reviewed studies predominantly utilised a fixed alcohol dose although very few studies included an isoenergetic non-alcoholic comparator. To determine whether the effect on food energy intake is attributable to the pharmacological effects of alcohol rather than the energy content of the alcoholic beverage, the use of an isoenergetic non-alcoholic comparator is recommended. Furthermore, for research studies that utilise a broad inclusion criteria for age and BMI, it is recommended to utilise adjusted alcohol dose (g/kg body weight), rather than fixed alcohol dose, to reflect differences in body size and alcohol metabolism. Standardisation of study methods, such as the type of alcohol used for the beverages and foods used and to test in a range of different age groups, is also warranted. The consumption of beer and spirits is positively associated with weight gain to a greater extent compared with wine intakeReference Sayon-Orea, Martinez-Gonzalez and Bes-Rastrollo (4) . Consistent reporting of both food energy intake and total energy intake outcomes and participant characteristics is fundamental to provide additional evidence for meta-analyses. Lastly, consideration of the participants’ liking of the test food with food liking questionnaires is crucial to minimise a potential confounding factor for energy intake.
Conclusion
This review demonstrates that compared with non-alcoholic beverages or no beverage, the consumption of alcoholic beverages significantly increases both food energy intake and total energy intake by 343 and 1072 kJ on average, respectively. This quantity of energy has implications for the body weight of those who consume alcoholic beverages and food provision in the settings in which they do so, as chronic passive overconsumption of alcoholic beverages will add fuel to the obesity epidemic.
Acknowledgements
The authors would like to acknowledge Dr StellaMay Gwini (biostatistician) for her assistance with the meta-analysis component of this publication, Ms Cassandra Freeman (subject librarian) for her assistance with the search strategy and Ms Claire Bristow for her assistance with retrieving papers.
A. K. is supported by an Australian Government Research Training Program Scholarship. G. P. was supported by a Monash University Vacation Scholarship Program. M. J. P. is supported by an Australian National Health and Medical Research Council Early Career Fellowship.
A. K. and H. T. conceptualised the analytical protocol. A. K. conducted the literature search. A. K. and G. P. assisted with table and figure creation and extracted data. A. K., A. L. D., G. P. and M. J. P. conducted the study data analyses. A. K. and M. J. P. conducted the meta-analyses. A. K. was the primary writer. H. T., A. L. D., G. P. and M. J. P. reviewed the content of the manuscript and provided editorial feedback.
None of the authors have any conflicts of interest to declare.
Supplementary material
For supplementary material/s referred to in this article, please visit https://doi.org/10.1017/S0007114518003677