


Nutrition plays a vital role in the community. During nutritional emergencies such as drought or famine, the first relief priority is the provision of food to the community and disease prevention through prompt attention to nutrition and various aspects of environmental health1. Food security implies that all people at all times have both physical and economic access to enough food for an active healthy life. Attempts have been made to study various aspects of nutrition and food security during famine, war, flood, drought and economic crisis at internationalReference Kaluski, Ophir and Amede2–Reference Kaiser, Melgar-Quionnez, Lamp, Johns, Sutherlin and Harwood5 and national6–Reference Vijayaraghavan, Hanumanthao Rao, Sarma and Brahmam8 levels.
Drought conditions occur quite frequently in the Thar Desert, which lies mostly in the Indian state of Rajasthan. Desert districts of western Rajasthan have been the worst affected; during the past century, this arid region experienced 47–62% of droughts of varying intensities9. This has weakened the rural economy and largely eroded the coping capacity and economic potential of the people, with heavy livestock losses and reduced harvests leading to increased poverty and chronic malnutrition. This periodic cycle of scarce conditions, attributable to geomorphology and the climatic characteristics of Thar Desert, invariably affects the agricultural population residing in the desert by influencing their food intake. Cereals and millet are the greatest contributors to energy and protein intakes of residents in rural populations in India, with nearly 85% of the total daily energy intake coming from this source6. However, in desert residents, this proportion is more than 85% and actually increases further during times of drought.Footnote * In 1987, the Desert Medicine Research Centre (DMRC) conducted a health and nutrition survey of drought-affected parts of Rajasthan and revealed grade III undernutrition, assessed on the basis of weight-for-age, in pre-school children (2.9–17.3% prevalence depending on age group), with boys and girls being equally affected. Energy intake was significantly reduced in all age groups in all districts compared with the Recommended Dietary Allowances (RDAs) of the Indian Council of Medical Research (ICMR)11. Clinical cases of protein–energy malnutrition (PEM) were frequently seen in all six desert districts (3.0 to 17.8%). Vitamin A deficiency was widely prevalent in Barmer, Jodhpur, Jalore and Jaisalmer in all age groups.
Against this backdrop, a survey was planned to study the impact of drought on the nutritional status of pre-school children aged 0–5 years from a rural population in a desert area facing drought conditions very frequently, the results of which would help in assessing the magnitude and extent of malnutrition in this area. Hence the main objectives of the present study were to assess the nutritional status of pre-school children in a drought-affected area of western Rajasthan, with nutritional status assessed by anthropometry, dietary intake and clinical examination, and to perform a time trend analysis of malnutrition in order to suggest possible means to redress it. The results of the study were also compared with the findings of the 1987 drought survey6 and the 1986 baseline health survey10 (both conducted by DMRC), to assess the impact of drought on nutritional aspects responsible for the higher prevalence of various morbidities.
Profile of the state of Rajasthan
The Great Indian Desert, or Thar Desert as it is commonly called, is spread over an area of 285 680 km2 between 22°30′ and 32°50′ N and from 68°05′ to 75°45′ E. Within India it forms part of the country's north-west arid zone in the states of Rajasthan (69%), Gujrat (21%) and Punjab and Haryana (10%). The desert is bordered by the irrigated plains of the river Indus in the west, the Aravalli hill ranges in the east, the Rann of Kutch in the south, and the plains of Punjab and Haryana in the north and north-east. The greater part of the desert remains arid to hyper-arid. Annual precipitation is low, ranging from less than 100 mm in the west to about 500 mm in the east. Rainfall is highly erratic and about 90% of it is received in the months of July and August. Delayed onset and early withdrawal of the monsoon, the main source of rain, is quite common. Summer temperature remains high, reaching up to 50°C in May and June in some places. Dust storms are quite common with wind velocity above 50 km h− 1.
The desert dwellers have for centuries lived under harsh conditions with a bare minimum of potable water, which was fetched from far-off places and stored as a precious treasure. Milk and milk products were available in plenty, but not drinking water. The succulent vegetation was also utilised to quench thirst. In years of good rainfall, ponds, tankas and nadis turned into water reservoirs, serving the human and livestock requirement. The dominant land use in the Thar has traditionally been grazing for livestock, supplemented by rain-fed agriculture producing millet, pulses and oil seed crops9. Hence millet and wheat constituted the main foods. Moong chana dhal and moth were the main pulses consumed by children. For vegetables and tubers, they consumed mostly locally available vegetables such as sangri ker kachariya kakra, potato, guar beans, onion, etc. In Rajasthan state of India, there are 32 districts of which 12 districts represent desert areas (Thar Desert). According to the 1994 Census12, the total population residing in rural areas of the Thar Desert region of Rajasthan is 13 962 000 settled in 12 359 villages.
Materials and methods
The sampling design for the assessment of health and nutritional status was a three-stage sampling technique. The drought survey conducted by DMRC6 in 1987 revealed that Jodhpur and Barmer were worst affected in terms of nutritional deficiencies, energy deficits and PEM. At the first stage, Jodhpur District was selected based on random selection criteria. At the second stage the tehsils (sub-units of district) and at third stage the villages were selected. Jodhpur District has six tehsils, i.e. Bilara, Jodhpur, Shergarh, Bhopalgarh, Phalodi and Osia. All of the tehsils were selected to avoid inter-district variation as the tehsils are considered homogeneous population-wise for the purposes of sampling. From each tehsil four villages were selected in different directions by simple random sampling criteria using random number tables. This sampling gave a complete picture of the district.
During times of drought, all nutritional deficiencies and energy and protein intakes will be affected due to the lack of water. The consumption of nutrients will differ very prominently from the normal situation, affecting weight and height among the child population and cases of PEM will start to be seen. As all nutritional and health problems will be affected during drought, they will occur with more than 1% prevalence. The increased prevalence above 1% becomes a matter of concern because it particularly affects children's growth. Thus the sample size was calculated on the basis of the prevalence rates of nutritional deficiencies (PEM and vitamin A deficiency) by considering that more than 1% becomes a public health problem. Considering this and using the standard procedure for determining sample size with 20% error and 10% non-response, using a 95% confidence interval and limits of ± 2SD (SD, standard deviation), a sample size of 960 was calculated to cover Jodhpur District1. On the basis of this, 40 pre-school children were selected from each village.
A rapid drought survey was conducted and data were collected on a total of 914 pre-school children in May 2003. The data were complete in all senses, i.e. the schedules of all 914 pre-school children contained complete information on all of the parameters (anthropometry, dietary intake and nutritional deficiency signs) for which they were examined. The children were examined at household level following a simple random sampling technique. For each individual, information on demographics and socio-economic aspects was collected by interview using pre-tested schedules. Each child underwent anthropometric and dietary intake assessments and was examined clinically for nutritional deficiency signs in order to assess his/her nutritional status. Examinations were conducted by a trained medical anthropologist and a physician using standard equipment and methods.
All anthropometric measurements (height, weight, fat fold at triceps (FFT) and recumbent length in the case of infants) were taken following standard techniques13, Reference Jelliffe14. According to the World Health Organization (WHO)1, the ‘gold standard’ in anthropometric assessment of children is weight-for-length/height, with the usual practice being to measure the length of children under 2 years of age and the height of older children. For nutritional anthropometry, distribution of the pre-school children according SD classification for weight-for-length/height, along with weight-for-age and height-for-age, was based on comparison with the internationally accepted WHO/National Center for Health Statistics (NCHS) reference values1, 15. Below − 2SD from the corresponding reference median was used as a cut-off to assess the overall prevalence of wasting (low weight-for-length/height, an indicator of short-duration malnutrition), underweight (low weight-for-age) and stunting (low height-for-age, an indicator of long-duration malnutrition).
For dietary intakes, the 24-hour recall method using an oral questionnaire was adopted13. As this was a rapid drought survey due to urgency, only consumption of cereal and millet was queried because these are the major contributors to energy and protein intakes in this population (see above).
To assess nutritional deficiency, clinical signs believed to be of value in nutritional assessment and in clinical assessment of malnutrition were considered, as prescribed by JellifeReference Jelliffe14. Each child was examined clinically from head to foot for nutritional deficiency signs.
The results of the present study were compared with those of earlier surveys conducted in Jodhpur District by the DMRC during drought conditions (1987)6 and normal conditions (baseline health survey, 1986)10, as well as normal non-desert conditions (1986)10. The methodologies adopted in these previous surveys for diagnosing clinical signs of nutritional deficiency and determining anthropometry and dietary intake were same as in the present study.
Comparisons were made between boys and girls in different age groups by applying the chi-square test or proportion test as appropriate. For dietary analyses, mean energy and protein intakes were compared with those of the DMRC drought survey and baseline health survey by applying the t-test for difference between meansReference Snedecor and Cochran16.
Results
Analysis of sociodemographic data revealed that 96.3% of the covered population were Hindus and 3.6% were Muslims. Most children (85.7%) belonged to lower- and middle income families17 (Table 1), with their parents involved mainly in labour and famine relief in drought spots, followed by agriculture. Illiteracy was observed in 57.8% of women and 33.0% of men. The 2003 Census18 reported that overall 60.6% of women and 39.4% of men were illiterate in rural areas of Jodhpur District. Of the total population, 35.1% belonged to Scheduled caste and 31.0% to Other back caste.
Table 1 Distribution of pre-school children according to income of their parents
Growth retardation was observed in the children. The mean weight and height of children in the present study were compared with NCHS standards (Figs 1 and 2), and were lower than the NCHS standards for both sexes at almost all ages. Tables 2–4 present the distribution of the pre-school children according undernutrition (weight-for-age, height-for-age and weight-for-length/height) by SD classification.

Fig. 1 Comparison of the weights of boys (M) and girls (F) in the present study with those of the National Center for Health Statistics (NCHS) references
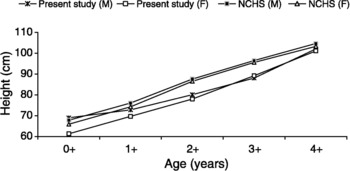
Fig. 2 Comparison of the heights of boys (M) and girls (F) in the present study with those of the National Center for Health Statistics (NCHS) references
Table 2 Weight-for-age – distribution (%) of children according to standard deviation (SD) classification
Table 3 Height-for-age – distribution (%) of children according to standard deviation (SD) classification
Table 4 Weight-for-height – distribution (%) of children according to standard deviation (SD) classification
In general, about 60% of the children were underweight (weight-for-age below − 2SD from the reference median) while the prevalence of severe underweight (below − 3SD from the reference median) was found to be about 31%. Analysis by age revealed the highest underweight prevalence in the age group of 1–2 years. Underweight was significantly higher in girls than boys in most age groups (P < 0.05) (Table 2).
The overall prevalence of stunting (height-for-age below − 2SD from the reference median) was about 53% with the extent of severe stunting (below − 3SD from the reference median) being about 34%. Analysis by age revealed that children in the age group 1–2 years suffered more from stunting. Severe stunting was higher in girls (36.7%) than boys (31.0%), although the difference was statistically insignificant (Table 3).
The overall prevalence of wasting (weight-for-height below − 2SD from the reference median), an indicator of short-duration malnutrition, was about 28% with the extent of severe wasting (below − 3SD from the reference median) being about 10%. Again, children in the age group 1–2 years suffered more from wasting (37.1 and 33.0%, respectively).
Reduction in energy intake is likely to affect fat deposits. It was observed that 36.4% of pre-school children in the present study suffered from mild to moderate deficit in FFT and 36.9% suffered from severe FFT deficit.
Table 5 presents the prevalences of nutritional deficiency signs13, Reference Jelliffe14 analysed. The overall prevalence of anaemia was 30.5%, diagnosed on the basis of conjunctival pallor, platyonychia and koilonychia. Prevalence of marasmus was 1.7% (2.3% in boys and 1.1% in girls). Regarding vitamin A deficiency, overall prevalence of Bitot's spots was 0.2% and no case of night blindness was observed. Regarding vitamin B complex deficiency, overall prevalence of angular stomatitis was observed to be 0.5%, cheliosis 0.9% and glossitis 1.6%. Vitamin C deficiency was observed in 0.1% (gums bleeding). Caries and mottling of tooth enamel were observed in 2.7 and 3.9% of children, respectively.
Table 5 Prevalence (%) of clinical signs of nutritional deficiency among children aged 0–5 years
NA – not available.
Significantly different compared with non-desert area: *P < 0.05.
Comparing the results of the present study with those of an earlier drought survey of Jodhpur District6, the prevalence of vitamin A and B complex deficiencies was highly reduced: Bitot's spots reduced from 17.6% to 0.2% and vitamin B complex deficiency from 80.2% to 3.0% (1987 survey vs. current survey). The overall prevalence of anaemia was also reduced: 30.5% (current survey) versus 73.5% (1987 survey)6.
Table 5 also compares the nutritional deficiency data for the studied population with those from an earlier survey10 in a non-desert area of Jaipur District.Footnote * Vitamin A and B complex deficiencies and anaemia were significantly higher in the present study than in the non-desert area. This could be due the harsh environmental conditions and related socio-economic factors.
Table 6 shows that mean energy intake, 339.6 kcal for boys and 343.6 kcal for girls, was very poor compared with the RDA, 1460 kcal, given by the ICMR11. Thus the energy deficit observed in these pre-school children was very high, i.e. 76%. Their mean energy intake was significantly lower (P < 0.01) compared with earlier studies in drought and normal conditions6, 10. and might be responsible for the high PEM prevalence in the present study.
Table 6 Comparison of mean daily intakes of energy and protein in different surveys according to gender
RDA – Recommended Dietary Allowance (Indian Council for Medical Research11).
Data are mean ± standard deviation where applicable, with number of subjects in parentheses.
Significantly different compared with other surveys: **P < 0.01.
Deficit in mean protein intake was also observed (Table 6). Overall protein intake was 11.9 and 12.1 g in boys and girls, lower than the RDA11 of 22.3 g, giving a mean protein deficit of 54%. Mean protein intake in the present study was significantly lower (P < 0.01) than that observed in earlier studies6, 10, again accounting for the increased PEM prevalence of the study children.
Analysis of the distribution of protein intake by age group revealed that 44–83% of the pre-school children had protein intake less than 15 g (almost half of the RDA11). Thus the percentage of children with protein deficit was high.
Table 6 also gives a comparison of energy and protein intakes between the present study and the non-desert area10, revealing that the overall deficit in energy and protein intake was significantly higher (P < 0.01) in the present study. This may be due to the typically harsh environmental conditions of deserts where children are exposed to extreme environmental conditions and rapidly occurring drought, leading to a poor economy that in turn affects their dietary intake.
Discussion
Children in the present study had growth retardation. Their mean weights and heights were low in comparison to NCHS standards at all ages and for both sexes. The prevalence of wasting (low weight-for-height), an indicator of malnutrition of short duration, was 28%; greater than the cut-off point of 15% stated by WHO to indicate that the severity of malnutrition is critical. Stunting (low height-for-age) signifies a slowing of skeletal growth and is a principal indicator of long-term nutritional experience or growth impairment caused by malnutrition in the past19. Stunting (long-duration malnutrition) was observed in 53.0% of children and underweight (low weight-for-age) in 60.0%. Stunting as well as underweight was higher in girls than boys, although significant only in the case of underweight (P < 0.05), which might indicate that girls were not being given proper care as reported earlierReference Singh, Haldiya, Yadav, Lakshminarayana, Mathur and Sachdeva20, Reference Singh, Haldiya and Lakshminarayana21. The extent of malnutrition in these children was highest in the group aged 1–2 years, and may be attributed to the women in desert areas following the traditional typology of infant feeding pattern (WHO definition), as observed earlierReference Singh and Lakshminarayana22.
Wasting, stunting and underweight were higher in the present study than in other comparable studiesReference Kaluski, Ophir and Amede2, Reference Vijayaraghavan, Hanumanthao Rao, Sarma and Brahmam8, 23. In Ethiopia in 2001Reference Kaluski, Ophir and Amede2, 51.1% of children were below − 2SD and 26.3% were below − 3SD for height; the prevalence rate of underweight was 46% and that of wasting was 11%. In studies carried out by the National Institute of Nutrition (NIN), IndiaReference Vijayaraghavan, Hanumanthao Rao, Sarma and Brahmam8, 23, wasting was observed 26.2% (2000) and 15.4% (2003) of pre-school children. Severe wasting (below − 3SD from the reference median) was higher in the present study (10.0%) than in the NIN study (1.6%)23.
The present results show that pre-school children in the desert area suffered from PEM, vitamin A and B complex deficiencies, and anaemia. PEM prevalence was higher in the present study than in the earlier drought study in Jodhpur District6, whereas vitamin A and B complex deficiencies and anaemia have shown a declining trend, which may be due to the supply of vitamin A and iron by the state government. However, children in the present study showed higher deficits in dietary energy and protein intake compared with children in the earlier drought study, which could be responsible for their higher prevalence of PEM. This can be attributed to near failure of the monsoon for three consecutive years, which led to reduced harvests and a poor economy which further declined the availability and accessibility of food to the community. Wheat and millet are the staple diet in this area. But due to crop failure, they depended mainly on wheat supplied in a programme in lieu of work done. Green leafy and other vegetables were not available. Local desert dried vegetables/foods such as ker (Capparis deciduas), sangri (Prosopis cinereria) and kumathiya (Acacia senegal) were consumed. There was no local production of agricultural and animal products during the drought, leading to a shortage of food grains, fodder and increased labour unemployment that had direct economic consequences along with food insecurity leading to malnutrition.
Vitamin A and B complex deficiencies and anaemia were significantly higher in the population from the desert area compared with the non-desert area10 and other populations from rural IndiaReference Mohapatra, Geddam, Marai, Murmu, Mallick and Bulliyya7, Reference Vijayaraghvan and Hanumantha Rao24. Also, overall energy and protein deficits were higher in the present study than in the non-desert area10 and other parts of countryReference Vijayaraghvan and Hanumantha Rao24; as was PEM prevalence, reported in previous Indian studiesReference Mohapatra, Geddam, Marai, Murmu, Mallick and Bulliyya7, Reference Vijayaraghvan and Hanumantha Rao24 as 4.5 and 0.2%, respectively. These findings might be due to the harsh environmental conditions of desert areas where drought occurs quite frequently and adversely affects the economy, largely eroding the coping capacity and economic potential of the people as a result of heavy livestock losses and reduced harvests, leading to increased poverty and poor food intake of the inhabitants that in turn might be responsible for the higher protein deficit in the studied group.
Due to inadequate consumption of daily food the children were suffering from wasting and PEM. Efforts should be made to incorporate measures, such as ensuring the supply of adequate energy and protein to all age groups and especially pre-school children, into ongoing nutrition programmes in order to improve food security. Furthermore, there is a strong need to develop nutritional packages based on the locally available diet and feeding habits of pre-school children which would provide them adequate energy, protein and nutrients.
Acknowledgements
The authors express their deep gratitude to the Officer-in-Charge, DMRC, Jodhpur, for guidance and providing facilities.


