


Hypertensive disorders of pregnancy, of which pre-eclampsia and eclampsia have the most serious consequences, are associated with preterm delivery, low birth weight, and maternal morbidity and mortality( Reference Duley 1 ), being the second leading cause of maternal death worldwide( Reference Imdad and Bhutta 2 ). These conditions complicate approximately 2–8 % of all pregnancies worldwide and are directly associated with 10–15 % of maternal deaths( Reference Duley 1 ). In Ethiopia, Gaym et al. studied reports of births in hospitals and health centres during the 12-month period 2007–2008 and found that pre-eclampsia and eclampsia complicated 1·2 % of all these institutional deliveries( Reference Gaym, Bailey and Pearson 3 ). Based on these findings, they estimated that 16 % of direct maternal deaths in Ethiopia and 10 % of all maternal deaths (direct and indirect) were associated with pre-eclampsia; this is in line with global estimates. Because only 6–7 % of births occur in health facilities in Ethiopia, it is unknown whether these findings over- or underestimate the true incidence.
A Cochrane systematic review of thirteen randomized controlled trials involving more than 15 730 pregnant women from both developed and developing countries found that Ca supplementation (≥1·0 g/d) more than halved the risk of pre-eclampsia compared with placebo( Reference Hofmeyr, Belizan and von Dadelszen 4 ). However, the impact of supplementation varied depending on the population’s baseline Ca intake and other risk factors. Another review found that with supplementation, the risk of pre-eclampsia decreased by 41 % among women at low risk of developing hypertensive disorders and by 78 % among those at high risk( Reference Buppasiri, Lumbiganon and Thinkhamrop 5 ). Similarly, findings from Trumbo and Ellwood( Reference Trumbo and Ellwood 6 ) suggest that only populations with low baseline Ca intakes will experience the benefits of supplementation.
The WHO recommends supplementation with 1·5 to 2·0 g of elemental Ca daily from 20 weeks of gestation as part of antenatal care for the prevention of pre-eclampsia among all pregnant women living in areas with low dietary Ca intake, particularly for those at higher risk of gestational hypertension( 7 ). The WHO acknowledges that the implementation of this recommendation requires close monitoring of women’s total daily Ca intakes to avoid exceeding the locally or internationally established Tolerable Upper Intake Level (UL) for Ca( 7 ) because excessive Ca intake can have negative health consequences that could be particularly harmful during pregnancy, such as anorexia, weight loss, polyuria, heart arrhythmias, fatigue, and inhibit the absorption of other essential minerals( Reference Hofmeyr, Belizan and von Dadelszen 4 , Reference Goulding and Robinson 8 , 9 ).
Universal Ca supplementation for pregnant women is not a part of antenatal care services in Ethiopia, and in the absence of empirical data, policy makers need information on which to build their decisions. The 2011 Ethiopian National Food Consumption Survey (ENFCS)( 10 ) confirmed variability in foods consumed by women of childbearing age across the nine ethnically based regional states and two city administrations( 11 ). Although few surveyed women were pregnant (497 of 7998; in Ethiopia, total fertility rate is 4·6 children per woman and 80 births per 1000 women among the 15–19 years age group( 12 )), their dietary data provide proxy intake data for pregnant women to analyse whether Ca intakes are low and to simulate the potential impact of applying universal Ca supplementation on excess intakes. This type of simulation is rarely possible for policy makers as they seek to make locally relevant evidence-informed decisions related to consumption patterns.
The objective of the present study was to provide an extra level of in-country evidence for policy makers by investigating the ‘usual’ dietary Ca intakes of these Ethiopian women and determining the assumed adequacy and safety of three doses of Ca supplements (two within the range recommended by WHO and one lower dose of 1·0 g/d) by comparing the results with age-specific Estimated Average Requirement (EAR) and UL values. The lower dose was included to reflect the Cochrane review findings of benefits with at least 1 g of Ca daily( Reference Hofmeyr, Belizan and von Dadelszen 4 ) and the lack of dose–response studies confirming the minimum effective dose.
Methods
We conducted secondary analyses of cross-sectional nationally and regionally representative ENFCS data collected in 2011 during Ethiopia’s primary annual lean season, June to September. Specific data collection methods, including description of the cluster randomized approach, sample size calculations, population weighting and the sampled women, are reported elsewhere( 10 ). In summary, clusters were randomly selected from the government’s pre-listing by the Central Statistics Agency; women (15–45 years) and children (6–35 months) were pre-listed within each cluster prior to random selection. Data collected included one individual-level 24 h dietary recall interview of each of 7908 women aged 15–45 years, using the multi-pass methodology as recommended by Gibson and Ferguson( Reference Gibson and Ferguson 13 ), with recipes collected and analysed at the household level for most combination foods. We calculated the Ca content of both foods and drinks reportedly consumed( 10 ) using nutrient data from the Food Composition Table for Use in Ethiopia, Part III and Part IV, with a few additional values from Standard Reference 24 of the US Department of Agriculture data set.
To assess the contribution of Ca by food group and potential for a simple screening tool, we assigned each reportedly consumed food to one of fifteen food groups based on classification by the FAO( Reference Kennedy, Ballard and Dop 14 ). When a food contained multiple food groups, the food was classified according to the highest contributor group by weight. Because we had recipes for nearly all foods and drinks, this assumption did not substantially alter the findings of this secondary analysis. Once groups were assigned, the contribution of each food group to Ca intake was taken as a simple proportion of Ca in the total diet coming from each food group.
We analysed all data relative to the EAR and UL for Ca as defined by the Institute of Medicine( 9 ): EAR and UL for pregnant women aged 15–18 years=1100 and 3000 mg/d, respectively; and for pregnant women aged ≥19 years=800 and 2500 mg/d, respectively. The WHO/FAO also developed guidelines( 15 ) but did not differentiate recommendations by EAR and RDA; the UL did not differentiate by age or status (pregnancy); and the Institute of Medicine guidelines were updated more recently than the WHO/FAO guidelines (2011( 9 ) v. 2001( 15 )). Thus, we used Institute of Medicine values because the EAR was essential for our population-level estimates of adequacy, and we considered it appropriate to use the more conservative Institute of Medicine UL for older women because Ca absorption is increased during pregnancy( 9 ). When results for all women were pooled, including both age groups, the estimates were calculated based on the proportions of women in each age group whose intake fell below the age-specific EAR or above the UL.
Two categories of estimated dietary Ca intakes were included in the national and regional analyses: (i) ‘single day’ intakes or the raw data collected for one day of dietary intakes from the 7908 women included in the ENFCS; and (ii) ‘usual’ intakes that were statistically adjusted for assumed variability from the reported dietary intakes using the Intake, Monitoring, Assessment and Planning Program (IMAPP) software( 16 ). These ‘usual’ intakes are reflected in the statistical outputs from IMAPP simulations, but do not include outputs of individual-level estimates of each woman’s ‘usual’ intake. Because IMAPP does not report simulated ‘usual’ intake at the individual level, in simulations we added the selected dose of Ca supplement (1·0, 1·5, 2·0 g/d or 80 % of these) to each individual woman’s ‘single day’ or raw dietary Ca intake; the IMAPP program was then run to simulate the ‘usual’ mean intake and distribution for each scenario. Although there is little information on actual adherence in population settings, a recent publication listed adherence to Ca supplementation among pregnant women at 80 %( Reference Omotayo, Dickin and Pelletier 17 ), and 1·0 or 1·5 g doses could be considered 50 or 75 % adherence to 2·0 g/d or 66 % adherence to 1·5 g/d.
Further, all analyses requiring individual data inputs, such as descriptive statistics, used ‘single day’ data. We analysed ‘single day’ Ca intakes descriptively for the national sample and by age, physiological status (pregnant, lactating, neither) and region using the statistical software package IBM SPSS Statistics version 23·0 (‘single day’ means in all tables). Differences in ‘single day’ estimates by region, age group and physiological status were compared using the two-sample t test and ANOVA (statistical comparisons of ‘single day’ means in all tables). As Ca intake was not normally distributed, we applied a square-root transformation; however, back-transformed data are presented. Statistical significance was set at <0·05 for all tests. All data were analysed for the prevalence of inadequate intake (%<EAR) and excessive intake (%>UL) according to respective age cut-offs.
Because the ENFCS collected just one day of intake data per woman, we employed the IMAPP software, which uses the Jahns/Arab( Reference Jahns, Arab and Carriquiry 18 ) method, to statistically adjust ‘single day’ recall data to generate a ‘usual’ intake distribution by applying external variance ratios. In 2010, Uganda, which is adjacent to Ethiopia, collected 24 h dietary intake data from women of childbearing age (15–49 years old) and repeated these dietary recalls on 10 % of the sampled households in each region on a non-consecutive day( Reference Harvey, Rambeloson and Dary 19 ). The repeated sampling allowed for the estimation of two values from the Uganda data; the variance ratio: 0·64, and the deviation from usual intake (the 4th moment of error): 5·73. These values were used for estimating the ‘usual’ Ca intakes and following simulations of the Ethiopia data (columns 7–22, Table 1).
Table 1 Mean daily calcium intake and prevalence of inadequate and excess calcium intake among Ethiopian women aged 15–45 years, by regionFootnote *

EAR, Estimated Average Requirement; UL, Tolerable Upper Intake Level; B/Gumz, Benshangul-Gumuz; SNNPR, Southern Nations, Nationalities and Peoples Region; A/Ababa, Addis Ababa; D/Dawa, Dire Dawa.
a,b,c,d,eMean values within a column with unlike superscript letters were significantly different (P<0·05).
* All results are weighted to represent nationally and regionally representative data.
† Columns 3–6: mean, sd, %<EAR and %>UL were calculated from raw reported data.
‡ Columns 7–22: means, sd, %<EAR and %>UL were calculated through adjustments applied in deriving the ‘usual’ dietary intake using Intake, Monitoring, Assessment and Planning Program (IMAPP) software and external variables.
The ‘usual’ or adjusted mean intakes simulated using IMAPP software were adjusted by survey weight for a better representation of the total regional and national population. We did not weight by physiological status (pregnant, lactating, neither, both) or age because the survey’s sampling was not intended to be representative of each age group or physiological status. However, sampling within clusters was random from all available women, avoiding systematic bias due to factors such as age or physiological status, and we applied the age-specific EAR and UL in our analyses.
When considering levels of fortificants to add to foods, the amount added is generally considered acceptable if simulations of consumption find that the modelled distribution of those who exceed the UL includes no more than of 2·5 % of individuals( Reference Bielderman, Bruins and Engle-Stone 20 ). Thus, we used this cut-off for comparison but the actual proportions exceeding the UL that would be considered too high in terms of health policy must balance the potential risk of adverse effects of excess Ca intake and the potential benefit of reducing pre-eclampsia.
We conducted simulation analyses in IMAPP assuming universal 1·5 and 2·0 g/d supplementation to estimate the prevalence of inadequate and excessive Ca intakes if supplemented according to the WHO recommendations. We also simulated a lower supplement dose of 1·0 g/d given that doses in this range could be effective in preventing pre-eclampsia and in reducing logistical constraints( Reference Duley 1 , Reference Imdad and Bhutta 2 , Reference Hofmeyr, Belizan and von Dadelszen 4 ), particularly because this lower dose could allow for universal dosing without the need to screen for individual dietary Ca intakes. In addition, we recognized that perfect adherence to supplementation is rare and because adherence data were not available for Ethiopia, simulation of Ca supplementation of 1·0 g/d could be interpreted as assessments of 67 % adherence to 1·5 g/d. Similarly, 1·5 g/d could be considered 75 % adherence to 2·0 g/d. To simulate the impact of lower adherence on excessive intakes in regions of particular concern, for each region in which full adherence resulted in more than 2·5 % of women at risk of exceeding the UL, we also conducted analyses to examine an 80 % adherence rate. Although there are no published adherence rate findings in Ethiopia, a range of 67 to 100 % is similar to rates being identified in ongoing analyses of a short-term study in the region by one author.
In reviewing the raw data, we identified thirty-nine potential outliers, women whose Ca intake was greater than 3000 mg/d. Upon closer examination, we found that these women were consuming substantial yet plausible amounts of Ca-rich foods, and in a few cases, the Ca-rich food was the only food these women reportedly consumed during this lean season; thus no outliers were removed during the analyses. Research ethics approval for the survey and its data analyses was obtained from the Ethiopian Public Health Institute Scientific and Ethical Review Office.
Results
Figure 1 illustrates the risks of both low and high calcium intakes with the applied simulations and the assumed impact of applying universal guidelines in Ethiopia.
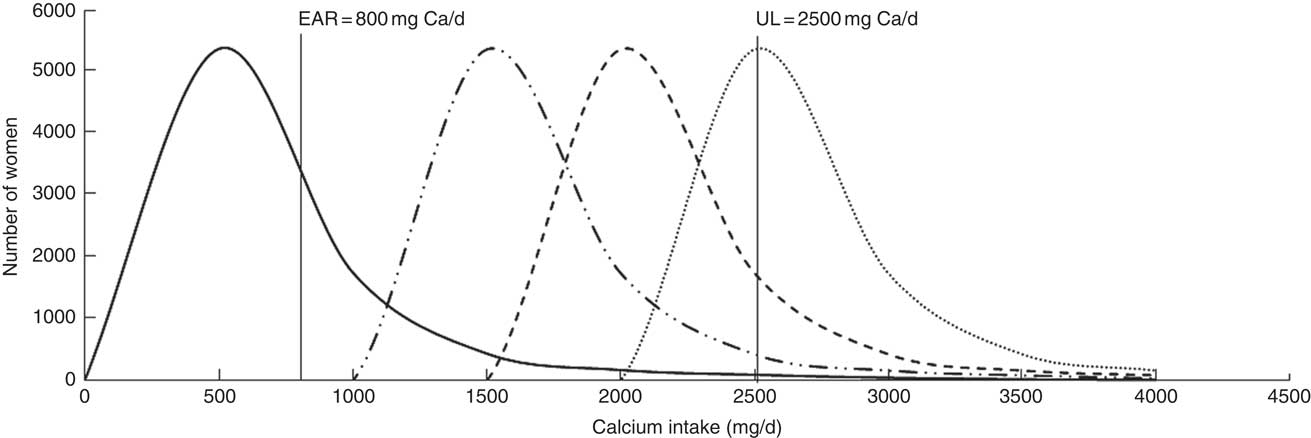
Fig. 1 Simulated impact of calcium supplementation on the estimated total calcium intake distribution among Ethiopian women aged 15–45 years: ![]() , usual calcium intake;
, usual calcium intake; ![]() , supplementation with 1·0 g/d;
, supplementation with 1·0 g/d; ![]() , supplementation with 1·5 g/d;
, supplementation with 1·5 g/d; ![]() , supplementation with 2·0 g/d (EAR, Estimated Average Requirement; UL, Tolerable Upper Intake Level)
, supplementation with 2·0 g/d (EAR, Estimated Average Requirement; UL, Tolerable Upper Intake Level)
Single day and usual calcium intakes
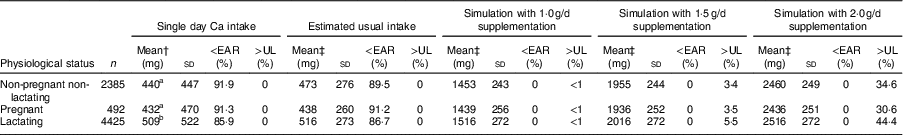
Table 1 demonstrates the distribution of the sample by region (column 2). According to ‘single day’ descriptive analysis, the national mean Ca intake was 478 (sd 495) mg/d (columns 3 and 4), less than the EAR for women, regardless of age; 85·2 % of women’s Ca intakes were low (column 5); and less than 1 % of women’s Ca intakes exceeded the UL (column 6). Analysis by region showed that women in Benshangul-Gumuz had the highest ‘single day’ Ca intake (688 (sd 734) mg/d), significantly greater than the mean ‘single day’ intake in all other regions except the Southern Nations, Nationalities and Peoples Region (SNNPR) and Afar (P<0·05; Table 1, columns 3 and 4). Women in the Somali region consumed the least. Similar findings were obtained when IMAPP was used to analyse the ‘usual’ intake (Table 1, columns 7–10), with a slightly higher proportion (89·4 %) of all women failing to meet the EAR. Again, Benshangul-Gumuz had the greatest daily intake and Somali was the region with the highest prevalence of inadequate intake, with 99·9 % of women failing to meet the EAR.
No significant difference was found between the ‘single day’ mean Ca intakes of pregnant women and non-pregnant non-lactating women (Table 2, column 3). Lactating women consumed significantly more Ca compared with those who were pregnant and those who were neither pregnant nor lactating. Finally, there was no significant difference between the ‘single day’ mean Ca intakes of the younger (15–18 years) and the older women (19–45 years; Table 3, column 3). The younger women consistently had a higher prevalence of inadequate intake (<EAR), attributable to the higher EAR for this age group (Table 3, columns 5 and 9).
Table 2 Mean calcium intake and prevalence of inadequate and excess calcium intake among Ethiopian women aged 15–45 years, by physiological statusFootnote *
EAR, Estimated Average Requirement; UL, Tolerable Upper Intake Level.
a,bMean values within a column with unlike superscript letters were significantly different (P<0·05).
* Data are not weighted by population size; 558 participants had missing values for physiological status.
† Columns 3–6: mean, sd, %<EAR and %>UL were calculated from raw reported data.
‡ Columns 7–22: means, sd, %<EAR and %>UL were calculated through adjustments applied in deriving the ‘usual’ dietary intake using Intake, Monitoring, Assessment and Planning Program (IMAPP) software and external variables.
Table 3 Mean calcium intake and prevalence of inadequate and excess calcium intake among Ethiopian women aged 15–45 years, by age groupFootnote *

EAR, Estimated Average Requirement; UL, Tolerable Upper Intake Level.
aMean values within a column with unlike superscript letters were significantly different (P<0·05).
* Data are not weighted by population size.
† Columns 3–6: mean, sd, %<EAR and %>UL were calculated from raw reported data.
‡ Columns 7–22: means, sd, %<EAR and %>UL were calculated through adjustments applied in deriving the ‘usual’ dietary intake using Intake, Monitoring, Assessment and Planning Program (IMAPP) software and external variables.
§ Age 15–18 years: EAR=1100 mg Ca/d, UL=3000 mg Ca/d; age 19–45 years: EAR=800 mg Ca/d; UL=2500 mg Ca/d.
Impact of simulated calcium supplementation on usual intakes
Simulations of Ca supplementation according to the WHO recommended dosages of 1·5 to 2·0 g/d allowed all women, regardless of age, physiological status and region, to meet the EAR (Tables 1, 2 and 3, columns 11–22). However, at the national level, these dosages caused an estimated 3·7 and 43·2 % of women, respectively, to exceed the UL (Table 1, columns 18 and 22). At the regional level, simulated daily supplementation of 2·0g led to unacceptably high proportions (>2·5 %) of intakes exceeding the UL in all regions except Somali (Table 1, column 22). Daily supplementation of 1·5 g resulted in >2·5 % of women exceeding the UL in seven of eleven regions (Afar, Amhara, Benshangul-Gumuz, Gambela, Oromia, SNNPR and Tigray; Table 1, column 18). Similarly, in the national sample of pregnant, lactating and non-pregnant women, Ca supplementation at 1·5 and 2·0 g/d would likely result in >2·5 % of these populations exceeding the UL (Table 2, columns 18 and 22).
With simulation of Ca supplementation at the lower dose of 1·0 g/d, national- and regional-level analyses estimated that all women would meet the EAR (Table 1, column 13) and less than 1 % of women surpassed the UL at the national level (Table 1, column 14). At this dosage, the only region with >2·5 % exceeding the UL was Benshangul-Gumuz (5·4 % of women; Table 1, column 14).
Simulations assuming 80 % adherence to Ca supplementation of 1·0 and 1·5 g/d resulted in estimated rates of excessive intake of less than 1 % and all women continued to meet the EAR (Table 4, columns 5 and 9). In Benshangul-Gumuz region, the region with the highest mean dietary Ca intake, risk of excessive intake was still >2·5 %, with an estimated 3·1 and 9·1 % of women exceeding the UL at 80 % adherence to 1·0 and 1·5 g/d, respectively (Table 4, columns 5 and 9). Because the overall results from the 1·5 g/d supplementation already found >2·5 % of women exceeding the UL, analyses for 80 % adherence to 2·0 g/d supplementation are not presented.
Table 4 Mean calcium intake and prevalence of inadequate and excess calcium intake among Ethiopian women aged 15–45 years, by region, assuming 80 % adherenceFootnote *,Footnote †

EAR, Estimated Average Requirement; UL, Tolerable Upper Intake Level; B/Gumz, Benshangul-Gumuz; SNNPR, Southern Nations, Nationalities and Peoples Region,
* Analyses are reported only for regions in which >2·5 % of the population surpassed the UL using 1·5 g/d dosage.
† Data are not weighted by population size.
‡ Means, sd, %<EAR and %>UL were calculated through adjustments applied in deriving the ‘usual’ dietary intake using Intake, Monitoring, Assessment and Planning Program (IMAPP) software and external variables.
Foods contributing to calcium intake
To understand high levels of dietary intake among some women and in some regions, we examined which food groups contributed the most to Ca consumption in this sample of Ethiopian women (Table 5). At the national level, cereal and cereal products (36·6 %) contributed most to Ca intake, followed by vegetables (18·4 %), legumes, nuts and seeds (16·2 %), and milk and dairy products (12·6 %).
Table 5 Food group contributions to Ethiopian women’s calcium intake, by region and percentage of total reported dietary calcium intakes

B/Gumz, Benshangul-Gumuz; SNNPR, Southern Nations, Nationalities and Peoples Region; A/Ababa, Addis Ababa; D/Dawa, Dire Dawa.
* Food groups contributing <1 % of the national Ca consumption (sweets, oils and fats, eggs, fish, beverages, others) were examined but omitted from the table.
There was large variation between regions. For example, in Benshangul-Gumuz, the region with the highest Ca consumption, 65·5 % of the total Ca consumed by women came from cereal and cereal products, primarily millet, and only 2·0 % came from milk and dairy products. On the other hand, in Somali, the region with the lowest mean Ca intake, a much larger proportion of Ca came from milk and dairy products (53·9 %).
The high Ca contents or high consumption rates of some regionally consumed foods helps to explain some of the regional variation in Ca contributions by food group. Among women with the highest Ca intakes, the foods that contributed the most to Ca intake included prickly pear, kale, millet, teff (a grain) and dairy products. Teff and millet are staple foods that are consumed in large quantities in many parts of Ethiopia, which helps to explain the large contribution from cereals in some regions. In the Tigray region, prickly pear predominantly contributed to high intakes, which explains why 36·0 % of the total Ca consumed in this region came from fruits whereas, for all other regions, fruits contributed less than 1 % of total Ca. In the SNNPR and Gambela regions, high kale consumption was largely responsible for high Ca intakes and vegetables were an important Ca source in these regions. Lastly, dairy was important for pastoralists, as is the case in Afar.
Discussion
The Ethiopian women of reproductive age in the present study had an estimated ‘usual’ mean intake of Ca of 501 (sd 244) mg/d. This value coincides with the FAO’s estimates of 300 to 600 mg/d for low-income countries( 21 ) and is less than the 900 mg Ca/d cut-off that has been used to define low-intake populations( Reference Hofmeyr, Belizan and von Dadelszen 4 , Reference Palacios and Pena-Rosas 22 ). Consequently, it is not surprising that the prevalence of inadequate dietary Ca intake was very high (87·9 %) and the risk of excessive dietary intake was very low among this population, regardless of age, physiological status and region. These findings are similar to those from women in the national Uganda food consumption survey (prevalence of inadequate Ca intake: 99 % in Kampala; 84 % in Western region; and 94 % in Northern region)( Reference Harvey, Rambeloson and Dary 19 ) and in a Ghanaian study in the Coastal and Guinea savannah zones (471·2 (sd 323·9) and 395·0 (sd 167·2) mg/d, respectively)( Reference Kobati, Lartey and Marquis 23 ). Research shows countries with low dairy product consumption often have low dietary Ca intake( 24 ). In Ethiopia, Uganda and Ghana, milk and dairy product consumption is relatively low among women of reproductive age( 10 , Reference Harvey, Rambeloson and Dary 19 , Reference Kobati, Lartey and Marquis 23 ).
Simulations indicated that supplementation with 1·5 to 2·0 g Ca/d, based on WHO guidelines for Ca supplementation to prevent pre-eclampsia, would allow all women, regardless of age, physiological status and region, to meet the EAR. Importantly, however, universal Ca supplementation with 1·5 or 2·0 g/d would result in a high proportion of women consuming more than the UL (>2·5 %), and this continued to be true for women in Benshangul-Gumuz region even when assuming 80 % adherence to 1·5 g/d supplementation. Mean Ca intake in Benshangul-Gumuz was the highest across Ethiopia at 688 mg/d, but two other regions also had mean Ca intake >600 mg/d, Afar and SNNPR. The risk of excess in these two regions dropped to <2·5 % when assuming less than 100 % adherence to 1·5 g Ca daily (Tables 1 and 4). Guidelines should be aimed at ensuring women consume at least the minimum effective dose, thus must consider the likelihood of low adherence among some women. However, this should not put at risk those who adhere to the actual guidelines. The minimum effective dose is not yet determined, but in our simulations, universal Ca supplementation at 1·0 g/d posed the least risk of excessive intake while still allowing women to meet the EAR. Nevertheless, at less than perfect adherence, this lower dose could result in some women with low dietary intakes consuming less than the EAR and even more women at risk of consuming less Ca than needed to prevent pre-eclampsia.
To guide policy decisions, more research is needed on the level of long-term risk of high Ca intake, particularly compared with the risk of deficiency. Although some studies have also found an inhibitory effect of Ca on Fe absorption, a review of human studies by Lönnerdal( Reference Lönnerdal 25 ) found that substantially increased Ca intakes over long periods of time generated no changes in haematological measures or indicators of Fe status; the review postulated that the inhibitory effect may be of short duration and that there may be compensatory mechanisms at play( Reference Lönnerdal 25 ).
In addition to safety, policy makers may have other reasons for setting their national guidelines at a lower-dose supplementation than recommended by WHO, as was done in India( 26 ). For example, Ca is moderately expensive: the cost of CaCO3 tablets without vitamin D, the most economical supplement available, is approximately $US 3–6 per pregnancy compared with $US 0·48 for Fe–folic acid supplementation( Reference Hofmeyr, Belizan and von Dadelszen 4 ). Also, divided doses of about 500 mg are recommended for adequate absorption( 7 ), so higher levels of supplementation would require ingesting Ca tablets at three or more separate times each day. Higher doses could potentially be a barrier to adherence( Reference Currie, de Graft-Johnson and Galloway 27 ), although one study found adherence was similar at doses of 1–1·5 g/d( Reference Omotayo, Dickin and Pelletier 17 ). The logistics and cost of supplementation with 1·5 to 2·0 g Ca/d have been regarded as prohibitive in several settings( Reference Currie, de Graft-Johnson and Galloway 27 ). These factors, of course, must be balanced with the need to deliver effective doses. The wide variation in individual and regional intakes in Ethiopia illustrates the complexity of identifying the appropriate level for universal supplementation of pregnant women in a population.
One caveat is that the Ca EAR is based on functions of Ca not related to pre-eclampsia and, as such, decisions about when to promote Ca supplementation aimed at preventing pre-eclampsia might not be served by considering adequacy of meeting the EAR. The WHO recommendation of 1·5 to 2·0 g/d is based on results of clinical trials that found a significant impact on incidence of pre-eclampsia with supplementation at these levels. There is a lack of research investigating the minimal effective dose of antenatal Ca, which greatly hinders decision making. However, some preliminary evidence shows that the lower dosage may be effective. According to Hofmeyr et al.( Reference Hofmeyr, Belizan and von Dadelszen 4 ), among women at high risk of pre-eclampsia, trials of low-dose Ca supplementation showed a reduction in pre-eclampsia similar to that shown in the trials of higher-dose Ca supplementation. Thus, following more research, the WHO guidelines may change to include lower doses in addition to screening for high Ca intakes. Omotayo et al.( Reference Omotayo, Dickin and O’Brien 28 ) suggest that while awaiting research regarding the minimal effective dose, policy makers may consider dosages of 1·0 to 1·5 g elemental Ca/d universal supplementation, depending on the local average dietary consumption and variability in intakes, logistical feasibility and acceptability among the target population( Reference Omotayo, Dickin and O’Brien 28 ).
As stated in the WHO 2013 Ca guidelines, attention to individual intakes is important. Our results highlight that women in certain regions in Ethiopia are at increased risk of excessive intake compared with other regions, such as Benshangul-Gumuz in which simulations indicated that 3·1 % of women would exceed the UL even when we assumed doses of only 800 mg/d (80 % of just 1·0 g). The consumption of certain foods contributes greatly to overall Ca intake in this population and is largely responsible for the regional differences. In addition to regional variability in Ca-containing foods consumed, seasonality also plays an important role in that two key Ca contributors, Ethiopian kale and prickly pear, are consumed only during their growing seasons that corresponded with the food consumption survey.
While awaiting more data on minimum effective dose and risk of excess, policy makers should consider the value of developing appropriate screening tools to identify potentially high Ca consumers, thus avoiding any risk to women with high adherence to supplementation along with higher dietary Ca intakes. Our findings of high variability across regions and some high Ca contributors to women’s diets in Ethiopia, including seasonal foods, reinforce the potential of a simple screening tool, particularly if the minimum effective dose is found to be 1·5–2·0 g Ca/d. Such a screening tool would optimally take account of all Ca sources, including seasonal and regional variations in food consumption. The use of high-Ca seasonal (prickly pear, kale) and staple foods (millet, teff, dairy) that we identified demonstrates the need for consideration of both seasonal and regularly available foods when developing a screening tool. The variability across regions and clustering around certain high-Ca foods might not be true in other countries, and few developing countries have individual-level dietary data to derive this information, but most countries collect household-level consumption surveys which could be analysed in such a way to assess risk of low Ca intakes and inform the development of a locally relevant screening tool.
Certain limitations may influence interpretation of our findings. Ca intake was determined using one 24 h dietary recall per participant and thus intra-individual variation was not quantified directly from the ENFCS data. While it is valid to use external variance ratios from a relatively similar country to correct for single day dietary data, it is not ideal( 16 ). Further, implications for antenatal supplementation would have been more relevant if analyses had focused exclusively on data from pregnant women, rather than all women of reproductive age, but the ENFCS sampling method was not designed to provide nationally or regionally representative samples of pregnant women. However, there was no significant difference in the ‘usual’ mean Ca intakes between the pregnant and the non-pregnant non-lactating women in the current study, confirming previous findings in southern Ethiopia( Reference Asayehu, Lachat and Henauw 29 ), so it is unlikely that results would have differed if these analyses had been conducted with pregnant women only. The cross-sectional design of the study does not account for seasonality; data were collected during the longest lean season in Ethiopia and thus dietary Ca intakes may not reflect those of the non-lean seasons. While we might expect this approach to underestimate Ca intake for the year, this is not necessarily the case. For example, prickly pear fruit is high in Ca content and is primarily available in this lean season; consumption of this fruit, sometimes to the exclusion of most other foods, resulted in particularly high Ca intakes among some women. Lastly, because Ethiopian diets and Ca intakes may not be typical of other African countries, results might not be generalizable to other countries. However, these findings do suggest considerations for setting policy within other contexts and the advisability of conducting such analyses to guide policy decisions, if sufficient data are available.
Conclusion
In conclusion, analysis of nationally representative food consumption survey data indicates that dietary Ca intakes of Ethiopian women are low relative to international standards, with more than 89 % of women not meeting the EAR. As such, the country fulfils the criteria for the WHO’s universal Ca supplementation recommendation of 1·5 to 2·0 g/d among pregnant women for the prevention of pre-eclampsia( 7 ). However, simulation analyses indicate that these dosages could result in high risk of excessive intake if adherence is high. Ethiopian women’s diets vary widely by region, but this variability in Ca intakes may not be typical of other African countries. This emphasizes the need to follow WHO guidelines to consider screening women for high Ca consumption when providing Ca during pregnancy; differential consumption of a few high-Ca foods presents a challenge and suggests that simple screening procedures might be advisable in some regions to identify women with very high dietary intakes and avoid supplementation that could lead to excess intake. Policy makers could also assume low adherence, but this could leave diligent consumers at risk. Universal supplementation at 1·0 g/d would enable women to meet the EAR and reduce safety concerns. However, although 1·0 g/d appears to be a safe dosage for supplementation in Ethiopia, data are lacking globally on adherence rates and the minimal effective dose of antenatal supplementation to prevent pre-eclampsia.
These analyses provide an example of the process policy makers could apply to available data to determine how best to implement the WHO guidelines for Ca supplementation among pregnant women( 7 ), and emphasize the value of continued research to confirm the lowest effective dose in these situations.
Acknowledgements
Acknowledgements: The authors are grateful for support and funding from the Micronutrient Initiative. They wish to recognize the contribution of the Ethiopian Public Health Institute, the Central Statistical Agency of Ethiopia, Professor Alicia Carriquiry and Michelle Gibbs for completing the Ethiopian NFCS and/or contributing to these analyses. Lastly, they are grateful to the Ethiopian women who shared dietary recall information, allowing the completion of these analyses. Financial support: Analyses in this paper were supported by student funding from Nutrition International, formerly the Micronutrient Initiative, and Global Affairs Canada (Muskoka Fund). Data for the 2011 Ethiopian NFCS were collected using funding from Global Affairs Canada through the Micronutrient Initiative; the Ethiopian Federal Ministry of Health through the World Bank; and Irish Aid. These funders had no role in the design, analysis or writing of this article beyond that described under ‘Conflict of interest’. Conflict of interest: B.T., K.S., T.M. and K.L.D. declare no conflict of interest. S.E.W. and L.M.D.-R. are employed by Nutrition International/Micronutrient Initiative, which provided financial support for this paper, but the authors alone are responsible for the views expressed in this publication. Authorship: B.T., S.E.W., L.M.D.-R. and K.L.D. designed the research; B.T., K.S., S.E.W. and T.M. conducted the research; B.T., K.S., S.E.W., T.M., L.M.D.-R. and K.L.D. analysed the data/performed the statistical analysis; B.T., K.S., S.E.W. and K.L.D. wrote the paper; and B.T., K.S., S.E.W., T.M., L.M.D.-R. and K.L.D. had primary responsibility for the final content. Ethics of human subject participation: This cross-sectional population-based survey was conducted according to the guidelines laid down in the Declaration of Helsinki and all procedures involving data collection from human subjects were approved by the Ethiopian Public Health Institute Scientific and Ethical Review Office. Verbal voluntary informed consent was obtained from all participants and was witnessed and formally recorded.


