


1. Introduction
The L-class space mission proposed by Delabrouille et al. (Reference Delabrouille2019) will have a tremendous impact on our understanding of the Universe and on many branches of astrophysics. The project features two instruments at the focus of a 3-m-class, cold (8 K) telescope: (i) a broad-band, multi-frequency, polarimetric imager operating over the 20–800 GHz frequency range that would map the cosmic microwave background (CMB) at high sensitivity, as well as the thermal and kinetic Sunyaev–Zeldovich (SZ) effects and the galactic and extragalactic continuum emissions; and (ii) a moderate spectral resolution ( $R\,{\simeq}\,300$
) filter-bank spectrometer covering the 100–1 000 GHz band. These two instruments would comprise tens of thousands of millimetre (mm) and submillimetre (submm) detectors cooled to sub-kelvin temperatures for sky-background-limited performance.
$R\,{\simeq}\,300$
) filter-bank spectrometer covering the 100–1 000 GHz band. These two instruments would comprise tens of thousands of millimetre (mm) and submillimetre (submm) detectors cooled to sub-kelvin temperatures for sky-background-limited performance.
A set of Fourier-transform spectrometers (FTSs), covering the full 10–2 000 GHz band with spectral resolution ranging from 2.5 to 60 GHz, could also be hosted on the same platform. This instrument would carry out absolute measurements of the CMB spectrum with a sensitivity 4 to 5 orders of magnitude better than COBE-FIRAS.
An overview of the scientific goals of the project has been presented by Delabrouille et al. (Reference Delabrouille2019), while other white papers related to the ESA ‘Voyage 2050’Footnote a call have elaborated on specific science cases. Basu et al. (Reference Basu2019) dealt with the use of the CMB as a ‘back-light’, illuminating the entire observable Universe, thus allowing us to obtain a complete census of the total mass, gas, and stellar contents of the Cosmos across time. Silva et al. (Reference Silva2019) looked into the promise of mapping the intensity of the many mm/submm/far-infrared (far-IR) lines detectable by the proposed instrument to address several open questions relating to the reionisation process, galaxy evolution, the cosmic infrared background (CIB), and fundamental cosmology. Additionally, the unique information on the thermal history of the Universe provided by absolute spectral measurements has been highlighted by Chluba et al. (Reference Chluba2019).
Here we argue that the high-sensitivity spectroscopic and imaging surveys carried out by this space mission would revolutionise our understanding of galaxy formation and evolution and of the growth of large-scale structure back to the epoch of reionisation.
For more than 20 yr, surveys at far-IR to submm wavelengths have played a key role in our understanding of early galaxy and active galactic nuclei (AGN) evolution (for reviews, see Lutz Reference Lutz2014; Casey, Narayanan, & Cooray Reference Casey, Narayanan and Cooray2014). The SCUBA discovery of a copious population of submm-bright galaxies (Smail, Ivison, & Blain Reference Smail, Ivison and Blain1997; Barger et al. Reference Barger, Cowie, Sanders, Fulton, Taniguchi, Sato, Kawara and Okuda1998; Hughes et al. Reference Hughes1998), shown to be at high redshifts (Ivison et al. Reference Ivison, Smail, Le Borgne, Blain, Kneib, Bezecourt, Kerr and Davies1998; Barger et al. Reference Barger, Cowie, Smail, Ivison, Blain and Kneib1999; Swinbank et al. Reference Swinbank, Smail, Chapman, Blain, Ivison and Keel2004; Chapman et al. Reference Chapman, Blain, Smail and Ivison2005; Pope et al. Reference Pope2006), strongly challenged the widely accepted pictures of galaxy formation and evolution. In fact, simple merger-driven models dramatically underpredicted the abundance of bright submm galaxies and the CIB intensity, using standard assumptions for the stellar Initial Mass Function (IMF) and for the dust temperature distribution (see, e.g., Kaviani, Haehnelt, & Kauffmann Reference Kaviani, Haehnelt and Kauffmann2003; Baugh et al. Reference Baugh, Lacey, Frenk, Granato, Silva, Bressan, Benson and Cole2005; Niemi et al. Reference Niemi, Somerville, Ferguson, Huang, Lotz and Koekemoer2012; Somerville et al. Reference Somerville, Gilmore, Primack and Domnguez2012; Gruppioni et al. Reference Gruppioni2015).
The submm spectral region is exceptionally well suited to provide access to the dust-enshrouded most active star-formation phases of young galaxies in the high-z Universe. This is because, for a large redshift range, submm wavelengths (in the observer’s frame) are in the Rayleigh–Jeans region of the dust emission spectrum, where the flux density scales as  $S_\nu\propto\nu^{2+\beta}$
, the dust emissivity index,
$S_\nu\propto\nu^{2+\beta}$
, the dust emissivity index,  $\beta$
, generally being in the range 1.5–2. The corresponding so-called ‘negative K-correction’ largely compensates, and may even slightly over-compensate the decrease of the flux density with increasing luminosity distance (Franceschini et al. Reference Franceschini, Toffolatti, Mazzei, Danese and de Zotti1991; Blain & Longair Reference Blain and Longair1993), providing roughly luminosity-limited samples. Thus, dusty star-forming galaxies (DSFGs) can be detected out to
$\beta$
, generally being in the range 1.5–2. The corresponding so-called ‘negative K-correction’ largely compensates, and may even slightly over-compensate the decrease of the flux density with increasing luminosity distance (Franceschini et al. Reference Franceschini, Toffolatti, Mazzei, Danese and de Zotti1991; Blain & Longair Reference Blain and Longair1993), providing roughly luminosity-limited samples. Thus, dusty star-forming galaxies (DSFGs) can be detected out to  $z\,{\simeq}\,8$
–10 without the need for extreme sensitivities.
$z\,{\simeq}\,8$
–10 without the need for extreme sensitivities.
Ground-based observations at submm wavelengths are severely limited by water vapour in the atmosphere, leaving only a few windows even in the driest sites; hence the need for space missions. The Herschel observatory surveyed about  $1300\,\hbox{deg}^2$
of the extragalactic sky, primarily thanks to the Herschel Astrophysical Terahertz Large Area Survey (H-ATLAS; Eales et al. Reference Eales2010), to the Herschel Multi-tiered Extragalactic Survey (HerMES; Oliver et al. Reference Oliver2012) and to the Herschel Stripe 82 Survey (HerS; Viero et al. Reference Viero2014), which covered 660, 380, and
$1300\,\hbox{deg}^2$
of the extragalactic sky, primarily thanks to the Herschel Astrophysical Terahertz Large Area Survey (H-ATLAS; Eales et al. Reference Eales2010), to the Herschel Multi-tiered Extragalactic Survey (HerMES; Oliver et al. Reference Oliver2012) and to the Herschel Stripe 82 Survey (HerS; Viero et al. Reference Viero2014), which covered 660, 380, and  $79\,\hbox{deg}^2$
, respectively.
$79\,\hbox{deg}^2$
, respectively.
The Herschel surveys with the Spectral and Photometric Imaging Receiver (SPIRE), operating at 250, 350, and  $500\,\mu\text{m}$
, were confusion limited at rms values of 5.8, 6.3, and
$500\,\mu\text{m}$
, were confusion limited at rms values of 5.8, 6.3, and  $6.8\,{\rm mJy}\,{\rm beam}^{-1}$
, respectively (Nguyen et al. Reference Nguyen2010). Source confusion does not allow us to take full advantage of the sensitivity (which is close to fundamental limits) of present-day detectors. The problem can be overcome using larger telescopes, thereby providing better angular resolution, but this implies higher costs and limits on the total area that can be surveyed.
$6.8\,{\rm mJy}\,{\rm beam}^{-1}$
, respectively (Nguyen et al. Reference Nguyen2010). Source confusion does not allow us to take full advantage of the sensitivity (which is close to fundamental limits) of present-day detectors. The problem can be overcome using larger telescopes, thereby providing better angular resolution, but this implies higher costs and limits on the total area that can be surveyed.
An interesting alternative is offered by spectroscopy. Adding the third dimension essentially removes the confusion problem. The reason for this is clear—moderate resolution spectroscopy with, say,  $R\,{\equiv}\,\nu/\Delta\nu\,{=}\,300$
, apportions sources detected with broadband photometry with, e.g.,
$R\,{\equiv}\,\nu/\Delta\nu\,{=}\,300$
, apportions sources detected with broadband photometry with, e.g.,  $\Delta\nu/\nu\,{=}\,0.3$
to 100 almost equally populated narrow redshift bins, each with much lower, generally negligible, confusion noise. Precisely how to most efficiently disentangle the spectra of sources from spatially confused (but spectrally unconfused) data cubes remains an open research question (see discussion in Appendix E.1 of Meixner et al. Reference Meixner2019), but it is clear that in principle the information is there to extract.
$\Delta\nu/\nu\,{=}\,0.3$
to 100 almost equally populated narrow redshift bins, each with much lower, generally negligible, confusion noise. Precisely how to most efficiently disentangle the spectra of sources from spatially confused (but spectrally unconfused) data cubes remains an open research question (see discussion in Appendix E.1 of Meixner et al. Reference Meixner2019), but it is clear that in principle the information is there to extract.
The relatively large beam sizes of submm telescopes have another serious drawback: the difficulty in identifying multi-frequency counterparts to measure their spectroscopic redshifts. High-z DSFGs are generally very faint at other wavelengths, such as in the optical or near-IR that do not benefit from the negative K-correction (e.g., Dannerbauer et al. Reference Dannerbauer, Lehnert, Lutz, Tacconi, Bertoldi, Carilli, Genzel and Menten2002, Reference Dannerbauer, Lehnert, Lutz, Tacconi, Bertoldi, Carilli, Genzel and Menten2004; Dunlop et al. Reference Dunlop2004; Pope et al. Reference Pope, Borys, Scott, Conselice, Dickinson and Mobasher2005; Younger et al. Reference Younger2007; Dannerbauer, Walter, & Morrison Reference Dannerbauer, Walter and Morrison2008; Walter et al., Reference Walter2012). The surface densities of faint optical/near-IR sources are very high, making the identification of the correct counterpart difficult. Deep radio observations help a lot in this respect (e.g., Ivison et al. Reference Ivison2002; Dannerbauer et al. Reference Dannerbauer, Lehnert, Lutz, Tacconi, Bertoldi, Carilli, Genzel and Menten2004; Biggs, Younger, & Ivison Reference Biggs, Younger and Ivison2010). Acquiring spectroscopic redshifts through follow-up studies with mm/submm telescopes is a time-consuming process, impractical for very large galaxy samples. Although far-IR/submm surveys have discovered tens of thousands of distant DSFGs, the number of measured spectroscopic redshifts is still not more than a few hundreds (e.g., Casey et al. Reference Casey2012a, Reference Casey2012b, Bothwell et al. Reference Bothwell2013; Weiss et al. Reference Weiss2013; Danielson et al. Reference Danielson2017; Fudamoto et al. Reference Fudamoto2017; Zhang et al. Reference Zhang2018a; Neri et al. 2020). Thus, only coarse far-IR-photometric redshift estimates are generally possible for samples of several hundred to thousands of high-z IR-luminous objects.
A moderate spectral resolution ( $R\,{\simeq}\,300$
) filter-bank spectrometer at the focus of a 3-m-class telescope will yield exciting results in several areas. For definiteness, we consider a cold (8 K) telescope with a 3.5-m aperture primary (the same size as Herschel) with a secondary mirror and cold stop at 4 K and 20 dB edge taper, as proposed by Delabrouille et al. (Reference Delabrouille2019).
$R\,{\simeq}\,300$
) filter-bank spectrometer at the focus of a 3-m-class telescope will yield exciting results in several areas. For definiteness, we consider a cold (8 K) telescope with a 3.5-m aperture primary (the same size as Herschel) with a secondary mirror and cold stop at 4 K and 20 dB edge taper, as proposed by Delabrouille et al. (Reference Delabrouille2019).
This instrument would deliver unique results in many branches of astrophysics. Here we will specifically discuss its potential for
• investigating the physical processes driving the assembly of galaxies and exploring the evolution of their metal and dust content out to $z\,{\simeq}\,8$
;
$z\,{\simeq}\,8$
;• measuring the early growth (to
$z\,{\simeq}\,7$
) of large-scale structures (i.e., galaxy proto-clusters), when their member galaxies were actively star forming, and when the hot gas, making them detectable in X-rays or via the SZ effect was not necessarily in place yet.


The plan of the paper is the following. In Section 2, we give the  $5\sigma$
line-detection limits of the proposed instrument and the corresponding minimum star-formation rate (SFR), as a function of redshift, detectable in lines for the average relationship between line luminosity and SFR. In Section 3, we briefly describe our reference model and present predictions of the redshift distributions of galaxies detected in lines and of the cumulative SFR functions at various redshifts, out to
$5\sigma$
line-detection limits of the proposed instrument and the corresponding minimum star-formation rate (SFR), as a function of redshift, detectable in lines for the average relationship between line luminosity and SFR. In Section 3, we briefly describe our reference model and present predictions of the redshift distributions of galaxies detected in lines and of the cumulative SFR functions at various redshifts, out to  $z\,{\simeq}\,8$
. In Sections 4 and 5, we highlight examples of the new science enabled by these data on strongly gravitationally lensed and unlensed galaxies. In Section 6, we compare the proposed survey with those of other forthcoming or planned instruments. Section 7 discusses the potential of this project for reconstructing the full history of the most massive virialised structures in the Universe, namely galaxy clusters. Section 8 presents a comparison with cluster surveys in other wavebands. Finally, Section 9 summarises our main conclusions.
$z\,{\simeq}\,8$
. In Sections 4 and 5, we highlight examples of the new science enabled by these data on strongly gravitationally lensed and unlensed galaxies. In Section 6, we compare the proposed survey with those of other forthcoming or planned instruments. Section 7 discusses the potential of this project for reconstructing the full history of the most massive virialised structures in the Universe, namely galaxy clusters. Section 8 presents a comparison with cluster surveys in other wavebands. Finally, Section 9 summarises our main conclusions.
We adopt a flat  $\Lambda$
CDM cosmology with the latest values of the parameters derived from Planck CMB power spectra:
$\Lambda$
CDM cosmology with the latest values of the parameters derived from Planck CMB power spectra:  $H_0 =67.4\,\hbox{km}\,\hbox{s}^{-1}\, \hbox{Mpc}^{-1}$
; and
$H_0 =67.4\,\hbox{km}\,\hbox{s}^{-1}\, \hbox{Mpc}^{-1}$
; and  $\Omega_{\rm m} = 0.315$
(Planck Collaboration VI 2018).
$\Omega_{\rm m} = 0.315$
(Planck Collaboration VI 2018).
2. Line-detection limits
Table 1 shows the estimated sensitivity and the  $5\sigma$
point source and line-detection limits at a set of frequencies for a 2-yr survey of 90% of the sky with 64 polarised channelisers, covering the frequency range 100–1000 GHz with
$5\sigma$
point source and line-detection limits at a set of frequencies for a 2-yr survey of 90% of the sky with 64 polarised channelisers, covering the frequency range 100–1000 GHz with  $R\,{=}\,300$
, using close to background limited MKID detectors (we assume a conservative 30% optical efficiency, and instrumental noise matching the sky background noise). A 6-month duration survey of 5% sky is also being considered; it goes deeper by a factor of approximately
$R\,{=}\,300$
, using close to background limited MKID detectors (we assume a conservative 30% optical efficiency, and instrumental noise matching the sky background noise). A 6-month duration survey of 5% sky is also being considered; it goes deeper by a factor of approximately  $\sqrt{5}$
.
$\sqrt{5}$
.
Exploiting observations, mostly from Spitzer and Herschel, Bonato et al. (Reference Bonato2019) reported tight correlations between the main mid-IR-to-submm lines from neutral or ionised atomic gas and from molecular gas and the total IR luminosity,  $L_{\rm IR}$
(conventionally defined over 8–
$L_{\rm IR}$
(conventionally defined over 8– $1\,000\,\mu\text{m}$
), of dust heated by newly formed stars. The brightest lines detectable in the frequency range considered here are [Nii] 205.18
$1\,000\,\mu\text{m}$
), of dust heated by newly formed stars. The brightest lines detectable in the frequency range considered here are [Nii] 205.18  $\mu\text{m}$
, [Ci] 170.42
$\mu\text{m}$
, [Ci] 170.42  $\mu\text{m}$
, [Cii] 157.7
$\mu\text{m}$
, [Cii] 157.7  $\mu\text{m}$
, [Oiii] 88.36
$\mu\text{m}$
, [Oiii] 88.36  $\mu\text{m}$
, [Oi] 63.18
$\mu\text{m}$
, [Oi] 63.18  $\mu\text{m}$
, and [Oiii] 51.81
$\mu\text{m}$
, and [Oiii] 51.81  $\mu\text{m}$
.
$\mu\text{m}$
.
The line– $L_{\rm IR}$
relations obtained by Bonato et al. (Reference Bonato2019) are based on observations of dusty galaxies, for which the unabsorbed fraction of the emission from young stars is small, so that
$L_{\rm IR}$
relations obtained by Bonato et al. (Reference Bonato2019) are based on observations of dusty galaxies, for which the unabsorbed fraction of the emission from young stars is small, so that  $L_{\rm IR}$
is a measure of the total SFR. One might wonder whether the line luminosities are primarily related to
$L_{\rm IR}$
is a measure of the total SFR. One might wonder whether the line luminosities are primarily related to  $L_{\rm IR}$
or to the SFR, and an answer was provided by De Looze et al. (Reference De Looze2014). For their sample of low-metallicity galaxies with moderate dust emission, they found that [Oiii] 88.36
$L_{\rm IR}$
or to the SFR, and an answer was provided by De Looze et al. (Reference De Looze2014). For their sample of low-metallicity galaxies with moderate dust emission, they found that [Oiii] 88.36  $\mu\text{m}$
and [Oi] 63.18
$\mu\text{m}$
and [Oi] 63.18  $\mu\text{m}$
are good probes of the SFR measured through a composite tracer (GALEX FUV + Spitzer-MIPS
$\mu\text{m}$
are good probes of the SFR measured through a composite tracer (GALEX FUV + Spitzer-MIPS  $24\,\mu\text{m}$
luminosity). The case is less clear for [Cii] 157.7
$24\,\mu\text{m}$
luminosity). The case is less clear for [Cii] 157.7  $\mu\text{m}$
; however, the [Cii] emission in star-forming galaxies primarily arises from photo-dissociation regions (PDRs; Stacey et al. Reference Stacey, Hailey-Dunsheath, Ferkinhoff, Nikola, Parshley, Benford, Staguhn and Fiolet2010), although it can also come from the partly ionised interstellar medium (e.g., Sutter Reference Sutter2019). Since PDRs are heated by the UV radiation emitted by young stars, [Cii] has also been used as a measure of the SFR (e.g., Carniani et al. Reference Carniani2018). The [Cii] luminosities of the
$\mu\text{m}$
; however, the [Cii] emission in star-forming galaxies primarily arises from photo-dissociation regions (PDRs; Stacey et al. Reference Stacey, Hailey-Dunsheath, Ferkinhoff, Nikola, Parshley, Benford, Staguhn and Fiolet2010), although it can also come from the partly ionised interstellar medium (e.g., Sutter Reference Sutter2019). Since PDRs are heated by the UV radiation emitted by young stars, [Cii] has also been used as a measure of the SFR (e.g., Carniani et al. Reference Carniani2018). The [Cii] luminosities of the  $z\,{\simeq}\,6.8$
galaxies without detected far-IR emission, observed by Smit et al. (Reference Smit2018), were found to be good SFR estimators. Schaerer et al. (2020) reported no or weak evolution of the [Cii]–SFR relation over the last 13 Gyr, i.e. up to
$z\,{\simeq}\,6.8$
galaxies without detected far-IR emission, observed by Smit et al. (Reference Smit2018), were found to be good SFR estimators. Schaerer et al. (2020) reported no or weak evolution of the [Cii]–SFR relation over the last 13 Gyr, i.e. up to  $z\sim 8$
.
$z\sim 8$
.
Table 1. Sensitivity in temperature,  $\Delta T$
(in units of temperature times square root of solid angle), point source detection limits,
$\Delta T$
(in units of temperature times square root of solid angle), point source detection limits,  $S_{\rm lim}$
, and line-detection limits,
$S_{\rm lim}$
, and line-detection limits,  $\log(F_{\rm lim})$
, at selected frequencies,
$\log(F_{\rm lim})$
, at selected frequencies,  $\nu$
, (or wavelengths
$\nu$
, (or wavelengths  $\lambda$
) for a 2-yr survey of 90% of the sky with the instrument described in the text. Both
$\lambda$
) for a 2-yr survey of 90% of the sky with the instrument described in the text. Both  $S_{\rm lim}$
and
$S_{\rm lim}$
and  $F_{\rm lim}$
are at the
$F_{\rm lim}$
are at the  $5\sigma$
significance level. The angular resolution of the instrument, measured by the FWHM (full width at half maximum of the beam) at each frequency, is at the diffraction limit.
$5\sigma$
significance level. The angular resolution of the instrument, measured by the FWHM (full width at half maximum of the beam) at each frequency, is at the diffraction limit.

Based on these results, following Bonato et al. (Reference Bonato2019), we assume that the luminosity of far-IR fine-structure lines primarily correlates with the SFR. Thus, the relations derived by Bonato et al. (Reference Bonato2019) allow us to estimate the values of SFR as a function of z corresponding to the  $5\sigma$
line-detection limits listed in Table 1. The results are shown in Figure 1, where the solid black line refers to the survey of 90% of the sky (the ‘all-sky’ survey), while the dotted blue line refers to the deep survey of 5% of the sky. At each redshift, we have computed the minimum SFR detectable in the various lines and taken the smallest one.
$5\sigma$
line-detection limits listed in Table 1. The results are shown in Figure 1, where the solid black line refers to the survey of 90% of the sky (the ‘all-sky’ survey), while the dotted blue line refers to the deep survey of 5% of the sky. At each redshift, we have computed the minimum SFR detectable in the various lines and taken the smallest one.

Figure 1. Left: Minimum SFR as a function of redshift, for galaxies detected in lines in the 100–1 000 GHz range in an ‘all-sky’ survey (2 yr, 90% of the sky, solid black line) and for a deep survey 6-month duration over 5% of the sky (dotted blue line); see text for details. The scale on the right refers to the bolometric luminosity due to star formation,  $L_{\rm SFR}$
, based on the calibration by Kennicutt & Evans (Reference Kennicutt and Evans2012). The solid red line, the green dot-dashed line, and the magenta dashed line show, for comparison, the IR (8–
$L_{\rm SFR}$
, based on the calibration by Kennicutt & Evans (Reference Kennicutt and Evans2012). The solid red line, the green dot-dashed line, and the magenta dashed line show, for comparison, the IR (8– $1\,000\,\mu\text{m}$
) luminosity,
$1\,000\,\mu\text{m}$
) luminosity,  $L_{\rm IR}$
, corresponding to the
$L_{\rm IR}$
, corresponding to the  $4\sigma$
detection limits (approximately 90% completeness) of the H-ATLAS survey covering
$4\sigma$
detection limits (approximately 90% completeness) of the H-ATLAS survey covering  $660\,\hbox{deg}^2$
, to confusion limit of the CMB-S4 survey at 220 GHz expected to cover 43% of the sky (5 mJy; Abazajian et al. Reference Abazajian2019), and to the 90% completeness limit (15 mJy) of the South Pole Telescope (SPT; Mocanu et al. Reference Mocanu2013) survey covering
$660\,\hbox{deg}^2$
, to confusion limit of the CMB-S4 survey at 220 GHz expected to cover 43% of the sky (5 mJy; Abazajian et al. Reference Abazajian2019), and to the 90% completeness limit (15 mJy) of the South Pole Telescope (SPT; Mocanu et al. Reference Mocanu2013) survey covering  $2,500\,\hbox{deg}^2$
, respectively. Here
$2,500\,\hbox{deg}^2$
, respectively. Here  $L_{\rm IR}$
is a measure of the dust-obscured SFR. Right: Minimum
$L_{\rm IR}$
is a measure of the dust-obscured SFR. Right: Minimum  $L_{\rm SFR}$
(or SFR) corresponding to the
$L_{\rm SFR}$
(or SFR) corresponding to the  $5\sigma$
detection limits of the brightest IR/submm lines over the 100–1 000 GHz range, for the ‘all-sky’ survey.
$5\sigma$
detection limits of the brightest IR/submm lines over the 100–1 000 GHz range, for the ‘all-sky’ survey.
Our calculations assume that the lines are unresolved at  $R=300$
, corresponding to line widths of
$R=300$
, corresponding to line widths of  $1,000\,\hbox{km}\,\hbox{s}^{-1}$
. This is almost always the case for individual galaxies. The spectroscopy of 15 H-ATLAS galaxies at
$1,000\,\hbox{km}\,\hbox{s}^{-1}$
. This is almost always the case for individual galaxies. The spectroscopy of 15 H-ATLAS galaxies at  $2.08< z < 4.05$
obtained by Neri et al. (2020) with the IRAM NOrthern Extended Millimetre Array (NOEMA) yielded line widths (FWHM) between 150 and
$2.08< z < 4.05$
obtained by Neri et al. (2020) with the IRAM NOrthern Extended Millimetre Array (NOEMA) yielded line widths (FWHM) between 150 and  $1\,100\,\hbox{km}\,\hbox{s}^{-1}$
(mean
$1\,100\,\hbox{km}\,\hbox{s}^{-1}$
(mean  $700\pm 300\,\hbox{km}\,\hbox{s}^{-1}$
, median
$700\pm 300\,\hbox{km}\,\hbox{s}^{-1}$
, median  $800\,\hbox{km}\,\hbox{s}^{-1}$
). The [Cii] 157.7
$800\,\hbox{km}\,\hbox{s}^{-1}$
). The [Cii] 157.7  $\mu\text{m}$
observations by Gullberg et al. (Reference Gullberg2015) of 16 spectrally resolved strongly lensed star-forming galaxies at
$\mu\text{m}$
observations by Gullberg et al. (Reference Gullberg2015) of 16 spectrally resolved strongly lensed star-forming galaxies at  $3.0 < z < 5.7$
yielded line FWHMs ranging from
$3.0 < z < 5.7$
yielded line FWHMs ranging from  $198\pm 34$
to
$198\pm 34$
to  $800\pm 200\,\hbox{km}\,\hbox{s}^{-1}$
with a median of
$800\pm 200\,\hbox{km}\,\hbox{s}^{-1}$
with a median of  $\simeq541\pm 110\,\hbox{km}\,\hbox{s}^{-1}$
. Nesvadba et al. (Reference Nesvadba, Cañameras, Kneissl, Koenig, Yang, Le Floc’h, Omont and Scott2019) measured the FWHMs of the [Oi]
$\simeq541\pm 110\,\hbox{km}\,\hbox{s}^{-1}$
. Nesvadba et al. (Reference Nesvadba, Cañameras, Kneissl, Koenig, Yang, Le Floc’h, Omont and Scott2019) measured the FWHMs of the [Oi]  $370.42\,\mu\text{m}$
and
$370.42\,\mu\text{m}$
and  $609.14\,\mu\text{m}$
lines in the range from
$609.14\,\mu\text{m}$
lines in the range from  $220\pm 21$
to
$220\pm 21$
to  $639\pm 100\,\hbox{km}\,\hbox{s}^{-1}$
(median
$639\pm 100\,\hbox{km}\,\hbox{s}^{-1}$
(median  $475\,\hbox{km}\,\hbox{s}^{-1}$
) for 11 strongly lensed submm galaxies detected by Planck. Similar values (from
$475\,\hbox{km}\,\hbox{s}^{-1}$
) for 11 strongly lensed submm galaxies detected by Planck. Similar values (from  $220\pm 50$
to
$220\pm 50$
to  $770\pm80\,\hbox{km}\,\hbox{s}^{-1}$
, median
$770\pm80\,\hbox{km}\,\hbox{s}^{-1}$
, median  $370\,\hbox{km}\,\hbox{s}^{-1}$
) were measured by Cooke et al. (Reference Cooke2018) for 10 serendipitous [Cii]
$370\,\hbox{km}\,\hbox{s}^{-1}$
) were measured by Cooke et al. (Reference Cooke2018) for 10 serendipitous [Cii] $157.7\,\mu\text{m}$
emitters at
$157.7\,\mu\text{m}$
emitters at  $z\sim 4.5$
.
$z\sim 4.5$
.
A somewhat lower median FWHM ( $252\,\hbox{km}\,\hbox{s}^{-1}$
) was reported by Bethermin et al. (Reference Bethermin2020) for 75 ALPINE-ALMA large programme targets at
$252\,\hbox{km}\,\hbox{s}^{-1}$
) was reported by Bethermin et al. (Reference Bethermin2020) for 75 ALPINE-ALMA large programme targets at  $4.4 < z <5.9$
, detected in the [Cii] 157.7
$4.4 < z <5.9$
, detected in the [Cii] 157.7  $\mu\text{m}$
line. These targets have substantially lower SFRs than the strongly lensed galaxies observed by Gullberg et al. (Reference Gullberg2015) and Nesvadba et al. (Reference Nesvadba, Cañameras, Kneissl, Koenig, Yang, Le Floc’h, Omont and Scott2019). A result close to that by Bethermin et al. (Reference Bethermin2020) was found by Fujimoto et al. (Reference Fujimoto2019) for a sample of 18 galaxies at a higher mean redshift (
$\mu\text{m}$
line. These targets have substantially lower SFRs than the strongly lensed galaxies observed by Gullberg et al. (Reference Gullberg2015) and Nesvadba et al. (Reference Nesvadba, Cañameras, Kneissl, Koenig, Yang, Le Floc’h, Omont and Scott2019). A result close to that by Bethermin et al. (Reference Bethermin2020) was found by Fujimoto et al. (Reference Fujimoto2019) for a sample of 18 galaxies at a higher mean redshift ( $5.153\le z \le 7.142$
): the weighted average FWHM of the [Cii] 157.7
$5.153\le z \le 7.142$
): the weighted average FWHM of the [Cii] 157.7  $\mu\text{m}$
line for their sample is
$\mu\text{m}$
line for their sample is  $270\,\hbox{km}\,\hbox{s}^{-1}$
.
$270\,\hbox{km}\,\hbox{s}^{-1}$
.
At still higher redshifts, Tamura et al. (Reference Tamura2019) and Hashimoto et al. (Reference Hashimoto2018) reported lower FWHMs of the [Oiii] 88.36  $\mu\text{m}$
line for galaxies at
$\mu\text{m}$
line for galaxies at  $z=8.31$
(
$z=8.31$
( $141\pm 21\,\hbox{km}\,\hbox{s}^{-1}$
) and at
$141\pm 21\,\hbox{km}\,\hbox{s}^{-1}$
) and at  $z=9.11$
(
$z=9.11$
( $154\pm39\,\hbox{km}\,\hbox{s}^{-1}$
), respectively. An even lower line width (
$154\pm39\,\hbox{km}\,\hbox{s}^{-1}$
), respectively. An even lower line width ( $\simeq43\,\hbox{km}\,\hbox{s}^{-1}$
) was derived by Laporte et al. (Reference Laporte2017) for a galaxy at
$\simeq43\,\hbox{km}\,\hbox{s}^{-1}$
) was derived by Laporte et al. (Reference Laporte2017) for a galaxy at  $z=8.38$
.
$z=8.38$
.
Thus, for ultraluminous submm galaxies the signal dilution due to the modest spectral resolution of the instrument is moderate, up to  $z\simeq 5$
–6, while it is stronger at higher z and at lower luminosities.
$z\simeq 5$
–6, while it is stronger at higher z and at lower luminosities.
The information on the velocity dispersion of galaxies in high-z proto-cluster cores of submm galaxies is still very limited. Hill et al. (2020) estimated a line-of-sight velocity dispersion  $\sigma_r=376\pm68\,\hbox{km}\,\hbox{s}^{-1}$
for the
$\sigma_r=376\pm68\,\hbox{km}\,\hbox{s}^{-1}$
for the  $z=4.3$
proto-cluster core discovered by Miller et al. (Reference Miller2018). Oteo et al. (Reference Oteo2018) found a substantially higher
$z=4.3$
proto-cluster core discovered by Miller et al. (Reference Miller2018). Oteo et al. (Reference Oteo2018) found a substantially higher  $\sigma_r$
(
$\sigma_r$
( $794\pm 68\,\hbox{km}\,\hbox{s}^{-1}$
) for their
$794\pm 68\,\hbox{km}\,\hbox{s}^{-1}$
) for their  $z=4.0$
proto-cluster core. However, they argued that the detected galaxies actually belong to two groups, each with a much lower
$z=4.0$
proto-cluster core. However, they argued that the detected galaxies actually belong to two groups, each with a much lower  $\sigma_r$
. Venemans et al. (Reference Venemans2007) measured velocity dispersions of forming clusters of galaxies near powerful radio galaxies at
$\sigma_r$
. Venemans et al. (Reference Venemans2007) measured velocity dispersions of forming clusters of galaxies near powerful radio galaxies at  $2.0 < z < 5.2$
. They found that
$2.0 < z < 5.2$
. They found that  $\sigma_r$
increases from
$\sigma_r$
increases from  $\sim300\,\hbox{km}\,\hbox{s}^{-1}$
at
$\sim300\,\hbox{km}\,\hbox{s}^{-1}$
at  $z>4$
to 500–
$z>4$
to 500– $700\,\hbox{km}\,\hbox{s}^{-1}$
at
$700\,\hbox{km}\,\hbox{s}^{-1}$
at  $z \sim 3$
. In the two lowest redshift fields (
$z \sim 3$
. In the two lowest redshift fields ( $z=2.86$
and
$z=2.86$
and  $2.16$
), the velocity distribution is bimodal, indicating the presence of subgroups with
$2.16$
), the velocity distribution is bimodal, indicating the presence of subgroups with  $\sigma_r=200$
–
$\sigma_r=200$
– $500\,\hbox{km}\,\hbox{s}^{-1}$
. This shows that, on the one side, the lines from the spatially unresolved cluster cores are spectrally unresolved except at the lowest redshifts and, on the other hand, that the signal dilution is expected to be from moderate to low.
$500\,\hbox{km}\,\hbox{s}^{-1}$
. This shows that, on the one side, the lines from the spatially unresolved cluster cores are spectrally unresolved except at the lowest redshifts and, on the other hand, that the signal dilution is expected to be from moderate to low.
The results for the brightest lines are shown in the right-hand panel of Figure 1. The best lines are [Ci] 170.42  $\mu\text{m}$
for
$\mu\text{m}$
for  $z\,\lesssim\,0.5$
, [Nii] 205.18
$z\,\lesssim\,0.5$
, [Nii] 205.18  $\mu\text{m}$
for
$\mu\text{m}$
for  $0.5\,\lesssim\,z\,\lesssim\,0.9$
, [Cii] 157.7
$0.5\,\lesssim\,z\,\lesssim\,0.9$
, [Cii] 157.7  $\mu\text{m}$
for
$\mu\text{m}$
for  $0.9\,\lesssim\,z\,\lesssim\,3.4$
, [Oiii] 88.36
$0.9\,\lesssim\,z\,\lesssim\,3.4$
, [Oiii] 88.36  $\mu\text{m}$
for
$\mu\text{m}$
for  $3.4\,\lesssim\,z\,\lesssim\,4.8$
, and [Oiii] 51.81
$3.4\,\lesssim\,z\,\lesssim\,4.8$
, and [Oiii] 51.81  $\mu\text{m}$
for
$\mu\text{m}$
for  $z\,\gtrsim\,4.8$
.
$z\,\gtrsim\,4.8$
.
The right-hand panel of Figure 1 shows that the detection limits for [Cii] 157.7  $\mu\text{m}$
, [Oiii] 88.36
$\mu\text{m}$
, [Oiii] 88.36  $\mu\text{m}$
, [Oi] 63.18
$\mu\text{m}$
, [Oi] 63.18  $\mu\text{m}$
, and [Oiii] 51.81
$\mu\text{m}$
, and [Oiii] 51.81  $\mu\text{m}$
correspond to values of SFR that are quite close to each other. Hence a substantial fraction of galaxies will be detected both in the [Cii] 157.7
$\mu\text{m}$
correspond to values of SFR that are quite close to each other. Hence a substantial fraction of galaxies will be detected both in the [Cii] 157.7  $\mu\text{m}$
and [Oiii] 88.36
$\mu\text{m}$
and [Oiii] 88.36  $\mu\text{m}$
lines for
$\mu\text{m}$
lines for  $z\,\gtrsim\,2.4$
(when the second line shows up at
$z\,\gtrsim\,2.4$
(when the second line shows up at  $\nu\,{<}\,1000\,$
GHz). The [Oi] 63.18
$\nu\,{<}\,1000\,$
GHz). The [Oi] 63.18  $\mu\text{m}$
and [Oiii] 51.81
$\mu\text{m}$
and [Oiii] 51.81  $\mu\text{m}$
lines come in at
$\mu\text{m}$
lines come in at  $z\,{\ge}\,3.7$
and
$z\,{\ge}\,3.7$
and  $z\,{\ge}\,4.8$
, respectively.
$z\,{\ge}\,4.8$
, respectively.
For comparison, the solid red line in the left-hand panel of Figure 1 also shows the minimum  $L_{\rm IR}$
, or the minimum dust-enshrouded SFR, among those corresponding to the
$L_{\rm IR}$
, or the minimum dust-enshrouded SFR, among those corresponding to the  $4\sigma$
detection limits of the H-ATLAS survey (the largest extragalactic survey with Herschel, having sensitivities of 29.4, 37.4, and 40.6 mJy at 250, 350, and
$4\sigma$
detection limits of the H-ATLAS survey (the largest extragalactic survey with Herschel, having sensitivities of 29.4, 37.4, and 40.6 mJy at 250, 350, and  $500\,\mu\text{m}$
, respectively; Valiante et al. Reference Valiante2016). The monochromatic luminosities corresponding to these detection limits have been converted to
$500\,\mu\text{m}$
, respectively; Valiante et al. Reference Valiante2016). The monochromatic luminosities corresponding to these detection limits have been converted to  $L_{\rm IR}$
using the spectral energy distributions (SEDs) adopted by Cai et al. (Reference Cai2013). More precisely, for
$L_{\rm IR}$
using the spectral energy distributions (SEDs) adopted by Cai et al. (Reference Cai2013). More precisely, for  $z\,{<}\,1.5$
we have used the ‘warm’ (starburst) SED and at
$z\,{<}\,1.5$
we have used the ‘warm’ (starburst) SED and at  $z\,{>}\,2$
the ‘proto-spheroidal’ SED; at intermediate redshifts, we considered both SEDs and chose the more favourable one, i.e., the one yielding the lower
$z\,{>}\,2$
the ‘proto-spheroidal’ SED; at intermediate redshifts, we considered both SEDs and chose the more favourable one, i.e., the one yielding the lower  $L_{\rm IR}$
. Since the submm continuum measures only the light re-emitted by dust, while the fine-structure lines measure the total SFR, the comparison of the two measurements, both made by the proposed instrument, provides information on the effective optical depths of galaxies.
$L_{\rm IR}$
. Since the submm continuum measures only the light re-emitted by dust, while the fine-structure lines measure the total SFR, the comparison of the two measurements, both made by the proposed instrument, provides information on the effective optical depths of galaxies.
3. SFR functions and redshift distributions
To investigate quantitatively the discovery potential of the proposed spectroscopic survey, the relationships between line luminosity and SFR need to be coupled with a model for the redshift-dependent SFR function. We adopted the physically grounded model by Cai et al. (Reference Cai2013). This model is built on the consideration that, in the local Universe, spheroids (i.e., ellipticals and bulges of disc galaxies) are mostly inhabited by old stellar populations (formation redshifts  $z\gtrsim 1$
–1.5), while the populations of disc galaxies are generally younger, with luminosity-weighted ages mostly
$z\gtrsim 1$
–1.5), while the populations of disc galaxies are generally younger, with luminosity-weighted ages mostly  $\lesssim 7\,$
Gyr (cf., e.g., Bernardi et al. Reference Bernardi, Shankar, Hyde, Mei, Marulli and Sheth2010), corresponding to formation redshifts
$\lesssim 7\,$
Gyr (cf., e.g., Bernardi et al. Reference Bernardi, Shankar, Hyde, Mei, Marulli and Sheth2010), corresponding to formation redshifts  $z\lesssim 1$
. Thus, spheroid progenitors (referred to as proto-spheroids or proto-spheroidal galaxies) are the dominant star-forming population at
$z\lesssim 1$
. Thus, spheroid progenitors (referred to as proto-spheroids or proto-spheroidal galaxies) are the dominant star-forming population at  $z\gtrsim 1.5$
, whereas most of the star formation at
$z\gtrsim 1.5$
, whereas most of the star formation at  $z\lesssim 1.5$
occurs in discs.
$z\lesssim 1.5$
occurs in discs.
These different evolutionary histories are dealt with adopting a ‘hybrid’ approach. The model provides a physically grounded description of the redshift-dependent co-evolution of the SFR of proto-spheroidal galaxies and of the active nuclei at their centres, while the description of the evolution of late-type galaxies and of AGN associated with them is phenomenological and parametric.
The calculation of the evolving SFR function of proto-spheroids hinges upon the halo formation rate as a function of redshift, z, and of halo mass,  $M_{\rm{H}}$
, provided by large-scale N-body simulations. The analytical approximation of the halo mass function,
$M_{\rm{H}}$
, provided by large-scale N-body simulations. The analytical approximation of the halo mass function,  $N(M_{\rm H},z)$
, derived by Sheth & Tormen (Reference Sheth and Tormen1999) was used. The positive term of its time derivative was adopted as a good approximation of the halo formation rate. High resolution N-body simulations (e.g., Wang et al. Reference Wang2011) showed that, after a fast collapse phase, including major mergers, the halo growth (mostly by minor mergers and diffuse accretion) mainly affects the halo outskirts and has little impact on the inner potential well where the visible galaxy resides. Based on these results, the model assumes that the main drivers of star formation and AGN growth are in situ processes. The star-formation history of proto-spheroids is computed by solving a set of equations describing the evolution of gas phases and of the active nucleus, including cooling, condensation into stars, radiation drag, accretion, and feedback from supernovae and from the AGN.
$N(M_{\rm H},z)$
, derived by Sheth & Tormen (Reference Sheth and Tormen1999) was used. The positive term of its time derivative was adopted as a good approximation of the halo formation rate. High resolution N-body simulations (e.g., Wang et al. Reference Wang2011) showed that, after a fast collapse phase, including major mergers, the halo growth (mostly by minor mergers and diffuse accretion) mainly affects the halo outskirts and has little impact on the inner potential well where the visible galaxy resides. Based on these results, the model assumes that the main drivers of star formation and AGN growth are in situ processes. The star-formation history of proto-spheroids is computed by solving a set of equations describing the evolution of gas phases and of the active nucleus, including cooling, condensation into stars, radiation drag, accretion, and feedback from supernovae and from the AGN.
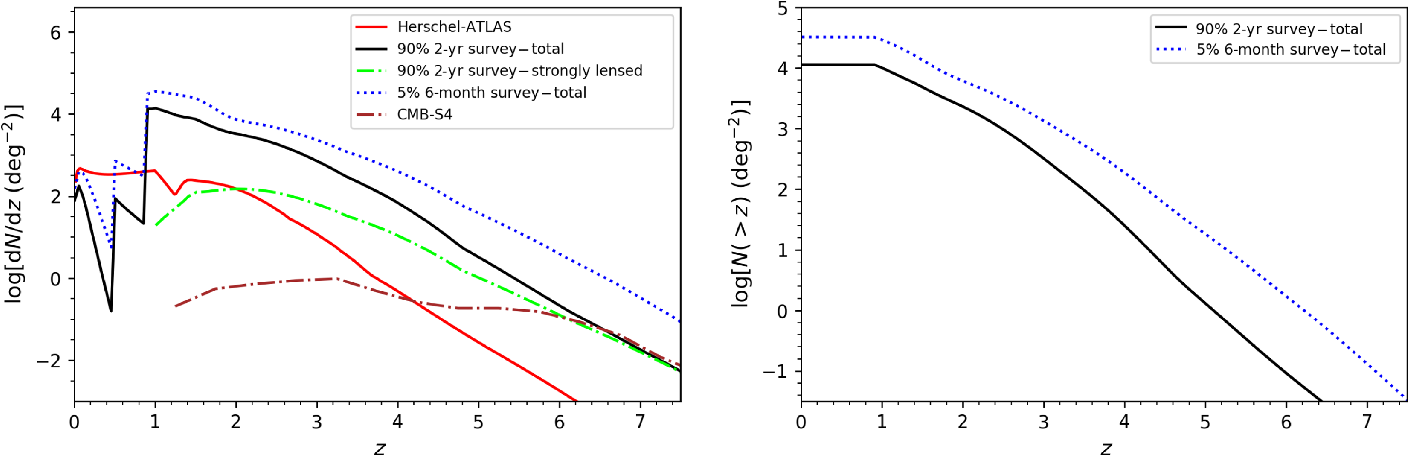
Figure 2. Left: Predicted differential redshift distributions of galaxies detected in at least one line by the ‘all-sky’ survey (2 yr, 90% of the sky, with the solid black line being the total and the dot-dashed green line being for strongly lensed galaxies) and by the ‘deep’ survey (6 months, 5% of the sky, with the dotted blue line showing the total distribution). For comparison, the solid red line shows the estimated redshift distribution of galaxies detected by the H-ATLAS survey over  $660\,\hbox{deg}^2$
above the
$660\,\hbox{deg}^2$
above the  $4\sigma$
limit in at least one SPIRE channel, based on the Cai et al. (Reference Cai2013) model. The dot-dashed brown line shows the predicted redshift distribution at the confusion limit of the CMB-S4 survey (with an expected sky coverage of 43%), derived from the cumulative distribution in Figure 26 of the CMB-S4 Science Case paper (Abazajian et al. Reference Abazajian2019). Right: Total cumulative redshift distributions for the ‘all-sky’ and for the ‘deep’ survey (solid black line and dotted blue lines, respectively).
$4\sigma$
limit in at least one SPIRE channel, based on the Cai et al. (Reference Cai2013) model. The dot-dashed brown line shows the predicted redshift distribution at the confusion limit of the CMB-S4 survey (with an expected sky coverage of 43%), derived from the cumulative distribution in Figure 26 of the CMB-S4 Science Case paper (Abazajian et al. Reference Abazajian2019). Right: Total cumulative redshift distributions for the ‘all-sky’ and for the ‘deep’ survey (solid black line and dotted blue lines, respectively).
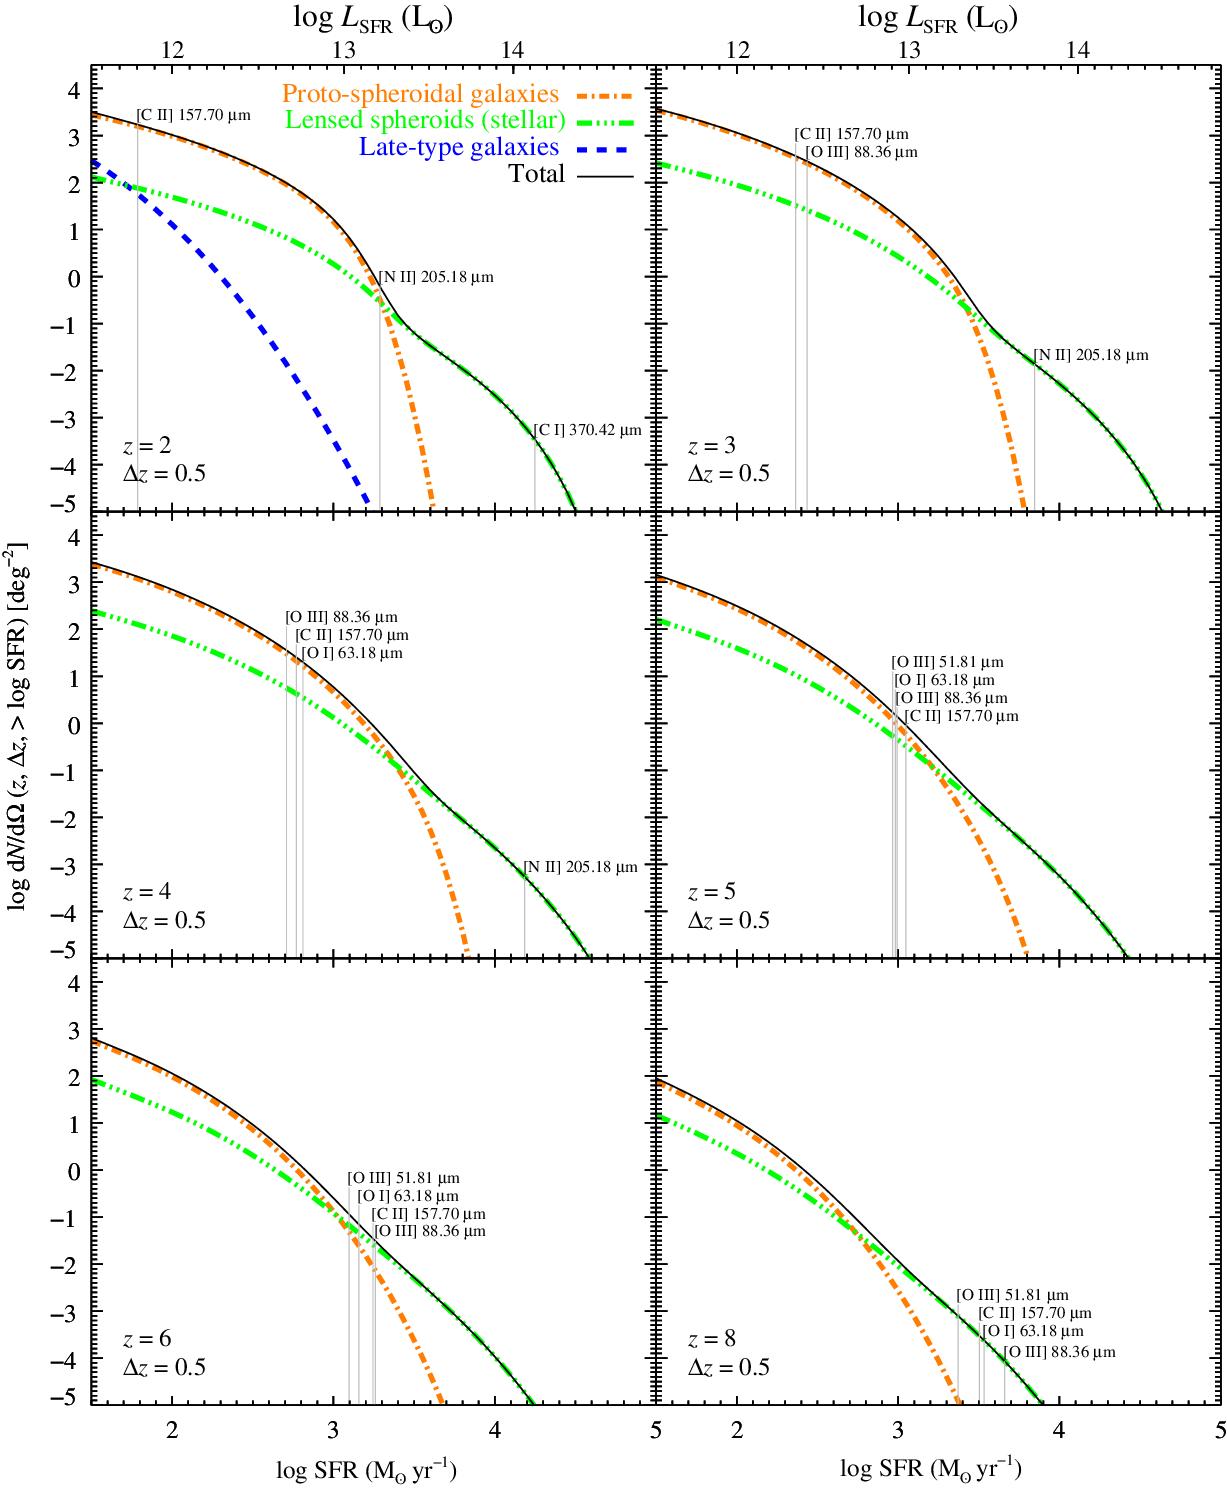
Figure 3. Cumulative SFR functions of galaxies within  $\delta z= 0.5$
derived from the Cai et al. (Reference Cai2013) model at redshifts from 2 to 8. The vertical lines show the SFRs corresponding to the
$\delta z= 0.5$
derived from the Cai et al. (Reference Cai2013) model at redshifts from 2 to 8. The vertical lines show the SFRs corresponding to the  $5\sigma$
line-detection limits of the brightest lines.
$5\sigma$
line-detection limits of the brightest lines.
Solving these equations, we obtain the SFR of each galaxy and the bolometric luminosity of the AGN as a function of halo mass, formation redshift, and galactic age. Coupling the  $\hbox{SFR}(M_{\rm H},z)$
with the halo formation rate we get the SFR function of proto-spheroids at any redshift. As for late-type galaxies, Cai et al. (Reference Cai2013) adopted a phenomenological evolutionary model, with different parameters for starburst and ‘normal’ disc galaxies. The global (proto-spheroids plus late-type galaxies) SFR functions yielded by the model are in excellent agreement with observational determinations obtained combining information from far-IR/submm, UV, and Ly
$\hbox{SFR}(M_{\rm H},z)$
with the halo formation rate we get the SFR function of proto-spheroids at any redshift. As for late-type galaxies, Cai et al. (Reference Cai2013) adopted a phenomenological evolutionary model, with different parameters for starburst and ‘normal’ disc galaxies. The global (proto-spheroids plus late-type galaxies) SFR functions yielded by the model are in excellent agreement with observational determinations obtained combining information from far-IR/submm, UV, and Ly $\alpha$
surveys (Cai et al. Reference Cai, Lapi, Bressan, De Zotti, Negrello and Danese2014; Mancuso et al. Reference Mancuso2015). Therefore, the results based on them are essentially model independent.
$\alpha$
surveys (Cai et al. Reference Cai, Lapi, Bressan, De Zotti, Negrello and Danese2014; Mancuso et al. Reference Mancuso2015). Therefore, the results based on them are essentially model independent.
Figures 2 and 3 show that the spectroscopic survey will allow us to extend the study of the global star-formation history and the build-up of metals and dust all the way through the epoch of reionisation. The survey will detect thousands of star-forming galaxies at  $z\,{\simeq}\,6$
and several tens at
$z\,{\simeq}\,6$
and several tens at  $z\,{\simeq}\,8$
. Note that the predicted abundances of high-z galaxies reported in these figures may be underestimated if the stellar IMF becomes more top-heavy (i.e., has a larger fraction of massive stars compared to standard IMFs) at high-z, as suggested by theoretical arguments (e.g., Papadopoulos et al. Reference Papadopoulos, Thi, Miniati and Viti2011) and indicated by some observational evidence (Zhang et al. Reference Zhang, Romano, Ivison, Papadopoulos and Matteucci2018b). A more top-heavy IMF would yield higher surface densities of ultra-luminous high-z galaxies. An excess of
$z\,{\simeq}\,8$
. Note that the predicted abundances of high-z galaxies reported in these figures may be underestimated if the stellar IMF becomes more top-heavy (i.e., has a larger fraction of massive stars compared to standard IMFs) at high-z, as suggested by theoretical arguments (e.g., Papadopoulos et al. Reference Papadopoulos, Thi, Miniati and Viti2011) and indicated by some observational evidence (Zhang et al. Reference Zhang, Romano, Ivison, Papadopoulos and Matteucci2018b). A more top-heavy IMF would yield higher surface densities of ultra-luminous high-z galaxies. An excess of  $z\,\gtrsim\,4$
dusty galaxies over model expectations has been reported, but the issue is controversial (see Cai et al. Reference Cai, De Zotti and Bonato2020, for a recent discussion and references).
$z\,\gtrsim\,4$
dusty galaxies over model expectations has been reported, but the issue is controversial (see Cai et al. Reference Cai, De Zotti and Bonato2020, for a recent discussion and references).
The excellent sensitivity of the instrument, the high luminosity of the [Cii] 157.7  $\mu\text{m}$
, [Oiii] 88.36
$\mu\text{m}$
, [Oiii] 88.36  $\mu\text{m}$
, [Oi] 63.18
$\mu\text{m}$
, [Oi] 63.18  $\mu\text{m}$
, and [Oiii] 51.81
$\mu\text{m}$
, and [Oiii] 51.81  $\mu\text{m}$
lines, and the immunity to the confusion limit make the spectroscopic survey far more efficient than broadband surveys at detecting high-z star-forming galaxies. This is illustrated by the comparison with the estimated redshift distribution of H-ATLAS galaxies.
$\mu\text{m}$
lines, and the immunity to the confusion limit make the spectroscopic survey far more efficient than broadband surveys at detecting high-z star-forming galaxies. This is illustrated by the comparison with the estimated redshift distribution of H-ATLAS galaxies.
The redshift distribution of the spectroscopic survey (Figure 2) peaks at  $z\,{\simeq}\,1$
–1.5. The brightest line within the frequency range covered by the instrument varies with redshift (see the right-hand panel of Figure 1). These variations produce the indentations at low z and the secondary peak at
$z\,{\simeq}\,1$
–1.5. The brightest line within the frequency range covered by the instrument varies with redshift (see the right-hand panel of Figure 1). These variations produce the indentations at low z and the secondary peak at  $z\simeq 0.6$
. The solid red line shows, for comparison, the estimated redshift distribution of galaxies detected by the H-ATLAS survey above the
$z\simeq 0.6$
. The solid red line shows, for comparison, the estimated redshift distribution of galaxies detected by the H-ATLAS survey above the  $4\sigma$
limit in at least one SPIRE channel (based on the Cai et al. Reference Cai2013 model). The dip at
$4\sigma$
limit in at least one SPIRE channel (based on the Cai et al. Reference Cai2013 model). The dip at  $z\,{\simeq}\,1.5$
corresponds to the change of the dominant star-forming population: late-type plus starburst galaxies and proto-spheroidal galaxies at lower and higher redshifts, respectively.
$z\,{\simeq}\,1.5$
corresponds to the change of the dominant star-forming population: late-type plus starburst galaxies and proto-spheroidal galaxies at lower and higher redshifts, respectively.
4. Strongly lensed galaxies
Figures 2 and 3 also show that most spectroscopically detected  $z\,\gtrsim\,4$
galaxies and the brightest galaxies at lower redshifts are strongly lensed (see discussions in Perrotta et al. Reference Perrotta, Baccigalupi, Bartelmann, De Zotti and Granato2002; Negrello et al. Reference Negrello, Perrotta, González-Nuevo, Silva, de Zotti, Granato, Baccigalupi and Danese2007; Paciga, Scott, & Chapin Reference Paciga, Scott and Chapin2009; Lima et al. Reference Lima, Jain and Devlin2010). The availability of large samples of strongly lensed galaxies out to high redshifts will drive a real breakthrough in the study of the early evolutionary phases of galaxies. The Herschel surveys H-ATLAS and HerMES, the Planck all-sky survey, and the SPT survey have already provided several hundreds of lensed galaxy candidates, with painstaking follow-up campaigns worldwide and at all wavelengths (e.g., Negrello et al. Reference Negrello2010, Reference Negrello2014, Reference Negrello2017a; Lupu et al. Reference Lupu2012; Vieira et al. Reference Vieira2013; Wardlow et al. Reference Wardlow2013; Hezaveh et al. Reference Hezaveh2013; Cañameras et al. Reference Cañameras2015; Harrington et al. Reference Harrington2016; Nayyeri et al. Reference Nayyeri2016; Díaz-Sanchez et al. Reference Díaz-Sanchez, Iglesias-Groth, Rebolo and Dannerbauer2017; Yang et al. Reference Yang2017; Bakx et al. Reference Bakx2018; Harrington et al. Reference Harrington2018; Massardi et al. Reference Massardi2018; Dannerbauer et al. Reference Dannerbauer, Harrington, Daz-Sánchez, Iglesias-Groth, Rebolo, Genova-Santos and Krips2019b).
$z\,\gtrsim\,4$
galaxies and the brightest galaxies at lower redshifts are strongly lensed (see discussions in Perrotta et al. Reference Perrotta, Baccigalupi, Bartelmann, De Zotti and Granato2002; Negrello et al. Reference Negrello, Perrotta, González-Nuevo, Silva, de Zotti, Granato, Baccigalupi and Danese2007; Paciga, Scott, & Chapin Reference Paciga, Scott and Chapin2009; Lima et al. Reference Lima, Jain and Devlin2010). The availability of large samples of strongly lensed galaxies out to high redshifts will drive a real breakthrough in the study of the early evolutionary phases of galaxies. The Herschel surveys H-ATLAS and HerMES, the Planck all-sky survey, and the SPT survey have already provided several hundreds of lensed galaxy candidates, with painstaking follow-up campaigns worldwide and at all wavelengths (e.g., Negrello et al. Reference Negrello2010, Reference Negrello2014, Reference Negrello2017a; Lupu et al. Reference Lupu2012; Vieira et al. Reference Vieira2013; Wardlow et al. Reference Wardlow2013; Hezaveh et al. Reference Hezaveh2013; Cañameras et al. Reference Cañameras2015; Harrington et al. Reference Harrington2016; Nayyeri et al. Reference Nayyeri2016; Díaz-Sanchez et al. Reference Díaz-Sanchez, Iglesias-Groth, Rebolo and Dannerbauer2017; Yang et al. Reference Yang2017; Bakx et al. Reference Bakx2018; Harrington et al. Reference Harrington2018; Massardi et al. Reference Massardi2018; Dannerbauer et al. Reference Dannerbauer, Harrington, Daz-Sánchez, Iglesias-Groth, Rebolo, Genova-Santos and Krips2019b).
Strong lensing not only boosts the observed global flux by a factor  $\mu$
but also increases the angular sizes of galaxies by an average factor of
$\mu$
but also increases the angular sizes of galaxies by an average factor of  $\mu^{1/2}$
. Since the magnification
$\mu^{1/2}$
. Since the magnification  $\mu$
can be several tens, the expansion of the image can be quite substantial. The study in great detail of the internal structure and kinematics of galaxies will then become accessible to high resolution instruments like ALMA or the James Webb Space Telescope (JWST).
$\mu$
can be several tens, the expansion of the image can be quite substantial. The study in great detail of the internal structure and kinematics of galaxies will then become accessible to high resolution instruments like ALMA or the James Webb Space Telescope (JWST).
A spectacular demonstration of the power of strong gravitational lensing in this respect was provided by ALMA 0.1 arcsec resolution observations of the Planck source PLCK G244.8 $+$
54.9 at
$+$
54.9 at  $z\,{\simeq}\,3.0$
, with
$z\,{\simeq}\,3.0$
, with  $\mu\,{\simeq}\,30$
(Cañameras et al. Reference Cañameras2017). These observations reached the astounding spatial resolution of 60 pc, comparable to the size of GMCs (around 40–100 pc). Very recently, ALMA high resolution observations of a strongly lensed, normal star-forming galaxy at
$\mu\,{\simeq}\,30$
(Cañameras et al. Reference Cañameras2017). These observations reached the astounding spatial resolution of 60 pc, comparable to the size of GMCs (around 40–100 pc). Very recently, ALMA high resolution observations of a strongly lensed, normal star-forming galaxy at  $z\,{=}\,1.06$
(the ‘Cosmic Snake’) even reached a spatial resolution of 30 pc in the source plane (Dessauges-Zavadsky et al. Reference Dessauges-Zavadsky2019). Intriguingly, the 17 identified GMCs in this source have different physical properties on average than those of nearby galaxies.
$z\,{=}\,1.06$
(the ‘Cosmic Snake’) even reached a spatial resolution of 30 pc in the source plane (Dessauges-Zavadsky et al. Reference Dessauges-Zavadsky2019). Intriguingly, the 17 identified GMCs in this source have different physical properties on average than those of nearby galaxies.
AGN-driven outflows are a key ingredient of current galaxy evolution models (see, e.g., Heckman & Best Reference Heckman and Best2014), since they provide the most plausible explanation for the deviation of the galaxy stellar mass function from the halo mass function at large masses, i.e., for the low star-formation efficiency in massive halos, only less than 10 % of baryons initially present in such halos are used to form stars. However, information on the effect of feedback on the direct fuel for star formation (namely, molecular gas) during the epoch of the most active cosmic star formation is largely missing, due to the weakness of spectral signatures of molecular outflows.
Gravitational lensing allows us to overcome these difficulties. Cañameras et al. (Reference Cañameras2017) obtained CO spectroscopy with a velocity resolution of 40–50  ${\rm km}\,{\rm s}^{-1}$
. This spectral resolution makes possible a direct investigation of massive outflows driven by AGN feedback at high z, with predicted velocities of order
${\rm km}\,{\rm s}^{-1}$
. This spectral resolution makes possible a direct investigation of massive outflows driven by AGN feedback at high z, with predicted velocities of order  $1000\,\hbox{km}\,\hbox{s}^{-1}$
(King & Pounds Reference King and Pounds2015). Spilker et al. (Reference Spilker2018) and Jones et al. (Reference Jones, Maiolino, Caselli and Carniani2019) detected, by means of ALMA spectroscopy, massive molecular outflows in two strongly lensed galaxies at
$1000\,\hbox{km}\,\hbox{s}^{-1}$
(King & Pounds Reference King and Pounds2015). Spilker et al. (Reference Spilker2018) and Jones et al. (Reference Jones, Maiolino, Caselli and Carniani2019) detected, by means of ALMA spectroscopy, massive molecular outflows in two strongly lensed galaxies at  $z\,{=}\,5.3$
and
$z\,{=}\,5.3$
and  $z\,{=}\,5.7$
, respectively, discovered by SPT survey. Cañameras et al. (Reference Cañameras2018) detected a molecular wind signature in the strongly lensed galaxy PLCK G165.7+49.0, discovered by Planck, at
$z\,{=}\,5.7$
, respectively, discovered by SPT survey. Cañameras et al. (Reference Cañameras2018) detected a molecular wind signature in the strongly lensed galaxy PLCK G165.7+49.0, discovered by Planck, at  $z\,{=}\,2.2$
, with magnification factors between 20 and 50 over most of the source of emission.
$z\,{=}\,2.2$
, with magnification factors between 20 and 50 over most of the source of emission.
5. Unlensed galaxy populations
The evolution of the dust-obscured star formation is still poorly known. Gruppioni et al. (Reference Gruppioni2013), Magnelli et al. (Reference Magnelli2013), and Wang et al. (Reference Wang, Pearson, Cowley, Trayford, Béthermin, Gruppioni, Hurley and Michałowski2019b) estimated the IR luminosity functions of galaxies based on the Herschel PACS and SPIRE survey data. Above  $z\,{\simeq}\,2.5,$
the overwhelming majority of redshifts are photometric (at
$z\,{\simeq}\,2.5,$
the overwhelming majority of redshifts are photometric (at  $z\,{>}\,3,$
there are only about 4–6 % spectroscopic redshifts, depending on the survey field). Substantially increasing the fraction of spectroscopic redshifts is hard because of the faintness of these galaxies in the optical/near-IR.
$z\,{>}\,3,$
there are only about 4–6 % spectroscopic redshifts, depending on the survey field). Substantially increasing the fraction of spectroscopic redshifts is hard because of the faintness of these galaxies in the optical/near-IR.
All these studies required the use of optical/near-IR data for photometric redshift estimates. This means that heavily dust-obscured galaxies are missed. Recent investigations (Wang et al. Reference Wang2019a; Dudzevičiūtė et al. 2019; Williams et al. Reference Williams2019) have shown that a substantial fraction of massive galaxies at  $z\,{>}\,3$
are optically dark.
$z\,{>}\,3$
are optically dark.
The proposed spectroscopic survey will provide an unbiased determination of the redshift-dependent IR luminosity function up to  $z\,{\simeq}\,6$
. For the first time, we will have spectroscopic redshifts for a huge number of lensed and non-lensed DSFGs, obtained in an unbiased way, independent of the identification/pre-selection method. Out to
$z\,{\simeq}\,6$
. For the first time, we will have spectroscopic redshifts for a huge number of lensed and non-lensed DSFGs, obtained in an unbiased way, independent of the identification/pre-selection method. Out to  $z\,{\simeq}\,4,$
the luminosity functions will be determined down to below the characteristic
$z\,{\simeq}\,4,$
the luminosity functions will be determined down to below the characteristic  $L_{\star,\rm{IR}}$
. At
$L_{\star,\rm{IR}}$
. At  $z\,\gtrsim\,2.4,$
we expect detections in both the [Cii] 157.7
$z\,\gtrsim\,2.4,$
we expect detections in both the [Cii] 157.7  $\mu\text{m}$
and the [Oiii] 88.36
$\mu\text{m}$
and the [Oiii] 88.36  $\mu\text{m}$
line.
$\mu\text{m}$
line.
Such an all-sky survey offers the opportunity to search for non-lensed, hyper-luminous infrared galaxies (HyLIRGs;  $L_{\rm IR}>10^{13} {\rm{L}}_\odot$
). Currently, only a few examples are known in the distant Universe (Fu et al. Reference Fu2012; Ivison et al. Reference Ivison2013; Riechers et al. Reference Riechers2013), whilst models predict a factor of 2 higher numbers of HyLIRGs (Cai et al. Reference Cai2013). Furthermore, the fraction of HyLIRGs within the brightest Herschel galaxies is still unknown.
$L_{\rm IR}>10^{13} {\rm{L}}_\odot$
). Currently, only a few examples are known in the distant Universe (Fu et al. Reference Fu2012; Ivison et al. Reference Ivison2013; Riechers et al. Reference Riechers2013), whilst models predict a factor of 2 higher numbers of HyLIRGs (Cai et al. Reference Cai2013). Furthermore, the fraction of HyLIRGs within the brightest Herschel galaxies is still unknown.
We note that, in particular, far-IR fine-structure lines seem to be the best way to obtain spectroscopic redshifts of rest-frame UV-selected galaxies beyond  $z\,{=}\,7$
(e.g., Inoue et al. Reference Inoue2016; Carniani et al. Reference Carniani2017; Laporte et al. Reference Laporte2017; Hashimoto et al. Reference Hashimoto2018; Smit et al. Reference Smit2018; Tamura et al. Reference Tamura2019).
$z\,{=}\,7$
(e.g., Inoue et al. Reference Inoue2016; Carniani et al. Reference Carniani2017; Laporte et al. Reference Laporte2017; Hashimoto et al. Reference Hashimoto2018; Smit et al. Reference Smit2018; Tamura et al. Reference Tamura2019).
6. Comparison and synergies with other large-area surveys
Large samples of strongly lensed and unlensed dusty galaxies are expected to also be obtained by next generation CMB experiments, like the ‘CMB-S4’ (ground-based; Abazajian et al. Reference Abazajian2019) and the space-borne Probe of Inflation and Cosmic Origins (PICO; Hanany et al. Reference Hanany2019). However, the depth of PICO surveys is limited by confusion, due to the modest telescope size (1.4 m).
Confusion is a limiting factor also in the case of the 6-m telescopes used as part of CMB-S4, since they operate at mm wavelengths. Another practical limit is set by atmospheric noise. If the effective depths of the CMB-S4 surveys are similar to those of the SPT (a 10-m telescope), the detection of only a few hundred strongly lensed galaxies at  $z\,{\ge}\,6$
is expected. However the CMB-S4 survey will provide deeper photometry at mm wavelengths, which is important to quantify the cold dust emission.
$z\,{\ge}\,6$
is expected. However the CMB-S4 survey will provide deeper photometry at mm wavelengths, which is important to quantify the cold dust emission.
A great advantage of a spectroscopic survey is the direct measurement of redshifts, while surveys of the continuum require a lengthy follow-up programme that may be impractical for hundreds of thousands of optically very faint or almost invisible (e.g., Dannerbauer et al. Reference Dannerbauer, Lehnert, Lutz, Tacconi, Bertoldi, Carilli, Genzel and Menten2002; Younger et al. Reference Younger2007; Dannerbauer et al. Reference Dannerbauer, Walter and Morrison2008; Wang et al. Reference Wang2019a) galaxies. In addition, the target lines allow us to single out the star-formation luminosity. It may be difficult to disentangle this from the AGN contribution using broadband photometry alone (Symeonidis et al. Reference Symeonidis, Giblin, Page, Pearson, Bendo, Seymour and Oliver2016; Symeonidis Reference Symeonidis2017).
As illustrated in Figure 4, there are important synergies with large-area surveys at other wavelengths. For example, the Large Synoptic Survey Telescope (LSST; LSST Science Collaboration 2009) will survey  $20\,000\,\hbox{deg}^2$
of the sky in six photometric bands. The final coadded depths (point sources;
$20\,000\,\hbox{deg}^2$
of the sky in six photometric bands. The final coadded depths (point sources;  $5\sigma$
) are
$5\sigma$
) are  $u= 26.3$
,
$u= 26.3$
,  $g=27.5$
,
$g=27.5$
,  $r= 27.7$
,
$r= 27.7$
,  $i=27.0$
,
$i=27.0$
,  $z=26.2$
, and
$z=26.2$
, and  $y=24.9$
AB magnitudes.
$y=24.9$
AB magnitudes.

Figure 4. Detection limits ( $5\sigma$
) of large area surveys at optical (LSST Science Collaboration 2009), near-IR (Euclid and WFIRST, Laureijs et al. Reference Laureijs2011; Spergel et al. Reference Spergel2015), mid-IR (AllWISE, Cutri et al. Reference Cutri2013, and http://wise2.ipac.caltech.edu/docs/ release/allwise/expsup/sec2_3a.html), far-IR/submm (OST/FIP, CMB-S4, and Simons Observatory, Abazajian et al. Reference Abazajian2019; Ade et al. Reference Ade2019; Meixner et al. Reference Meixner2019), and radio (SKA, Prandoni & Seymour Reference Prandoni and Seymour2015) wavelengths compared with model SEDs of galaxies having the minimum
$5\sigma$
) of large area surveys at optical (LSST Science Collaboration 2009), near-IR (Euclid and WFIRST, Laureijs et al. Reference Laureijs2011; Spergel et al. Reference Spergel2015), mid-IR (AllWISE, Cutri et al. Reference Cutri2013, and http://wise2.ipac.caltech.edu/docs/ release/allwise/expsup/sec2_3a.html), far-IR/submm (OST/FIP, CMB-S4, and Simons Observatory, Abazajian et al. Reference Abazajian2019; Ade et al. Reference Ade2019; Meixner et al. Reference Meixner2019), and radio (SKA, Prandoni & Seymour Reference Prandoni and Seymour2015) wavelengths compared with model SEDs of galaxies having the minimum  $L_{\rm IR}$
detectable in lines at
$L_{\rm IR}$
detectable in lines at  $z\,{=}\,0.5$
, 1, 3, and 6. At the two lower redshifts, we have adopted the ‘warm’ (starburst) SED, while at the two higher redshifts, we use the proto-spheroid SED (Cai et al. Reference Cai2013).
$z\,{=}\,0.5$
, 1, 3, and 6. At the two lower redshifts, we have adopted the ‘warm’ (starburst) SED, while at the two higher redshifts, we use the proto-spheroid SED (Cai et al. Reference Cai2013).
Euclid (Laureijs et al. Reference Laureijs2011) will cover  $15\,000\,\hbox{deg}^2$
of the sky to Y, J, and
$15\,000\,\hbox{deg}^2$
of the sky to Y, J, and  $H=24\,$
mag. The Wide Field Infrared Survey Telescope (WFIRST; Spergel et al. Reference Spergel2015) will carry out large area, deep multi-filter imaging surveys at high galactic latitudes. As an example, we show in Figure 4 the expected depths for a nominal 2.5-yr survey of
$H=24\,$
mag. The Wide Field Infrared Survey Telescope (WFIRST; Spergel et al. Reference Spergel2015) will carry out large area, deep multi-filter imaging surveys at high galactic latitudes. As an example, we show in Figure 4 the expected depths for a nominal 2.5-yr survey of  $2\,500\,\hbox{deg}^2$
down to
$2\,500\,\hbox{deg}^2$
down to  $J\sim 27$
AB mag. The AllWISE survey (Wright et al. Reference Wright2010) has already provided shallower all-sky surveys at 3.4, 4.6, 12, and
$J\sim 27$
AB mag. The AllWISE survey (Wright et al. Reference Wright2010) has already provided shallower all-sky surveys at 3.4, 4.6, 12, and  $22\,\mu\text{m}$
.
$22\,\mu\text{m}$
.
The Far-infrared Imager and Polarimeter (FIP) on the Origins Space Telescope (OST; Meixner et al. Reference Meixner2019) will deliver an ultra-wide-field survey ( $10\,000\,\hbox{deg}^2$
) at
$10\,000\,\hbox{deg}^2$
) at  $250\,\mu\text{m}$
down to the confusion limit (1.1 mJy) and a wide survey (
$250\,\mu\text{m}$
down to the confusion limit (1.1 mJy) and a wide survey ( $500\,\hbox{deg}^2$
) at
$500\,\hbox{deg}^2$
) at  $50\,\mu\text{m}$
down to
$50\,\mu\text{m}$
down to  $40\,\mu$
Jy. The Simons Observatory (Ade et al. Reference Ade2019) Large Aperture Telescope will survey 40% of the sky with arcmin resolution down to 26 mJy at 280 GHz. CMB-S4 (Abazajian et al. Reference Abazajian2019) will reach the confusion limit (
$40\,\mu$
Jy. The Simons Observatory (Ade et al. Reference Ade2019) Large Aperture Telescope will survey 40% of the sky with arcmin resolution down to 26 mJy at 280 GHz. CMB-S4 (Abazajian et al. Reference Abazajian2019) will reach the confusion limit ( $4.8\,$
mJy at 220 GHz) over a large fraction of the sky, and will cover several frequency bands.
$4.8\,$
mJy at 220 GHz) over a large fraction of the sky, and will cover several frequency bands.
The Square Kilometre Array (SKA) ‘all-sky’ survey will cover  $31\,000\,\hbox{deg}^2$
at 1.4 GHz down to
$31\,000\,\hbox{deg}^2$
at 1.4 GHz down to  $20\,\mu{\rm Jy}\,{\rm beam}^{-1}$
(
$20\,\mu{\rm Jy}\,{\rm beam}^{-1}$
( $5\sigma$
), while the SKA/Wide survey at around 1 GHz will reach
$5\sigma$
), while the SKA/Wide survey at around 1 GHz will reach  $5\,\mu{\rm Jy}\,{\rm beam}^{-1}$
(
$5\,\mu{\rm Jy}\,{\rm beam}^{-1}$
( $5\sigma$
) over
$5\sigma$
) over  $1\,000\,\hbox{deg}^2$
(Prandoni & Seymour Reference Prandoni and Seymour2015).
$1\,000\,\hbox{deg}^2$
(Prandoni & Seymour Reference Prandoni and Seymour2015).
As illustrated in Figure 4, the WFIRST, the Origins/FIP and the SKA/Wide surveys are expected to detect practically all the dusty galaxies seen in lines in our proposed spectroscopic survey, although over limited sky areas. On the other hand, the other surveys mentioned above will also detect a substantial fraction of them, thus providing complementary information on stellar and dust components.
7. Revealing galaxy proto-clusters via dusty starbursts
N-body simulations in the framework of the currently standard  $\Lambda$
CDM cosmology have elucidated how primordial perturbations have grown into collapsed halos distributed within a filamentary structure (the cosmic web, e.g. Springel et al. Reference Springel2005; Boylan-Kolchin et al. Reference Boylan-Kolchin, Springel, White, Jenkins and Lemson2009). However an observational validation of how these objects are assembled is still missing. Understanding the full evolutionary history of present-day galaxy clusters is of fundamental importance for the observational validation of the formation history of the most massive dark-matter halos, a crucial test of models for structure formation, as well as for investigating the impact of environment on the formation and evolution of galaxies (Kravtsov & Borgani Reference Kravtsov and Borgani2012; Overzier & Kashikawa Reference Overzier and Kashikawa2019; Dannerbauer et al. Reference Dannerbauer2019a).
$\Lambda$
CDM cosmology have elucidated how primordial perturbations have grown into collapsed halos distributed within a filamentary structure (the cosmic web, e.g. Springel et al. Reference Springel2005; Boylan-Kolchin et al. Reference Boylan-Kolchin, Springel, White, Jenkins and Lemson2009). However an observational validation of how these objects are assembled is still missing. Understanding the full evolutionary history of present-day galaxy clusters is of fundamental importance for the observational validation of the formation history of the most massive dark-matter halos, a crucial test of models for structure formation, as well as for investigating the impact of environment on the formation and evolution of galaxies (Kravtsov & Borgani Reference Kravtsov and Borgani2012; Overzier & Kashikawa Reference Overzier and Kashikawa2019; Dannerbauer et al. Reference Dannerbauer2019a).
To address the many still open questions on cluster formation and evolution, we need to follow all their evolutionary stages through cosmic time, starting from their progenitors, galaxy-clusters-in-formation, so-called ‘proto-clusters’ (for a review, see Overzier Reference Overzier2016). This needs a coordinated multi-frequency effort. Cluster identification via classical methods (optical/IR imaging and detection of X-ray or SZ signals from the hot IntraCluster Medium (ICM)) has been very effective at relatively low redshifts. Samples of SZ-selected clusters have been recently extended to a few thousand objects, primarily thanks to surveys with the Planck satellite (Planck Collaboration XXVII 2016), the SPT (Bleem et al. Reference Bleem2020), and the Atacama Cosmology Telescope (ACT; Hilton et al. Reference Hilton2018). A few thousand clusters have also been detected in X-rays (Klein et al. Reference Klein2019). Both ICM-based techniques have yielded just a handful of clusters above  $z\,{\simeq}\,1.5$
. The e-ROSITA all-sky survey is expected to boost the number of X-ray-detected clusters to around
$z\,{\simeq}\,1.5$
. The e-ROSITA all-sky survey is expected to boost the number of X-ray-detected clusters to around  $10^5$
, but again few detections are expected at
$10^5$
, but again few detections are expected at  $z\,\gtrsim\,1.5$
(Grandis et al. Reference Grandis, Mohr, Dietrich, Bocquet, Saro, Klein, Paulus and Capasso2019). There is also a limit to detecting X-rays and the SZ effect at very high redshifts because of the lack of virialised gas.
$z\,\gtrsim\,1.5$
(Grandis et al. Reference Grandis, Mohr, Dietrich, Bocquet, Saro, Klein, Paulus and Capasso2019). There is also a limit to detecting X-rays and the SZ effect at very high redshifts because of the lack of virialised gas.
Galaxy cluster searches looking for overdensities of galaxies in large-area optical/IR surveys (e.g., Oguri et al. Reference Oguri2018; Wen & Han Reference Wen and Han2018; Gonzalez et al. Reference Gonzalez2019) are generally limited to  $z\,\lesssim\,1.5$
due to the subtle density contrasts of the object. Observations indicate that
$z\,\lesssim\,1.5$
due to the subtle density contrasts of the object. Observations indicate that  $z\,{\simeq}\,1.5$
corresponds to a critical epoch in galaxy cluster evolution. At lower redshifts, the global SFR of galaxies is anti-correlated with local density (Dressler Reference Dressler1980; Kauffmann et al. Reference Kauffmann, White, Heckman, Ménard, Brinchmann, Charlot, Tremonti and Brinkmann2004; Lemaux et al. Reference Lemaux2019). However, the specific SFR (i.e., the SFR per unit stellar mass) increases faster in clusters than in the field, catching up with that in the field at
$z\,{\simeq}\,1.5$
corresponds to a critical epoch in galaxy cluster evolution. At lower redshifts, the global SFR of galaxies is anti-correlated with local density (Dressler Reference Dressler1980; Kauffmann et al. Reference Kauffmann, White, Heckman, Ménard, Brinchmann, Charlot, Tremonti and Brinkmann2004; Lemaux et al. Reference Lemaux2019). However, the specific SFR (i.e., the SFR per unit stellar mass) increases faster in clusters than in the field, catching up with that in the field at  $z\,{\simeq}\,1.5$
(Alberts et al. Reference Alberts2014, Reference Alberts2016; Wagner et al. Reference Wagner2017). Thus, galaxy clusters selected through optical/IR observations are rare at
$z\,{\simeq}\,1.5$
(Alberts et al. Reference Alberts2014, Reference Alberts2016; Wagner et al. Reference Wagner2017). Thus, galaxy clusters selected through optical/IR observations are rare at  $z\,\gtrsim\,1.5$
(Gobat et al. Reference Gobat2011).
$z\,\gtrsim\,1.5$
(Gobat et al. Reference Gobat2011).
Above  $z\,{\simeq}\,1.5$
, when a large fraction of member galaxies are in the dust-obscured star-formation phase (e.g., Dannerbauer et al. Reference Dannerbauer2014; Clements et al. Reference Clements2016; Kato et al. Reference Kato2016; Wagner et al. Reference Wagner2017; Nantais et al. Reference Nantais2017), proto-cluster searches are most conveniently carried out at submm wavelengths. Negrello et al. (Reference Negrello, González-Nuevo, Magliocchetti, Moscardini, De Zotti, Toffolatti and Danese2005) predicted the detection by Planck and Herschel submm surveys of unresolved intensity peaks made by the summed emission of dusty star-forming high-z proto-cluster members within the beam. Motivated by this work, Planck Collaboration Int. XXXIX (2016) have reported the detection of 2 151 proto-cluster candidates over the cleanest 26% of the sky—these are unresolved sources with ‘red’ submm colours, consistent with redshifts
$z\,{\simeq}\,1.5$
, when a large fraction of member galaxies are in the dust-obscured star-formation phase (e.g., Dannerbauer et al. Reference Dannerbauer2014; Clements et al. Reference Clements2016; Kato et al. Reference Kato2016; Wagner et al. Reference Wagner2017; Nantais et al. Reference Nantais2017), proto-cluster searches are most conveniently carried out at submm wavelengths. Negrello et al. (Reference Negrello, González-Nuevo, Magliocchetti, Moscardini, De Zotti, Toffolatti and Danese2005) predicted the detection by Planck and Herschel submm surveys of unresolved intensity peaks made by the summed emission of dusty star-forming high-z proto-cluster members within the beam. Motivated by this work, Planck Collaboration Int. XXXIX (2016) have reported the detection of 2 151 proto-cluster candidates over the cleanest 26% of the sky—these are unresolved sources with ‘red’ submm colours, consistent with redshifts  $z\,{>}\,2$
.
$z\,{>}\,2$
.
Follow-up observations of a subset of these sources with Herschel (Planck Collaboration Int. XXVII 2015) have shown that, apart from a tiny fraction of strongly lensed galaxies (the GEMS sample, see Cañameras et al. Reference Cañameras2015), they are associated with overdensities of DSFGs. However, Negrello et al. (Reference Negrello2017b) argued that most of them are probably not individual proto-clusters, but could be made of physically unrelated high-z structures falling by chance within the relatively large Planck beam ( $\hbox{FWHM}\,{\simeq}\,5$
arcmin). This has been confirmed by spectroscopic measurements and/or photometric redshift estimates for two objects, showing that each consists of two independent overdensities along the line of sight (Flores-Cacho et al. Reference Flores-Cacho2016; Kneissl et al. Reference Kneissl2019).
$\hbox{FWHM}\,{\simeq}\,5$
arcmin). This has been confirmed by spectroscopic measurements and/or photometric redshift estimates for two objects, showing that each consists of two independent overdensities along the line of sight (Flores-Cacho et al. Reference Flores-Cacho2016; Kneissl et al. Reference Kneissl2019).
The confusion problem (blending of independent proto-clusters along the line of sight) affecting Planck surveys is due to its poor angular resolution. The instrument considered here has angular resolution  $\le\!\!\ 1$
arcmin at
$\le\!\!\ 1$
arcmin at  $\nu \ge380\,$
GHz (cf. Table 1). This is the ideal angular resolution for searches of submm-bright proto-clusters. The angular correlation function of faint submm galaxies measured by Chen et al. (Reference Chen2016) in photometric redshift bins up to
$\nu \ge380\,$
GHz (cf. Table 1). This is the ideal angular resolution for searches of submm-bright proto-clusters. The angular correlation function of faint submm galaxies measured by Chen et al. (Reference Chen2016) in photometric redshift bins up to  $z\,{\simeq}\,5$
showed that the 1-halo component, corresponding to the source distribution within the proto-cluster halo, dominates at
$z\,{\simeq}\,5$
showed that the 1-halo component, corresponding to the source distribution within the proto-cluster halo, dominates at  $\theta\,\lesssim\,1$
arcmin. This is in keeping with the results of Alberts et al. (Reference Alberts2014) on 274 clusters with
$\theta\,\lesssim\,1$
arcmin. This is in keeping with the results of Alberts et al. (Reference Alberts2014) on 274 clusters with  $0.3\,{\le}\,z\,{\le}\,1.5$
. They found that the density of IR-emitting cluster members clearly exceeds that of the background field level only within
$0.3\,{\le}\,z\,{\le}\,1.5$
. They found that the density of IR-emitting cluster members clearly exceeds that of the background field level only within  $0.5\,$
Mpc of the cluster centre. Such a linear scale corresponds to an angular scale of about 1 arcmin at redshifts in the range 1.5–2.5.
$0.5\,$
Mpc of the cluster centre. Such a linear scale corresponds to an angular scale of about 1 arcmin at redshifts in the range 1.5–2.5.
The clustering measurements by Chen et al. (Reference Chen2016) also gave clear indications of a steepening of the correlation function on arcsec angular scales. Negrello et al. (Reference Negrello2017b) modelled this in terms of an additional component with a spatial correlation function  $\xi(r)\propto r^{-3.3}$
. This component, which dominates for
$\xi(r)\propto r^{-3.3}$
. This component, which dominates for  $r\,\lesssim\,50\,$
kpc, may represent the cluster core. Submm-bright proto-cluster cores, with linear diameters of order
$r\,\lesssim\,50\,$
kpc, may represent the cluster core. Submm-bright proto-cluster cores, with linear diameters of order  $100\,$
kpc, have been discovered by Ivison et al. (Reference Ivison2013, Reference Ivison, Page, Cirasuolo, Harrison, Mainieri, Arumugam and Dudzevičiūtė2019) at
$100\,$
kpc, have been discovered by Ivison et al. (Reference Ivison2013, Reference Ivison, Page, Cirasuolo, Harrison, Mainieri, Arumugam and Dudzevičiūtė2019) at  $z=2.41$
, Gómez-Guijarro et al. (Reference Gómez-Guijarro2019) at
$z=2.41$
, Gómez-Guijarro et al. (Reference Gómez-Guijarro2019) at  $z\,{=}\,2.2$
and
$z\,{=}\,2.2$
and  $z\,{=}\,2.6$
, Wang et al. (Reference Wang2016) at
$z\,{=}\,2.6$
, Wang et al. (Reference Wang2016) at  $z\,{=}\,2.5$
, and Miller et al. (Reference Miller2018) at
$z\,{=}\,2.5$
, and Miller et al. (Reference Miller2018) at  $z\,{=}\,4.3$
. Oteo et al. (Reference Oteo2018) reported the identification of a dusty proto-cluster core at
$z\,{=}\,4.3$
. Oteo et al. (Reference Oteo2018) reported the identification of a dusty proto-cluster core at  $z\,{=}\,4.0$
, whose member galaxies are distributed over a
$z\,{=}\,4.0$
, whose member galaxies are distributed over a  $260\,\hbox{kpc}\times310\,\hbox{kpc}$
region. Additionally Lacaille et al. (Reference Lacaille2019) spectroscopically confirmed the detection of two submm proto-clusters at
$260\,\hbox{kpc}\times310\,\hbox{kpc}$
region. Additionally Lacaille et al. (Reference Lacaille2019) spectroscopically confirmed the detection of two submm proto-clusters at  $z\,{\simeq}\,2.8$
and
$z\,{\simeq}\,2.8$
and  ${\simeq}\,2.3$
, with 1 arcmin angular radius.
${\simeq}\,2.3$
, with 1 arcmin angular radius.
The spectroscopically confirmed proto-cluster cores listed above are unresolved at the resolution of the instrument, except perhaps at the highest frequencies, where the maps can be degraded to arcmin resolution. The summed IR luminosities of detected members of the spectroscopically confirmed high-z proto-clusters (lower limits to the proto-cluster total IR luminosities) range from a few to  $\hbox{several}\times 10^{13}\,{\rm L}_\odot$
and are all well above the line-detection limits (see Figure 5) of our proposed surveys.
$\hbox{several}\times 10^{13}\,{\rm L}_\odot$
and are all well above the line-detection limits (see Figure 5) of our proposed surveys.

Figure 5. SFRs of the spectroscopically confirmed, submm-bright proto-cluster cores discovered so far, compared with the minimum SFRs detectable at  $5\sigma$
by the ‘all-sky’ (solid black line; 2 yr, 90% of the sky) and by the ‘deep’ (dotted blue line; 5% of the sky, six months) spectroscopic surveys. The data points are Ivison et al. (Reference Ivison2013) at
$5\sigma$
by the ‘all-sky’ (solid black line; 2 yr, 90% of the sky) and by the ‘deep’ (dotted blue line; 5% of the sky, six months) spectroscopic surveys. The data points are Ivison et al. (Reference Ivison2013) at  $z\,{=}\,2.41$
; Gómez-Guijarro et al. (Reference Gómez-Guijarro2019) at
$z\,{=}\,2.41$
; Gómez-Guijarro et al. (Reference Gómez-Guijarro2019) at  $z\,{=}\,2.171$
and
$z\,{=}\,2.171$
and  $z\,{=}\,2.602$
; Wang et al. (Reference Wang2016) at
$z\,{=}\,2.602$
; Wang et al. (Reference Wang2016) at  $z\,{=}\,2.51$
; Miller et al. (Reference Miller2018) at
$z\,{=}\,2.51$
; Miller et al. (Reference Miller2018) at  $z\,{=}\,4.31$
; Oteo et al. (Reference Oteo2018) at
$z\,{=}\,4.31$
; Oteo et al. (Reference Oteo2018) at  $z\,{=}\,4.0$
; and Lacaille et al. (Reference Lacaille2019) at
$z\,{=}\,4.0$
; and Lacaille et al. (Reference Lacaille2019) at  $z \,{\simeq}\,2.85$
and
$z \,{\simeq}\,2.85$
and  ${\simeq}\,2.30$
.
${\simeq}\,2.30$
.
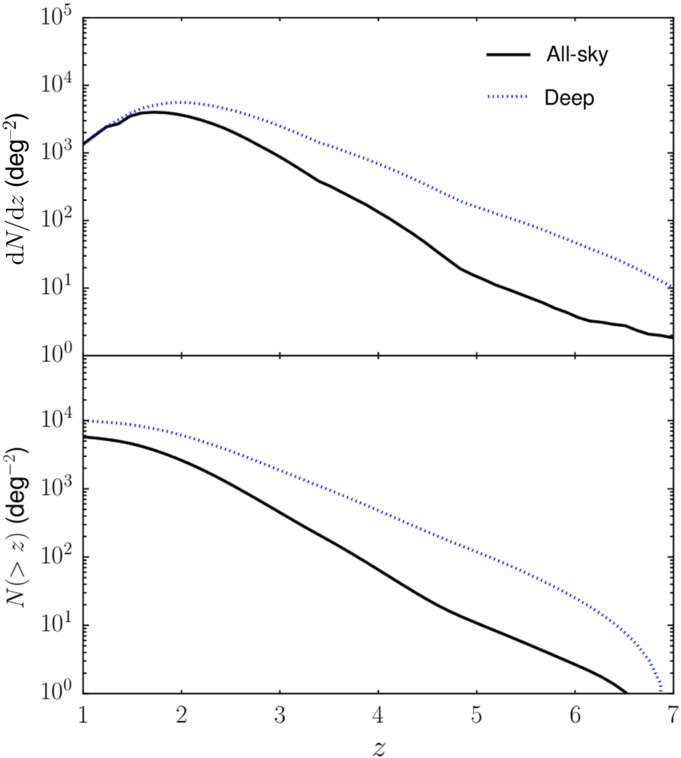
Figure 6. Predicted differential and cumulative redshift distributions (upper and lower panels, respectively) of proto-clusters detected in at least one line by the ‘all-sky’ survey (2 yr, 90% of the sky; solid black line) and by the deep survey (6 months, 5% of the sky; dotted blue line). We expect the detection of tens of millions of proto-clusters at  $z\simeq 2$
and of tens of thousands of them at
$z\simeq 2$
and of tens of thousands of them at  $z\simeq 6$
.
$z\simeq 6$
.
High-z proto-clusters with enhanced star formation on larger (few to several Mpc) scales have also been reported by Dannerbauer et al. (Reference Dannerbauer2014), Casey et al. (Reference Casey2015), Kato et al. (Reference Kato2016), Hung et al. (Reference Hung2016), and Umehata et al. (Reference Umehata2019). All proto-clusters with similar properties will be detected by our spectroscopic survey.
As illustrated in Figures 6 and 7, the instrument considered here will detect millions of proto-clusters at the peak of cosmic star-formation activity ( $z=2$
–3). For a large fraction of proto-clusters, especially at
$z=2$
–3). For a large fraction of proto-clusters, especially at  $z\ge 2.4$
, at least two lines will be detected, allowing a solid redshift determination without requiring follow-up observations.
$z\ge 2.4$
, at least two lines will be detected, allowing a solid redshift determination without requiring follow-up observations.

Figure 7. Cumulative IR (8– $1\,000\,\mu\text{m}$
) luminosity functions of proto-clusters within
$1\,000\,\mu\text{m}$
) luminosity functions of proto-clusters within  $\delta z= 0.5$
at six redshifts. The predictions are based on the model of Negrello et al. (Reference Negrello2017b). The line luminosities corresponding to
$\delta z= 0.5$
at six redshifts. The predictions are based on the model of Negrello et al. (Reference Negrello2017b). The line luminosities corresponding to  $L_{\rm IR}$
were computed as described in the text. The vertical lines show the detection limits for the brightest lines, assuming the instrument performances described in the text. Such an instrument will detect strongly lensed galaxies (cf. Figure 3) and proto-clusters of dusty galaxies all the way out to the reionisation redshift.
$L_{\rm IR}$
were computed as described in the text. The vertical lines show the detection limits for the brightest lines, assuming the instrument performances described in the text. Such an instrument will detect strongly lensed galaxies (cf. Figure 3) and proto-clusters of dusty galaxies all the way out to the reionisation redshift.
8. Comparison with other large-area cluster surveys
No other foreseen survey can do anything similar to the future spectroscopic satellite. Euclid’s ‘Wide’ survey over  $15\,000\,\hbox{deg}^2$
is expected to detect galaxy clusters and proto-clusters only out to
$15\,000\,\hbox{deg}^2$
is expected to detect galaxy clusters and proto-clusters only out to  $z\,{\simeq}\,2$
. The estimated surface density of clusters detected at
$z\,{\simeq}\,2$
. The estimated surface density of clusters detected at  $5\sigma$
in the redshift range
$5\sigma$
in the redshift range  $1.5\,{\le}\,z\,{\le}\,2$
is
$1.5\,{\le}\,z\,{\le}\,2$
is  $\simeq0.19\,\hbox{deg}^{-2}$
(Sartoris et al. Reference Sartoris2016, see their Figure 3).
$\simeq0.19\,\hbox{deg}^{-2}$
(Sartoris et al. Reference Sartoris2016, see their Figure 3).
A survey of  $8\,300\,\hbox{deg}^2$
by WFIRST (Spergel et al. Reference Spergel2015) is expected to detect 20 000 clusters with masses
$8\,300\,\hbox{deg}^2$
by WFIRST (Spergel et al. Reference Spergel2015) is expected to detect 20 000 clusters with masses  $M_{\rm cl}\ge 7.4\times10^{13}\,{\rm M}_\odot$
at
$M_{\rm cl}\ge 7.4\times10^{13}\,{\rm M}_\odot$
at  $z\,{=}\,1.5$
–2 and 2 800 clusters at
$z\,{=}\,1.5$
–2 and 2 800 clusters at  $z\,{=}\,2$
–2.5 for the same masses. The corresponding surface densities are of 2.4 and
$z\,{=}\,2$
–2.5 for the same masses. The corresponding surface densities are of 2.4 and  $0.34\,\hbox{deg}^{-2}$
, respectively.
$0.34\,\hbox{deg}^{-2}$
, respectively.
For comparison, we expect around  $2\,000\,\hbox{deg}^{-2}$
(
$2\,000\,\hbox{deg}^{-2}$
( $1\,300\,\hbox{deg}^{-2}$
) detections in the [Cii] 157.7
$1\,300\,\hbox{deg}^{-2}$
) detections in the [Cii] 157.7  $\mu\text{m}$
line only and
$\mu\text{m}$
line only and  $\simeq 5\,\hbox{deg}^{-2}$
(
$\simeq 5\,\hbox{deg}^{-2}$
( $\simeq 0.4\,\hbox{deg}^{-2}$
) detections in two lines ([Cii] 157.7
$\simeq 0.4\,\hbox{deg}^{-2}$
) detections in two lines ([Cii] 157.7  $\mu\text{m}$
and [Nii] 205.18
$\mu\text{m}$
and [Nii] 205.18  $\mu\text{m}$
) at
$\mu\text{m}$
) at  $1.5\,{\le}\,z\,{\le}\,2$
(
$1.5\,{\le}\,z\,{\le}\,2$
( $2.0\,{\le}\,z\,{\le}\,2.5$
), as shown in Figure 7.
$2.0\,{\le}\,z\,{\le}\,2.5$
), as shown in Figure 7.
Cluster searches with ground-based, large-area optical surveys like LSST (LSST Science Collaboration 2009) and the Javalambre Physics of the Accelerating Universe Astrophysical Survey (J-PAS; Benitez et al. Reference Benitez2014) are limited to  $z\,{<}\,1.5$
. As mentioned above, the X-ray cluster survey of e-ROSITA is also limited to
$z\,{<}\,1.5$
. As mentioned above, the X-ray cluster survey of e-ROSITA is also limited to  $z\,\lesssim\,1.5$
(Grandis et al. Reference Grandis, Mohr, Dietrich, Bocquet, Saro, Klein, Paulus and Capasso2019).
$z\,\lesssim\,1.5$
(Grandis et al. Reference Grandis, Mohr, Dietrich, Bocquet, Saro, Klein, Paulus and Capasso2019).
The most extensive optical search for high-z proto-clusters is being conducted using a wide-field survey with the Hyper Suprime-Cam (HSC) instrument mounted at the prime focus of the Subaru telescope. The wide HSC survey will cover  $1\,400\,\hbox{deg}^2$
. Toshikawa et al. (Reference Toshikawa2018) carried out a blind search for proto-clusters at
$1\,400\,\hbox{deg}^2$
. Toshikawa et al. (Reference Toshikawa2018) carried out a blind search for proto-clusters at  $z\,{\simeq}\,3.8$
over an area of
$z\,{\simeq}\,3.8$
over an area of  $121\,\hbox{deg}^2$
using colour criteria to select galaxies at
$121\,\hbox{deg}^2$
using colour criteria to select galaxies at  $z\,{\simeq}\,3.3$
–4.2. They found 216 overdensities that were significant at the
$z\,{\simeq}\,3.3$
–4.2. They found 216 overdensities that were significant at the  ${>}\,4\sigma$
level. The estimated comoving density of these objects is
${>}\,4\sigma$
level. The estimated comoving density of these objects is  $1.4\times 10^{-7}\,\hbox{Mpc}^{-3}$
for the cosmology adopted here. At higher redshifts, Higuchi et al. (Reference Higuchi2019) reported 14 and 26 proto-cluster candidates at
$1.4\times 10^{-7}\,\hbox{Mpc}^{-3}$
for the cosmology adopted here. At higher redshifts, Higuchi et al. (Reference Higuchi2019) reported 14 and 26 proto-cluster candidates at  $z\,{=}\,5.7$
and
$z\,{=}\,5.7$
and  $z\,{=}\,6.6$
, covering an area of 14 and
$z\,{=}\,6.6$
, covering an area of 14 and  $16\,\hbox{deg}^2$
, respectively.
$16\,\hbox{deg}^2$
, respectively.
Kubo et al. (Reference Kubo2019) reported statistical evidence of submm emission from HSC candidate proto-clusters in Planck high-frequency maps, confirming the ubiquity of intense star formation in high-z proto-clusters. The estimated average IR luminosity and SFR are well above the detection limits of the proposed spectroscopic survey.
At  $z\,{=}\,3.75$
, i.e., close to the redshift of the optical search by Toshikawa et al. (Reference Toshikawa2018), the spectroscopic survey will detect
$z\,{=}\,3.75$
, i.e., close to the redshift of the optical search by Toshikawa et al. (Reference Toshikawa2018), the spectroscopic survey will detect  $100\,\hbox{deg}^{-2}$
proto-clusters in the [Cii] 157.7
$100\,\hbox{deg}^{-2}$
proto-clusters in the [Cii] 157.7  $\mu\text{m}$
line and
$\mu\text{m}$
line and  $50\,\hbox{deg}^{-2}$
also in the [Oiii] 88.36
$50\,\hbox{deg}^{-2}$
also in the [Oiii] 88.36  $\mu\text{m}$
line. The corresponding comoving volume densities are 1–
$\mu\text{m}$
line. The corresponding comoving volume densities are 1– $2\times10^{-5}\,\hbox{Mpc}^{-3}$
, i.e., about two orders of magnitude higher than that achieved by Toshikawa et al. (Reference Toshikawa2018). As pointed out by the latter authors, overdensity searches via optical imaging surveys are expected to be highly incomplete (completeness around 6 %) because most overdensities are swamped by projection effects. On the contrary, the statistical detection on Planck maps of large SFRs in optically selected proto-clusters suggests a high completeness level for the planned spectroscopic survey.
$2\times10^{-5}\,\hbox{Mpc}^{-3}$
, i.e., about two orders of magnitude higher than that achieved by Toshikawa et al. (Reference Toshikawa2018). As pointed out by the latter authors, overdensity searches via optical imaging surveys are expected to be highly incomplete (completeness around 6 %) because most overdensities are swamped by projection effects. On the contrary, the statistical detection on Planck maps of large SFRs in optically selected proto-clusters suggests a high completeness level for the planned spectroscopic survey.
It is important to stress that the proposed instrument can measure both the SFR and the SZ effect in clusters. It will thus simultaneously probe the evolution of star formation in dense environment and of the hot IGM, allowing us to investigate the relationship between the two aspects of cluster evolution. It will thereby provide key data on the still unexplored, crucial transition period at  $z\,{\simeq}\,1.5$
–2 when cluster galaxies were vigorously forming stars and at the same time the hot IGM was taking root.
$z\,{\simeq}\,1.5$
–2 when cluster galaxies were vigorously forming stars and at the same time the hot IGM was taking root.
Figure 7 shows that the spectroscopic survey will detect enough proto-clusters within relatively narrow redshift bins to accurately measure their two-point spatial correlation,  $\xi(r)$
, as a function of redshift out to
$\xi(r)$
, as a function of redshift out to  $z\,{\simeq}\,6$
and, at fixed z, as a function of
$z\,{\simeq}\,6$
and, at fixed z, as a function of  $L_{\rm{IR}}$
(or equivalently of SFR). From the function
$L_{\rm{IR}}$
(or equivalently of SFR). From the function  $\xi(r)$
, we can infer the effective halo mass (Sheth et al. Reference Sheth, Mo and Tormen2001), so that the observed proto-cluster abundance provides constraints on the evolution of the high-mass tail of the halo mass function and on the relationship between halo mass and
$\xi(r)$
, we can infer the effective halo mass (Sheth et al. Reference Sheth, Mo and Tormen2001), so that the observed proto-cluster abundance provides constraints on the evolution of the high-mass tail of the halo mass function and on the relationship between halo mass and  $L_{\rm IR}$
or SFR.
$L_{\rm IR}$
or SFR.
Note that the abundance and clustering of galaxy clusters are both probes of large-scale structure growth. Their determination as a function of mass and redshift enables us to constrain cosmological parameters primarily through the linear growth rate of perturbations. This has been proved to be competitive with and complementary to other probes (e.g., Planck Collaboration XXIV 2016; de Haan et al. Reference de Haan2016; Sridhar et al. Reference Sridhar, Maurogordato, Benoist, Cappi and Marulli2017).
At lower redshifts, the comparison of cluster samples detected via star formation and via the SZ effect will quantify the history of star-formation quenching in galaxy clusters, a still open issue (Boselli et al. Reference Boselli2016; Rodríguez-Muñoz et al. Reference Rodríguez-Muñoz2019). In particular, we will learn about the quenching timescale at different redshifts and for different cluster halo masses, inferred from the amplitude of the SZ effect, and of the ICM density inferred from X-ray observations, e.g., from e-ROSITA. This is key information for identifying the mechanism(s) responsible for the environmental quenching.
9. Conclusions
The high-sensitivity spectroscopic and imaging surveys carried out by the space mission proposed by Delabrouille et al. (Reference Delabrouille2019) will revolutionise our view of galaxy evolution and of the growth of galaxy clusters.
Spectroscopy enables full exploitation of the sensitivity of present-day instrumentation, bypassing the confusion limits that severely constrain the depth of submm surveys with telescopes of the 3-m class, like that of the Herschel Observatory.
The high luminosity of far-IR lines, such as [Cii] 157.7  $\mu\text{m}$
, [Oiii] 88.36
$\mu\text{m}$
, [Oiii] 88.36  $\mu\text{m}$
, [Oi]63.18
$\mu\text{m}$
, [Oi]63.18 $\mu\text{m}$
, and [Oiii] 51.81
$\mu\text{m}$
, and [Oiii] 51.81  $\mu\text{m}$
, makes it possible to detect, at
$\mu\text{m}$
, makes it possible to detect, at  $z\,{>}\,1$
, star-forming galaxies with SFRs about one order of magnitude lower that those reached by the Herschel-ATLAS survey. Moreover, we have argued that these fine-structure lines track the full SFR, not only the dust-obscured fraction measured by the far-IR/submm continuum.
$z\,{>}\,1$
, star-forming galaxies with SFRs about one order of magnitude lower that those reached by the Herschel-ATLAS survey. Moreover, we have argued that these fine-structure lines track the full SFR, not only the dust-obscured fraction measured by the far-IR/submm continuum.
Most importantly, the spectroscopic survey directly provides the 3D distribution of star-forming galaxies all the way through the reionisation epoch. Many tens of millions of galaxies will be detected over the redshift range  $1\,{<}\,z\,{<}\,3$
(Figure 2) where the cosmic SFR peaks. SFRs well below those of typical galaxies at these redshifts will be reached (Figures 1 and 3). For example, at
$1\,{<}\,z\,{<}\,3$
(Figure 2) where the cosmic SFR peaks. SFRs well below those of typical galaxies at these redshifts will be reached (Figures 1 and 3). For example, at  $z\,{=}\,2$
the [Cii] 157.7
$z\,{=}\,2$
the [Cii] 157.7  $\mu\text{m}$
line will allow the detection of SFRs down to about
$\mu\text{m}$
line will allow the detection of SFRs down to about  $60\,{\rm M}_\odot\,\hbox{yr}^{-1}$
by the ‘all-sky’ survey and down to
$60\,{\rm M}_\odot\,\hbox{yr}^{-1}$
by the ‘all-sky’ survey and down to  $30\,{\rm M}_\odot\,\hbox{yr}^{-1}$
for the ‘deep’ survey. Our conservative estimates, which do not allow for the possibility of a top-heavier IMF at high z indicated by theoretical arguments and by some observational results (see Cai et al. Reference Cai, De Zotti and Bonato2020, for a discussion), yield the detection of thousands of galaxies at
$30\,{\rm M}_\odot\,\hbox{yr}^{-1}$
for the ‘deep’ survey. Our conservative estimates, which do not allow for the possibility of a top-heavier IMF at high z indicated by theoretical arguments and by some observational results (see Cai et al. Reference Cai, De Zotti and Bonato2020, for a discussion), yield the detection of thousands of galaxies at  $z\,{\simeq}\, 6$
and of several tens at
$z\,{\simeq}\, 6$
and of several tens at  $z\simeq 8$
.
$z\simeq 8$
.
This outcome is far better than can be achieved by existing and forthcoming continuum surveys which, moreover, require time-consuming redshift follow-up programmes that are impractical for millions of optically very faint sources.
The spectroscopic survey will detect millions of strongly lensed galaxies, which dominate the bright tails of the high-z SFR functions, above uncorrected SFRs of a few thousand  ${\rm M}_\odot\,\hbox{yr}^{-1}$
. Additionally, strong lensing will allow us to probe SFR functions below the nominal detection limit.
${\rm M}_\odot\,\hbox{yr}^{-1}$
. Additionally, strong lensing will allow us to probe SFR functions below the nominal detection limit.
The brightest strongly lensed galaxies are obvious targets for follow-up observations with high-resolution instruments like ALMA or JWST. The combination of their extreme luminosity with the stretching of their images offers a unique possibility of peering into the internal structure of high-z galaxies down to scales of tens of parsecs, comparable to or smaller than the size of giant molecular clouds in the Milky Way. Data at this resolution are the only way to directly investigate the complex physical processes driving the early evolution of galaxies.
The arcmin (or better) angular resolution at submm wavelengths of the proposed survey is ideal to detect proto-cluster cores out to  $z\,{\simeq}\,7$
. The summed line emission of star-forming member galaxies within the beam of the instrument makes these objects produce the brightest intensity peaks at each redshift. Proto-clusters can thus be detected independently of whether they contain the hot IGM that would make them detectable in X-rays or via the SZ effect.
$z\,{\simeq}\,7$
. The summed line emission of star-forming member galaxies within the beam of the instrument makes these objects produce the brightest intensity peaks at each redshift. Proto-clusters can thus be detected independently of whether they contain the hot IGM that would make them detectable in X-rays or via the SZ effect.
We predict the spectroscopic detection of millions of proto-clusters at  $z\,{>}\,1.5$
, i.e., in the redshift range hardly accessible to classical cluster-detection methods. This will provide a complete view of the star-formation history in dense environments. The statistical detection of intense star formation in optically selected high-z proto-clusters (Kubo et al. Reference Kubo2019) suggests that the planned spectroscopic survey will have a high completeness level.
$z\,{>}\,1.5$
, i.e., in the redshift range hardly accessible to classical cluster-detection methods. This will provide a complete view of the star-formation history in dense environments. The statistical detection of intense star formation in optically selected high-z proto-clusters (Kubo et al. Reference Kubo2019) suggests that the planned spectroscopic survey will have a high completeness level.
Enough proto-clusters will be detected within relatively narrow redshift bins to accurately measure their clustering  $\xi(r,z)$
out to
$\xi(r,z)$
out to  $z\,{\simeq}\,6$
and, at fixed z, as a function of their SFR. Since
$z\,{\simeq}\,6$
and, at fixed z, as a function of their SFR. Since  $\xi(r)$
allows us to estimate the halo mass, we can derive the first observational constraints on the evolution of the high-mass tail of the halo mass function and on the relationship between halo mass and SFR.
$\xi(r)$
allows us to estimate the halo mass, we can derive the first observational constraints on the evolution of the high-mass tail of the halo mass function and on the relationship between halo mass and SFR.
At lower redshifts ( $z\,\lesssim\,1.5$
–2), the mission will simultaneously measure the SFR and the SZ effect for early structures. In combination with X-ray data from e-Rosita and with data from optical surveys measuring stellar masses, this will elucidate several key issues, e.g., the transition from the active star-forming to passive evolution phases of cluster members, the origin of the hot IGM, and the mechanisms responsible for the environmental quenching of star formation.
$z\,\lesssim\,1.5$
–2), the mission will simultaneously measure the SFR and the SZ effect for early structures. In combination with X-ray data from e-Rosita and with data from optical surveys measuring stellar masses, this will elucidate several key issues, e.g., the transition from the active star-forming to passive evolution phases of cluster members, the origin of the hot IGM, and the mechanisms responsible for the environmental quenching of star formation.
In all these areas, the proposed spectroscopic survey transcends any other foreseen project.
Acknowledgements
We are grateful to the referee for useful comments. H.D. acknowledges financial support from the Spanish Ministry of Science, Innovation, and Universities (MICIU) under the 2014 Ramón y Cajal programme RYC-2014-15686 and AYA2017-84061-P, the latter being co-financed by FEDER (European Regional Development Funds). M.B. acknowledges partial financial support from the Italian Ministero dell’Istruzione, Università e Ricerca, through the grant ‘Progetti Premiali 2012—iALMA’ (CUP C52I13000140001) and from INAF under PRIN SKA/CTA FORECaST. Z.Y.C. is supported by the National Science Foundation of China (grant no. 11890693). M.N. acknowledges financial support from the European Union’s Horizon 2020 research and innovation programme under the Marie Skłodowska-Curie grant agreement no. 707601.


