


Introduction
It has often been noted that positive feed-backs between snow- and ice-covered surfaces and the atmosphere must have played an important part in maintaining (and perhaps even enlarging) ice- or snow-covered areas during the initial stages of glacierization (e.g. Reference BonacinaBonacina, 1947; Reference Kellogg, Weller and BowlingKellogg, 1975). Indeed, this feed-back process is an implicit part of the “theory of instantaneous glacierization” (Reference Ives, Ives, Andrews and BarryIves and others, 1975). In spite of this, the actual effect of snow or ice cover on local climate has not been adequately studied. A priori, it seems likely that an ice/snow cover will increase albedo, reduce net radiation, and lower temperatures locally, but the magnitude of these effects and their spatial dimensions have rarely been quantified.
To assess the magnitude of the “ice-cap effect”, a study was initiated on a small plateau ice cap on the north-eastern edge of the Hazen Plateau of Ellesmere Island, N.W.T., Canada (Fig. 1). The “St. Patrick Bay ice cap”Footnote * (lat. 81° 57′ N., long. 64°10′ W.) is a thin, extremely flat ice mass with a total relief of less than 50 m. It is completely unshaded by adjacent terrain and surrounded by unglacierized plateau summits at similar elevations (Fig. 2). It thus represents an ideal situation to study the effect of the ice cap itself on the local climate. To this end, a network of meteorological stations was established on and around the ice cap during the summers of 1982 and 1983 (Fig. 3). As the sites differed in elevation by less than 50 m, the major difference between the sites was the underlying surface and proximity to the ice cap. We hypothesized that by initiating the study each year before any significant ablation had taken place, all observations would start with an essentially uniform, snow-covered surface. As the season progressed and snow cover on the land melted off, the topoclimatic effect of the ice cap should become apparent. In fact, this was more or less what happened in 1982 but, in 1983, summer conditions were quite different and the entire plateau remained snow-covered for much of the season. This prevented any further assessment of the “ice-cap effect” but provided a valuable data set from both ends of the spectrum of summer ablation conditions. Mass balance of the ice cap has been discussed by Reference Bradley and SerrezeBradley and Serreze (1987). Here, we discuss the observations made in 1982 and 1983 with particular emphasis on topoclimatic variations. Radiation-balance measurements and the low-level atmospheric structure over the ice cap are discussed elsewhere (Reference Serreze and BradleySerreze and Bradley, 1987; paper in preparation by M.A. Palecki and others).

Fig. 1. Regional location map: S.P.B., St. Patrick Bay; B.L., “Beaufort lakes”; W.B., Wranget Bay; L.B. Lincoln Bay.

Fig. 2. Oblique aerial photograph looking eastward across St. Patrick Bay ice caps (delimited by dashed lines). Photograph is taken from the perspective of the dark arrow in Figure 1. looking across the outer Hazen Plateau. (Copyright Canadian Government aerial photograph T397R-189; 24 June 1950.)

Fig. 3. Vertical aerial photograph showing the location of principal meteorological stations. (Copyright Canadian Government aerial photograph A-16608-15; 6 July 1959.)
Measurement Program
Table 1 summarizes the measurement program carried out at the stations shown in Figure 3. Table II documents the instruments used and sampling frequency. In both 1982 and 1983, incoming short-wave radiation (Q i) and incoming long-wave radiation (I i) were measured only at station Yankee, near the edge of the ice cap (Fig. 4). These measurements were assumed to be representative of the entire study area. As in most studies of energy balance on glaciers and ice caps, a compromise had to be made between instrument siting and the possibility of spatial variations in the parameters to be measured. In this case, the exceptionally open exposure across the transect of interest and the short distance between stations (<3 km) argued in favor of our assumption. Nevertheless, it is possible that, under certain sky conditions, multiple reflection between clouds and snow and ice at the surface may have made this assumption invalid, but in the vast majority of cases the assumption of uniform radiation receipts is probably reasonable for this small (less than 50 km2) area. Development of local clouds or fog, specificially over the tundra or over the ice cap, occurred only rarely.
Table I. “St. Patrick Bay Ice Cap” Meteorological Measurement Program, 1982 and 1983; Parameters Recorded and Height of Instruments (cm)

Table II. Meteorological Instruments Used on “St. Patrick Bay Ice Cap”


Fig. 4. Instrument array at station Yankee (9 July 1982).
The Summers of 1982 and 1983
Summer conditions in 1982 and 1983 were significantly different, as reflected in the ice-cap mass balance for the two years (–144 kg m−2 in 1981–82 and 137 kg m−2 in 1982–83; Reference Bradley and SerrezeBradley and Serreze, 1987). In 1982, the snow-pack became isothermal by Julian Day (JD) 177 (26 June) and run-off commenced soon after. By JD 185, the snow-pack over the surrounding tundra had completely melted. By the end of July, bare ice exhibiting a cryovonite surface was exposed over much of the ice cap. By contrast, in 1983, short periods of melt were interrupted by episodes of snowfall and low temperatures (Fig. 5). Riming was also common, occurring on 33% of all days in the summer of 1983. The snow-pack only became isothermal on JD 193 (12 July) after 3 days of rain which warmed the snow by re-freezing at depth. Snowfall continued intermittently during the rest of July and, by the end of the month, an almost continuous snow cover existed around the perimeter of the ice cap for at least 2 km. This was similar to conditions in 1972 when the net balance (1971–72) was estimated at approximately +140 kg m−2 (Reference Hattersley-Smith and SersonHattersley-Smith and Serson, 1973). Interestingly, climatic data from Alert, the only longterm weather station in the area, 70 km to the north, show that 1972 and 1983 summer temperatures (June–August) were among the lowest of (at least) the last 30 years. By contrast, 1982 was well above the 30 year mean.

Fig. 5. Mean daily air temperatures at 150 cm, station Yankee, 1982 and 1983. (Daily mean based on average of 24 h mean values.)
Table III summarizes the marked differences in principal climatic parameters at station Yankee for the period of overlapping records in both seasons (JD 170–207). In the radiation-balance equation (net radiation, R = Q i (1 − α) + I i + I 0), all parameters were measured except outgoing infra-red radiation (I 0) which was solved as a residual.Footnote * We did not attempt to estimate reflected long-wave radiation.
Table III. Average Values of Major Climatic Parameters at Station Yankee in 1982 and 1983 (JD 170–207)*
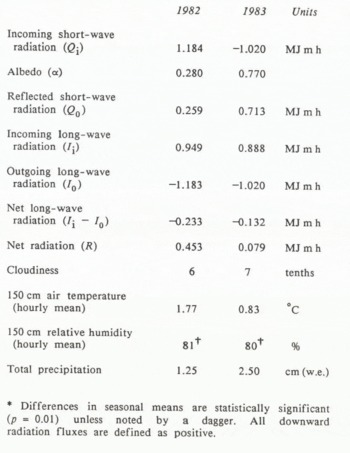
Seasonal averages of incoming short-wave radiation were slightly lower in 1983, probably as a result of the greater cloud amounts, but the differences are not statistically significant. Incoming long-wave radiation was significantly lower in 1983, largely as a consequence of the lower temperatures. The lower surface temperatures and slightly higher cloud amounts in 1983 probably resulted in the less negative net long-wave radiation balance in 1983. Many previous studies have noted the importance of counter-radiation from clouds in reducing net long-wave radiative losses (e.g. Reference HoinkesHoinkes, 1970; Reference HolmgrenHolmgren, 1971; Reference AmbachAmbach, 1974). The major contrast between the two seasons was in surface albedo, reflected short-wave radiation, and net radiation. The overall lower temperatures and frequent snowfalls maintained an extremely high surface albedo for most of the summer (Fig. 6). Albedo only dropped below 50% at station X-Ray, and not until after JD 201 (20 July). As a result, net radiation was markedly lower in 1983.

Fig. 6. Mean daily albedo at station Yankee, 1982 and 1983.
Although no detailed synoptic analysis of the two seasons has yet been undertaken, some insight into the contrasting conditions of the two seasons can be obtained by stratifying the data by wind direction. Figure 7 shows wind-direction frequency and mean wind speed, mean temperature, and mean relative humidity for periods with winds from different directions (data from 1983). Winds were most frequently from either the north-east or south-west which corresponded to the lowest temperatures, highest wind speeds, and generally high relative humidity, particularly from the north-east. By contrast, wind from the relatively infrequent north-west and south-east quadrants was generally much warmer, less strong, and of lower relative humidity. Wind data were not logged automatically in 1982 so data cannot be so precisely stratified for comparison. South/south-westerly and north-easterly air flow were also the principal wind directions in 1982, though north-easterly flow was less common. It appears that air temperatures associated with south-west and south-south-west air flow were higher, probably as a result of the early removal of snow cover on the plateau in that direction in 1982.

Fig. 7. Wind roses of hourly wind-direction frequency and mean wind speed, mean temperature, and mean relative humidity stratified by wind direction.
Topoclimatic Variations, 1982
Radiation balance
Mean hourly totals of the radiation-balance components at the three principal stations (X-Ray, Yankee, and Zebra; Fig. 3) are shown in Table IV. We assume Q i and I i were the same at all three sites. Strong gradients in Q 0 (reflected short-wave radiation) and R (net radiation) were observed from ice-station Zebra through the marginal site Yankee to the most distant site, X-Ray, Figures 8 and 9 show average daily albedo and net radiation totals, respectively, at the three sites. Albedo values (α) were derived from Q 0/Q i where Q i is the value measured at Yankee and Q 0 the value at each site; R was measured independently at each site. Clearly, R is primarily dependent on albedo. The importance of mid-summer snowfall events (JD 183, 184, and 197, 198) is also apparent in reducing the amount of energy available at the surface. Albedo declined first at station X-Ray and then at Yankee. In fact, the initial value of 0.44 indicates that ablation had already begun by JD 170 at X-Ray and snow-free ground was visible first at this site. A base value of approximately 0.16 for both stations was reached by JD 178 (27 June), indicating complete removal of the snow-pack. By contrast, at station Zebra, the original winter snow-pack had not shown any appreciable reduction in albedo by that date; it was not until early July (>JD 186) that any significant change in albedo took place on the ice cap (Fig. 8). Albedo began to decline first at the station farthest from the ice cap, probably due to a lower mean winter snow-pack at this site or perhaps to a lessening of any cooling effect of the ice cap with distance from the ice edge. Unfortunately, logistical problems prevented the establishment of this station until JD 170 which resulted in no radiation data at station X-Ray for the critical period prior to JD 170. In 1983, a snow survey did reveal a reduction in snow depth from station Yankee to X-Ray which, if generally true, might explain the more rapid fall in albedo at the site farthest from the ice cap. It is possible that this gradient is related to drifting snow from the ice cap, though it is not clear why snow would preferentially accumulate in the immediate vicinity of the ice cap itself which is just as exposed as the area around station X-Ray.
Table IV. Mean Hourly Radiation-Balance Values, 1982 (MJ m−2 h−1), JD 170–207


Fig. 8. Mean daily albedo, 1982, for stations X-Ray, Yankee, and Zebra.

Fig. 9. Mean daily net radiation, 1982, for stations X-Ray, Yankee, and Zebra.
It is also of interest that net radiation values at station X-Ray were consistently higher than at station Yankee, nearer the ice-cap edge, throughout the season (Fig. 9). Several explanations for this are possible. First, albedo at station X-Ray was consistently lower than at Yankee even after all snow had melted (though at that time the difference was very small). Secondly, it may be that our assumption of equal receipts of Q i and I i at all sites may be in error, but for this factor to account for the higher measured net radiation at station X-Ray one would have to assume higher total radiation receipts at X-Ray than at Yankee, and this seems unlikely over the distance involved (approximately 2 km). Possibly, a combination of these factors was important at times; nevertheless, it is clear that values of R over the ice cap and over the snow-free tundra nearby are quite different. This is in strong disagreement with the conclusions of Reference OhmuraOhmura (1982), who found similar values of R between tundra and the ablation area of polar glaciers despite differences in albedo. In 1982, the ice cap received only 35% of the net radiation on the surrounding tundra, which represents a profound reduction in radiative energy available for ablation.
Values of I 0 at the three sites show slightly larger values at station Zebra than at Yankee or X-Ray. The difference is ~3%. With a mean temperature difference of 3°C, one would expect I 0 to be 4–5% higher at X-Ray and Yankee than at Zebra, if surface emissivities were the same. There is thus a discrepancy of 7–8% between computed and expected values. At stations X-Ray and Yankee, emissivities were certainly lower than at Zebra, which would account for about half of the calculated differences in I 0; we might thus expect almost the same values of I 0 across the transect in 1982. This does not explain the slightly higher values (~+3%) at station Zebra. Two explanations are possible: instrumental inaccuracy or an invalid assumption regarding the uniformity of Q i and I i across the three sites. We cannot resolve which interpretation is correct but favor the former, since instrumental accuracy of ±5% is certainly no more than one could expect under field conditions.
In conclusion, there is evidence that net radiation was highest at the site farthest from the ice cap and that albedo fell at this site first. Whether this was the result of a higher snow-pack around the ice-cap edge (possibly as a result of snow drifting from the ice cap) or whether the ice cap exerted a thermal effect on snow melt in the immediate vicinity of the ice cap in the early part of the ablation season is not clear. Seasonal net radiation totals beyond the ice cap were markedly higher than on the ice cap itself.
Temperature
Mean hourly temperatures and melting degree-day totals, measured at three levels at stations X-Ray, Yankee, and Zebra, are shown in Table V. At all levels, a clear gradient is apparent from station X-Ray to Zebra with intermediate values at station Yankee, near the edge of the ice cap. Melting degree-day totals on the ice cap were only 40–65% of values at station X-Ray. Differences between the ice-cap site and the other two sites are statistically significant (p = 0.001); differences between the two tundra sites are not. The greatest difference between the three sites is at the 15 cm level.
Table V. Mean Hourly Temperatures and Melting Degree-Day Totals, JD 170–207, 1982 (˚C)

Although the mean temperature at station Yankee, near the ice edge was intermediate between values on the tundra at X-Ray and on the ice at Zebra, it is not clear whether this can be interpreted as an “ice-edge cooling effect”. If this were the case, during periods of northerly air flow (i.e. involving advection of cooler air from the ice cap), temperatures at station Yankee should have been lower than at other times. Unfortunately, wind directions were not accurately measured in 1982 but visual observations of direction indicated that the prevailing air flow was towards the ice cap (i.e. from Yankee to Zebra) and not away from it. Furthermore, stratification of temperature data from station Yankee revealed no statistically significant difference between times of northerly or southerly air flow. Further study of this question is needed before a definitive conclusion can be reached.
If station X-Ray is assumed to be beyond any thermal influence of the ice cap, the total cooling effect can be quantified by subtracting temperatures at Zebra from those at X-Ray. This gives mean values of 1.86°, 0.98°, and 0.82° C at 15 cm, 150 cm, and 300 cm, respectively. Thus, the “cooling effect” is most apparent at the lowest level measured and decreases with height. Studies of White Glacier, Axel Heiberg Island, have also attempted to quantify this cooling effect. Reference Müller and Roskin-SharlinMüller and Roskin-Sharlin (1967) calculated the difference between screen temperatures (approximately 150 cm) at their “Lower Ice” and “Base Camp” stations. The former was in the center of a 1 km wide valley glacier (ablation zone) and the latter approximately 2 km away in the adjacent unglacierized valley. Both had similar elevations (approximately 200 m a.s.l.). These results indicated a mean cooling effect (for June, July, and August 1961) of approximately 1.5°C at 150 cm, somewhat higher than in this study. However, the topographic situation of the two areas is quite different with significantly more relief in the Axel Heiberg Island study; consequently, effects of cold-air drainage, radiation from valley walls, shading, etc., may have been important factors in that study. Nevertheless, the results indicate a similar thermal effect of 1–1.5°C at 150 cm.
Reference Müller and Roskin-SharlinMüller and Roskin-Sharlin (1967) also arrived at two other interesting conclusions which can be tested with our data set. They noted that the “cooling effect” was greater on clear days with high global radiation receipts than on cloudy days and that the cooling effect becomes greater as the season progresses. Table VI shows mean temperatures at the three stations and three levels for ≥7/10 and ≤3/10 cloud cover. As one might expect, temperatures are generally higher under relatively cloud-free conditions but the “cooling effect” is greater at such times than during cloudy periods (Table VI, column 5). This is probably because during relatively clear sky conditions, air temperatures over the tundra can rise rapidly (due to lower albedo and limited sub-surface heat flux), so that the net radiation is available for heating the atmosphere. By contrast, over a snow and ice surface, net radiation is lower (due to higher surface albedo) and much of the energy is used in melt, thereby reducing sensible-heat flux to the atmosphere. Consequently, any increase in incoming radiation results in a smaller temperature increase over the ice cap. As a result, the difference between the sites is enhanced under clear skies.
Table VI. Mean Hourly Temperatures and “Cooling Effect” (°C) for Different Conditions of Cloudiness

Table VII shows the “cooling effect” by sub-period. Reference Müller and Roskin-SharlinMüller and Roskin-Sharlin (1967) suggested that the increase in “cooling effect” as the summer progresses is due to the (almost) unlimited capacity of a glacier to absorb heat throughout the summer, whereas (once snow cover has melted) the lower specific heat of the tundra surface and limited sub-surface heat flux results in a strong sensible-heat flux to the atmosphere and much higher temperatures in the adjacent air layer. Consequently, as the summer season progresses, the “cooling effect” increases. The St. Patrick Bay ice-cap data also show a tendency for the cooling effect to increase as the season progresses. However, the maximum “cooling effect” occurred during the period JD 180–189, a period of generally clear skies and relatively high temperatures after snow cover had melted from the tundra; these conditions are not inconsistent with Müller and Roskin-Sharlin’s observations.
Table VII. “Cooling Effect” (°C) by 10 day Intervals

Analysis of the low-level thermal structure of the atmosphere at the three sites provides further insight into the nature of an ice-cap “cooling effect”. Seasonal mean lapse-rates (JD 170–207) in the 15 cm to 150 cm level were −0.82, −0.79, and −0.29°Cm−1 at stations X-Ray, Yankee, and Zebra, respectively. The difference between the mean at the two tundra sites is not significant but between those and station Zebra is highly significant (p = 0.001). These mean values reflect a higher frequency of inversions at the ice station, as a result of the continual presence of a cold snow or ice surface. It should be noted that the actual surface temperature at station Zebra remained ≤0°C throughout the season, so a temperature inversion also generally existed in the 0–15 cm layer; this would not have been so at the other two sites. The diurnal frequency of inversions between 15 cm and 150 cm at the three stations is shown in Table VIII. Inversions reach a maximum frequency at all sites during low sun periods, as one would expect. Overall, 15–150 cm inversions occur 32% of the time on the ice cap compared to only 11–13% at the other sites. During these periods, sensible-heat flux is directed towards the surface. Since the ice-cap surface temperature cannot increase above 0°C, the inversion is not as readily disturbed as over the tundra and the near-surface air temperature remains low. Over the snow-free tundra, relatively high surface temperature results in an upward sensible-heat flux, warming the near-surface atmosphere. Thus, in a typical mid-summer situation, with an inversion over the ice cap and a lapse profile over the tundra, as air moves from snow-free to the snow- and ice-covered surface, the lower atmospheric temperature structure is modified as shown schematically in Figure 10.
Table VIII. Per Cent Valid Cases With Inversion Conditions in 15–150 cm Layer, 1982 (JD 170–207)


Fig. 10. Schematic diagram of cooling effect of ice cap on lower atmosphere with wind direction from left to right. Vertical lines A to F represent time-transgressive (i.e. sequential) temperature profiles within an air mass which is cooled near the surface as it passes over the ice cap.
It is of interest that the “cooling effect” has a pronounced diurnal pattern, with maximum values in late afternoon and minimum values during low-sun periods (Fig. 11). This characteristic probably reflects the greater diurnal range of air temperature over the tundra than over the ice cap, where the daily range is smaller due to energy consumed in melt. Although a pronounced diurnal variation in inversions was recorded at both sites (Table VIII), the difference in inversion frequency between the sites follows a similar diurnal pattern to that of the “cooling effect”.

Fig. 11. Mean hourly “cooling effect” (X-Ray–Zebra mean temperatures) at 150 cm level, based on JD 170 to JD 207 1982.
In conclusion, a thermal gradient was observed along a transect perpendicular to the ice-cap edge. This was maximized during relatively cloud-free periods. Maximum temperature differences between ice-cap and tundra sites were observed at low levels (15 cm). The cooling effect of the ice cap was less at the start of the ablation season than subsequently. Inversions were more common over the ice cap than over the tundra and a diurnal cooling effect, probably related to this difference, reached a maximum in late afternoons.
Topoclimatic Variations, 1983
As noted earlier, climatic conditions in the summer of 1983 were markedly different than in 1982. This is clearly illustrated by comparing daily albedo and net radiation measurements (Figs 12 and 13; cf. Figs 8 and 9). In 1983, surface albedo was considerably higher and net radiation values correspondingly lower. Furthermore, since the persistent snow cover in 1983 created similar surface conditions at all measurement sites, topoclimatic differences between the sites were greatly reduced. Except for brief melt episodes (e.g. JD 170–174 and 181–183 when frost-hummocks were exposed at station X-Ray), albedo was similar at all sites for most of the season. Only after approximately JD 198 did the area around X-Ray become extensively snow-free, resulting in lower short-wave radiation losses for the season as a whole (Table IX). Net radiation at all sites was extremely low, and on some occasions (with clear skies) negative daily totals were recorded.

Fig. 12. Mean daily albedo in 1983 at stations X-Ray, Yankee, and Zebra.

Fig. 13. Mean daily net radiation in 1983 at stations X-Ray, Yankee, and Zebra.
Table IX. Mean Hourly Radiation Values (MJ m−2 h−1), JD 170–207

Mean temperatures and melting degree-day (MDD) totals at the three stations are shown in Table X. Temperatures were significantly lower in 1983; differences between the two seasons were greatest at the tundra site, X-Ray, and least on the ice cap (Zebra). The largest differences at all sites occurred at the 15 cm level (2.7 °C lower at X-ray in 1983). Melting degree-day totals were very similar at all sites in 1983, whereas in 1982 MDD totals at station Zebra (15 cm level) were only 40% of those at X-Ray. Clearly, the extensive snow cover in 1983 eliminated the topoclimatic effects which were manifested so clearly in 1982.
Table X. Mean Hourly Temperatures and Melting Degree-Day Totals, JD 170–107, 1983, (°C)

Discussion
Topoclimatic differences observed in 1982 between the ice-cap and tundra sites can be considered in terms of two conceptual models shown in Figure 14. Snow and ice cover, with a high albedo relative to tundra, limits net radiation and hence sensible- and latent-heat flux to the atmosphere. Much of the energy absorbed is used in melting of the snow and ice, so the substrate acts as a sink for energy at the surface and this continues long after snow cover has melted from adjacent tundra regions. Surface temperature on the ice cap is limited to ≤0°C, so near-surface inversions are common, restricting turbulent-heat exchange and energy flux to the surface. Low surface roughness over the ice cap may enhance this effect. The net result is lower temperatures over the snow and ice surface which may favor diurnal riming and delay the seasonal decline in albedo. Lower temperatures over the snow and ice may also lead to cold-air advection to adjacent areas, retarding melt and thereby delaying the exposure of tundra surfaces which would rapidly warm and reverse the advective effect. By contrast, a tundra/felsenmeer surface has a much rougher surface on which protruding rocks and vegetation may remain exposed above the regional snow surface. The substrate has a lower albedo and net radiation at the exposed surface is thus high. Sub-surface heat flux is small, and surface temperatures soon rise to levels significantly above 0°C. The unstable temperature profiles which result favor high sensible-heat flux to the atmosphere, leading to high surface-air temperature advection to adjacent areas and rapid removal of the snow cover. Tundra surfaces dry out rapidly reducing latent-heat flux and directing net radiation into sensible-heat flux to the lower atmosphere. Warm-air advection to the adjacent snow cover and ice cap will be minimal at first but increase rapidly as the ablation season progresses and more land surfaces become exposed.

Fig. 14. Conceptual model of feed-backs involved in (a) maintenance of snow and ice cover, and (b) maintenance of snow-free tundra/felsenmeer surfaces.
Does an ice cap modify local climate to such an extent that its preservation is favored? Observations suggest that conditions on the ice cap bring about a “cooling effect” relative to adjacent snow-free tundra areas, and that this cooling effect is absent when snow cover is extensive (as in 1983). However, whether the ice cap affects adjacent areas directly by cool-air advection is not clear on the scale studied. Cooler air over the ice cap is the result of heat flux to the snow and ice; the extent to which this occurs in a season will vary, but prolonged cool-air advection must eventually be balanced by significant mass loss from the ice cap.
Summary
Meteorological measurements in the lowest 3 m of the atmosphere were conducted along a ~5 km transect from the center of a small plateau ice cap (on north-eastern Ellesmere Island) to the adjacent unglacierized tundra/felsenmeer. Differences in relief across the transect were <50 m and the entire area was completely unshaded. The major difference between the sites was thus the underlying surface and proximity to the ice cap. Measurement began when snow cover was extensive across the entire area, and continued through the ablation seasons (of 1982 and 1983). The objective was to assess the effect of the ice cap on modifying local climate. The following results were obtained:
-
1. Seasonal net radiation totals were highest at the site farthest from the ice cap and lowest on the ice cap. The ice-cap site received only 35% of the net radiation on the surrounding tundra. Intermediate values were recorded near the ice-cap edge.
-
2. A strong temperature gradient was observed between the tundra and the ice cap. This gradient was maximized at the 15 cm level. Melting degree days on the ice cap were only 40–65% of those on the adjacent tundra. Intermediate values were recorded near the ice-cap edge. Maximum temperature differences between the sites occurred under clear skies after seasonal snow cover on the tundra had melted.
-
3. Low-level inversions are more common over the ice cap than over the tundra and a diurnal cooling effect, probably related to this difference, reaches a maximum in late afternoon.
-
4. In 1983, extensive and persistent snow cover eliminated any significant topoclimatic differences between the sites.
-
5. A conceptual model of feed-back effects which tend to assist in the maintenance of a snow and ice cover is presented. Similarly, a model of surface–atmosphere interactions over snow-free tundra/felsenmeer is presented.
-
6. Observations indicate that the ice cap may bring about a “cooling effect” relative to the adjacent snow-free tundra and that such an effect is absent when snow cover is extensive. Any cool-air advection from the ice cap is the result of heat flux to the snow and ice. If this continued for a long time, mass losses from the ice cap would inevitably result.
-
7. Further studies are needed to isolate and quantify topoclimatic conditions on and around plateau ice caps of varying size.
Acknowledgements
This work was supported by the U.S. National Science Foundation, grant ATM80-17745 to the University of Massachusetts. Logistical support was provided by the Polar Continental Shelf Project, Department of Energy, Mines and Resources, Ottawa. We are grateful to M. Palecki, C. Allen, M. Retelle, J. Fabel, and R. Friend for assistance in the field.


