


Introduction
The seminal work of Barker et al. suggested that suboptimal intrauterine growth and its frequent manifestation, low birth weight (LBW; ⩽2500 g), increase susceptibility to diseases that occur later in life.Reference Barker 1 , Reference Barker, Osmond and Law 2 Many cohort studies have subsequently shown that lower birth weight is associated with adult morbidity and mortality,Reference Baker, Olsen and Sorensen 3 and specifically with increased risk of cardiovascular disease,Reference Barker, Osmond and Law 2 , Reference Huxley, Owen and Whincup 4 hypertension,Reference Leon, Koupil and Mann 5 , Reference Johnson and Schoeni 6 type 2 diabetes mellitus,Reference Whincup, Kaye and Owen 7 stroke,Reference Johnson and Schoeni 6 – Reference Rich-Edwards, Stampfer and Manson 8 chronic lung diseaseReference Barker, Godfrey and Fall 9 and chronic renal disease.Reference Hoy, Kile, Rees and Mathews 10 – Reference Dyck, Klomp and Tan 12
For some years we have followed a cohort of Australian Aboriginal people from one remote community, in whom birth weights had been recorded. This tribal group lives on two islands off the coast of the Northern Territory, about 90 km from Darwin. A Catholic mission was established there in 1911 by Father Francis Xavier Gsell, on behalf of the Missionaries of the Sacred Heart. In 1956, the Aboriginal population was estimated by Dr John Hargrave, the Northern Territory’s first Aboriginal Health Officer, to be about 800, while, in the 2011 census, the Aboriginal population was estimated at 2263 people. 13 This community has very high rates of renal failure, and mortality rates have been among the highest in Australia.Reference Spencer, Silva and Snelling 14 , Reference Hoy, Mathews and McCredie 15
Subjects in this study cohort were born to Aboriginal mothers between 1956 and 1985 and their birth weights had been recorded at delivery (n=995). In accordance with World Health Organisation criteria, we defined infant deaths as those occurring in the first year of life, childhood deaths as those occurring between 1 and <15 years of age, and adult deaths as those occurring at ⩾15 years of age.
We have previously described the very high frequency of LBW in those born between 1956 and 1964, and a modest improvement in birth weights through to 1985.Reference Hoy and Nicol 16 We have also documented marked reductions over time in death rates, starting in the mid-1960s, of infants (35 natural deaths), and of children (55 natural deaths) and, against that background, we showed that lower birth weights predisposed to higher rates of both infant and childhood natural deaths (Fig. 1a and b).
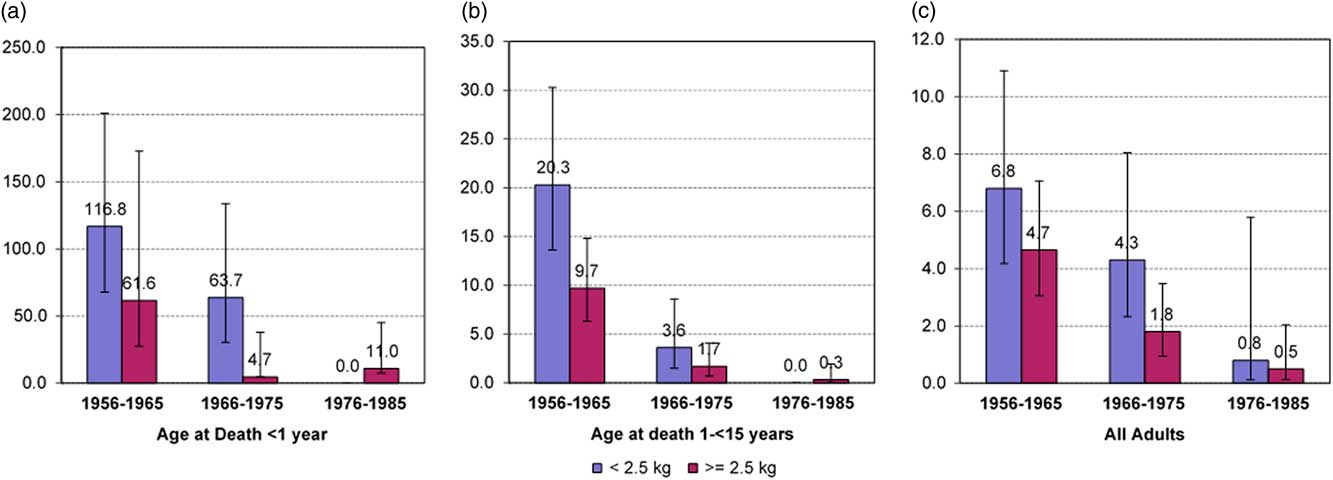
Fig. 1 Rates of natural death in infants (<1 year) (n=35) (a), Children (1−<15 years) (n=55) (b) and adults (⩾15 years) (n=61) (c) by birth cohort and birth weight below and above 2.5 kg. Rates are expressed as deaths per 1000 person-years.
Furthermore, among those who survived infancy and childhood, we described higher rates of death as young adults (deaths at 15 to <37 years of age) in those of lower birth weights, with a hazard ratio of 2.69 (95% confidence interval 1.3–5.5, P=0.007).Reference Hoy and Nicol 16 That study, however, was limited by the young age of adults with recorded birth weight and by the small number of adult deaths to that point (n=31). Here we describe results 4 years later, with more person-years of follow-up, with a higher maximum age of participants, and almost double the numbers of adult deaths (n=61).
Methods
Survival times for adults were calculated from his/her 15th birthday until death, start of dialysis or until the censor date of 31 December 2010. The primary outcome was death from natural causes. Subjects were divided into three cohorts according to year of birth: 1956–1965, 1966–1975 and 1976–1985. Rates of adult natural death were compared within each cohort by birth weight and birth weight category. Survivals by birth weight as a continuous variable, and by birth weight category (LBW v. normal birth weights, or birth weights around the cohort-specific group medians) were evaluated by the Cox proportional hazards method, with adjustment for year of birth, to account for improving survivals over time.
The ascertainment of terminal events and their causes, which had been recorded in narrative in the clinic death logs, has been described previously.Reference Hoy and Nicol 16 That information was sometimes checked through individual medical records, and deaths were cross-checked against the parish church logs maintained by the local priests.Reference Hoy, Mott and McLeod 17 The vital status of individuals who were not personally known to the investigators was confirmed by two Aboriginal community members, both of whom were born in the 1940s. They had a memory of the entire observation period, and knew everyone from the birth cohort who was still alive, and his/her whereabouts. ‘Renal deaths’ were also ascertained from regional dialysis unit records, maintained since the first community member started that treatment in 1982. The start of dialysis was considered a ‘renal death’, because without renal replacement therapy, those people would have died shortly thereafter.
Statistical analyses were performed with the Stata version 12.1 (StataCorp, College Station, TX, USA). Probability values of <0.05 were considered statistically significant.
This work was conducted through specific projects, ‘Epidemiology and Prevention of renal disease in Australian Aborigines, Parts 1 and 2’, with ethics approval from the Human Research Ethics Committee of the Royal Darwin Hospital and Territory Health Services, NT (HREC: Number: 91/20; HREC:Number: 94/02) and through the project ‘An updated view of chronic disease profiles and chronic disease deaths in the Tiwi community: a ten year follow-up’, approved by the Human Research Ethics Committee of the Menzies School of Health Research, NT (HREC: Number: 03/51) and The University of Queensland, QLD (HREC: Number: 2004000028). The Tiwi Land Council also approved this research.
Results
Birth weights were recorded for 995 people of Aboriginal assignment from this tribal group, who were born between 1956 and 1985. There were 102 deaths during infancy and childhood. The predisposing effects of LBW to those deaths have been described previously.Reference Hoy and Nicol 16
Eight hundred and ninety three (893) persons survived beyond their 15th birthday. Table 1 describes the characteristics of those people, who are the subjects of this adult mortality analysis. Average birth weights were low and rates of LBW were high. However, birth weights increased over time: about one-third of all subjects in the first birth cohort (1956–1965) and one-quarter in the last birth cohort (1976–1985) had been LBW babies.
Table 1 Study group by birth cohort

Only births for individuals in the study population who reached adulthood (≥15 years) are included.
Among the entire study cohort, there were 61 natural deaths and 43 deaths of misadventure after their 15th birthday. Deaths of misadventure included injuries from accidents, burns, drowning, jelly fish stings, crocodile attack, homicides, suicides and intoxication. The derived ‘causal’ categories of natural deaths of adults are summarized in Box 1. Several people had more than one causal assignment of death, most often pneumonia/sepsis/respiratory failure with coexisting heart failure.
Box 1 Categories of natural death in adults (⩾15 years) by primary causal assignment from 1971–2010 (n=61)
Assorted: congenital abnormalities, cerebral palsy, lupus, rheumatic heart disease, liver failure, primary pulmonary hypertension, cancer (n=13)
Pulmonary/pneumonia/sepsis: pneumonia, bronchitis, bronchiectasis, respiratory failure, chronic lung disease, acute respiratory disease, septic shock (n=12)
Cardiovascular: heart attack, coronary artery disease, acute myocardial infarction, cardiac arrest, congestive heart failure (n=15)
Renal: maintenance dialysis, or renal failure death without dialysis (n=21)
∙ There were a total of 73 causal and contributing assignments
Table 2 shows the numbers and rates of natural deaths by birth cohort and by LBW. There was a marked temporal trend of falling mortality overall (P=0.01). Death rates of those born in the second and third cohorts were 49% and 14% of death rates of those born in the first cohort. In the 1956–1965 and 1966–1975 birth cohorts, death rates were higher among those of lower birth weights. There were only three adult deaths among those born from 1976 to 1985, so no assessment of birth weight associations could be made.
Table 2 Rates of natural death in adults by birth cohort and low birth weight (LBW)
Bwt, birth weight.
*P=0.01 for trends in aggregate rates by birth cohort.
Figure 1c demonstrates these phenomena for the aggregate group, and the data are shown separately by sex in Supplementary Material Figure S1. The similarities with trends described for infants and children (Fig. 1a and 1b) are striking.
Table 3 shows the hazard ratio for death associated with LBW of 1.76 (CI 1.06–2.91). It also shows that death rates were significantly associated with birth weight around the group-specific medians, and with birth weight on a continuum. Over this range of birth weights, each kg increase in birth weights was associated with a 48% reduction in young adult deaths, with similar trends in both males and females.
Table 3 Hazard ratios (95% CI) for all-cause natural death in adults by birth weight, adjusted for year of birth and gender (n=893)

Confirming these observations, and shown in Fig. 2, people who died had lower birth weights than those who did not die before the censor date, with the phenomenon suggested in males and females.
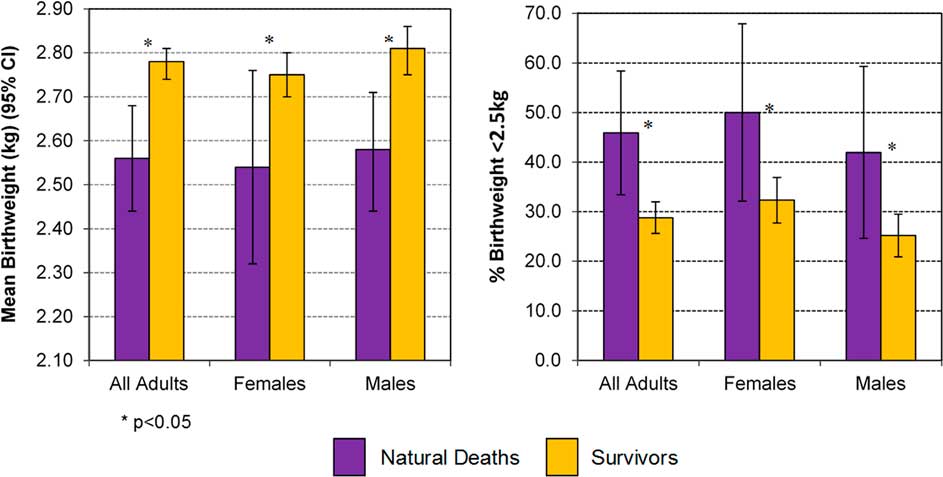
Fig. 2 Birth weight and percentage with birth weight <2.5 kg in those with natural death v. Survivors, in adults ⩾15 years.
Figure 3 supports higher rates of LBW among the 61 who died natural deaths, when assessed against a 29.3% prevalence of LBW in the whole ‘birth weight cohort’, with the exception of those who died over the age of 45 years. It also suggests that LBW was most prevalent among those who died at the youngest ages.
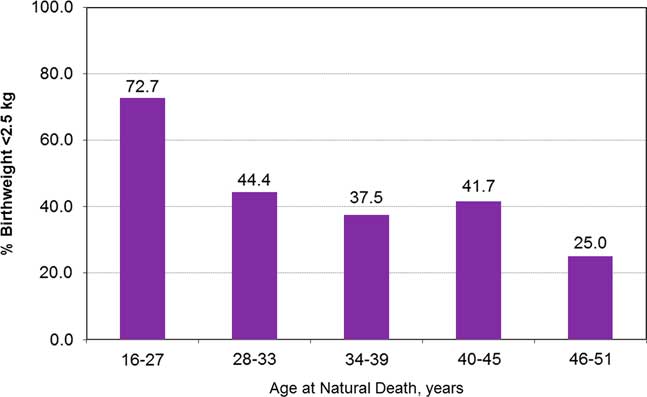
Fig. 3 Percentage of persons with birth weight <2.5 kg by age at natural death, in adults ⩾15 years.
Table 4 summarizes the ages at death and the birth weight data by causal categories of natural death. Deaths from respiratory causes or sepsis and deaths in the assorted category generally occurred at younger ages, and in people who had lower birth weights, while renal failure and cardiovascular deaths generally occurred at higher ages and their rates of LBW were less extreme.
Table 4 Age at death and birth weight of adults ⩾15 years by categories of death

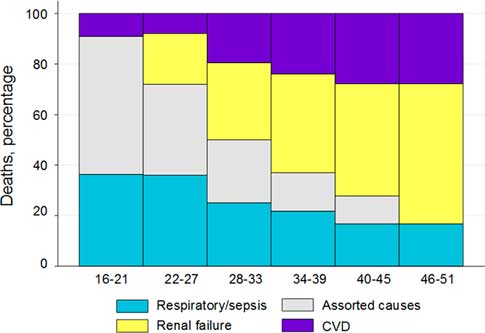
Figure 4 shows these changes on a continuum of age at death. With older age at death, the assorted causes of death disappeared, the proportions of respiratory death were lower and renal and cardiovascular deaths became increasingly dominant.

Fig. 4 Percentage of causal category of adult natural deaths by age at death, with smoothing of percentages of deaths over three consecutive categories of death.
Figure 5 shows the survival of people as young adults up to the potential age of 41 years, by category of birth weight. This analysis includes only people born before 1970 (n=344) because younger people had not been born 41 years before the censor date. The lower survival of LBW subjects from all-cause natural deaths is clear. The hazard ratios, adjusted for sex and year of birth, are shown in Table 5. The relationships were also significant for all-cause natural and pulmonary death around the median birth weight values.
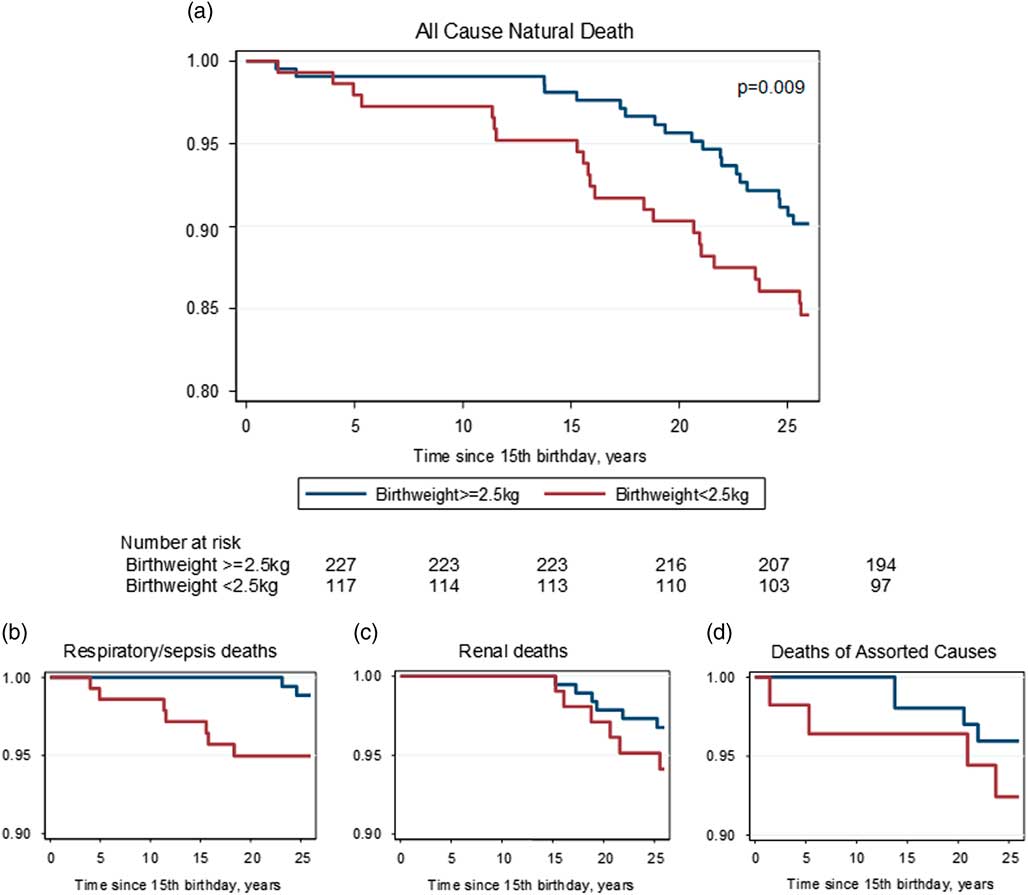
Fig. 5 Kaplan–Meier curves for all-cause natural (a) and primary causes of death (respiratory/sepsis (b), renal (c) and assorted causes (d)) in first 25 years of adult life, adjusted for year of birth and sex, and categorized by low birth weight (<2.5 kg) v. higher.
Table 5 Hazard ratios (CI) for natural death, birth weight <2.5 kg v. higher, in first 25 years of adult life, for people born before 1970 (n=344), adjusted for sex and year of birth

Among the 43 adults with deaths of misadventure, 38 were males and five were females; 13 were born in the first birth cohort, 13 in the second and 17 were born in the third cohort; 27 were suicides (25 males and two females) and 16 were other deaths of misadventure; 25 of those deaths were in people of birth weights above their group median and there was no association between death by suicide and LBW.
Discussion
The current study confirms that LBW predisposes to natural deaths of young adults. The effect also operates around group-specific median birth weight values, around the <2.5 kg definition of LBW, and across birth weight over a continuum.
The birth weight effects were apparent around the high mortality rates of the first two birth cohorts, but could not be discerned in the youngest group, among whom there were, to that point, very few adult deaths
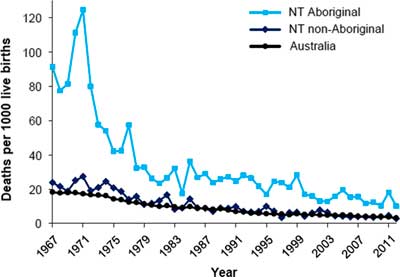
High rates of LBW and a rapid fall in early life mortality have combined to expose the association of lower birth weights with natural deaths in these young Aboriginal adults. This confluence of events is probably driving much of the burden of premature natural deaths experienced by remote living Aboriginal Australians more broadly. Certainly the fall in infant mortality is generalizable to all Northern Territory Aboriginal babies, as shown in Fig. 6. 18 Thus the epidemic of chronic disease in Aborigines appears to be a legacy, in part, of an earlier therapeutic triumph which reduced mortality in infancy and childhood in a population with very low birth weights.
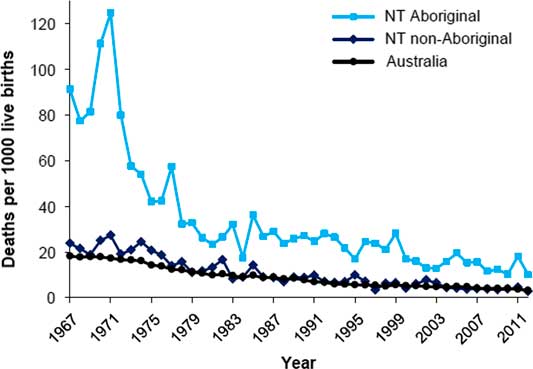
Fig. 6 Infant mortality, by Indigenous status, Northern Territory and Australia, 1967–2012.
This study has many strengths. There was a definitive denominator for those at risk, i.e. those with reported birth weight. There was assurance of Indigenous and tribal assignment, complete ascertainment of outcomes and the recording of birth weights was precise. The derivation of causal categories of natural death from local clinic narratives was necessary in the early part of the observation period, which antedated the official government-based recording of deaths, so this approach was continued through the latter part of the study for consistency. It was a major advantage to have the detailed documentation by the clinical staff who knew the patients well; it revealed the subtleties of coexisting diagnoses, and is undoubtedly more accurate than any assignment made by proxy coders. Furthermore, our use of a combined endpoint for renal deaths, which included all people who started dialysis as well as those who died with terminal renal failure, is the only indicator which reflects the true frequency of end stage kidney disease,Reference Sparke, Moon and Green 19 We have emphasized the importance of that approach in a recent review,Reference Hoy, Mott and McDonald 20 mentioned it in the most recent Burden of Disease Study, 21 and used it in a manuscript on changes in mortality among Tiwi Islanders.Reference Hoy, Mott and McLeod 17
One limitation of the study is lack of precise data on prematurity. Gestational age estimates were not recorded in the earlier subjects in the birth weight cohort, and thereafter were recorded only sporadically. However, prematurity, as well as intrauterine growth retardation, remains common, with current estimated proportion of about 18% of live births in remote communities.Reference McComb and Woods 22
Our findings are compatible with both a study of a Danish cohort of men, in whom all-cause mortality at ages 15–49 years was associated with LBW or short length at birth,Reference Andersen and Osler 23 and with a Finnish study, in which lower birth weights predicted premature deaths before the age of 55 years.Reference Kajantie, Osmond and Barker 24 A recent systematic review of 22 studies, that included a total of 36,834 deaths, concluded that there was a 6% lower risk of all-cause mortality (adjusted HR 0.94, 95% CI: 0.92, 0.97) per kg higher birth weight for men and women combined.Reference Risnes, Vatten and Baker 25 Interestingly, Baker et al.Reference Baker, Olsen and Sorensen 3 showed a U-shaped association of birth weight and mortality, with lower and higher birth weights contributing to higher mortality. We did not observe a U-shaped effect, but our highest recorded birth weight was only 4.25 kg and our number of deaths was relatively small.
LBW had an exacerbating effect on all major ‘causal’ categories of natural adult death, and the association with pulmonary deaths was especially striking. The observation is consistent with adverse effects of intrauterine growth retardation and prematurity on fetal lung development and supports population studies that show impaired lung function and accelerated lung ageing in people of LBW.Reference Barker 1 , Reference Barker, Godfrey and Fall 9 As early as 1991, Barker, Osmond et al described, in adult males in the United Kingdom, the predisposing effect of LBW on chronic bronchitis and respiratory functions as well as on deaths from chronic lung disease, and they specifically noted that forced expiratory volume was directly related to birth weight.Reference Barker, Godfrey and Fall 9 They commented that growth of the airways, as opposed to growth and expansion of the alveoli, is largely completed in utero, and is irrevocably constrained with LBW. Johnson and Schoeni described, in the US population, a 60% increase in asthma at age 50 in people of LBW.Reference Johnson and Schoeni 6 In our data, an accentuated risk for pulmonary deaths is evident in the earliest decades of adult life. Moreover, it represents a continuation of the LBW-associated exacerbation of risk for pulmonary deaths we previously described in infants and children.Reference Hoy and Nicol 16 The apparent exacerbations of risk for cardiovascular and renal deaths become more prominent in the second and third decades of adult life. The association of LBW with renal deaths is of special interest, given that this community has had the highest rates of renal failure in Australia.Reference Spencer, Silva and Snelling 14 One potential mechanistic link of LBW to kidney disease is through reduced nephron endowment that is associated with intrauterine growth retardationReference Hughson, Farris and Denton-Douglas 26 ; development of the full complement of nephrons is completed by the 36th week of gestation and is impaired by an adverse intrauterine environment and an abbreviated pregnancy. There are clear analogies between kidney development and development of the airways.
The predisposing effect of lower birth weights to non-communicable disease deaths is compatible with our findings in this community of an inverse association of birth weight with chronic disease markers, specifically albuminuria and blood pressure levels.Reference Hoy, Kile, Rees and Mathews 10 , Reference Singh and Hoy 27 Results of a recent systematic reviewReference McNamara, Gubhaju and Chamberlain 28 supported the fact that LBW is an important risk factor for cardiovascular disease among other adult aboriginal populations. Canadian Saskatchewan people with end stage renal disease also had a >3 times higher odds of LBW.Reference Dyck, Klomp and Tan 12 These findings are compatible with previous studies among non-aboriginal groups.Reference Huxley, Owen and Whincup 4 , Reference Lackland, Bendall and Osmond 11
Thus birth weight is an important indicator of long-term adult health. Fortunately, in our target population, birth weights are continuing to increase; currently average birth weights of remote Aboriginal people in the Top End of the Northern Territory are about 3.1 kg, and rates of LBW about 16%.Reference Hall, Case and O’Neil 29 An intersecting challenge now is the prevention of fetal macrosomia, with increasing rates of gestational diabetes.Reference Templeton and Pieris-Caldwell 30
In the context of healthy pregnancies, there is still much to improve. As of 2014, the average maternal age was 5 years less than in non-indigenous people, and 19% were teenagers 31 ; 50% smoke during pregnancy, compared with 12% of non-indigenous mothers. Nationally, the Aboriginal rates of prematurity and LBW are 12.5 and 12.6%, respectively, compared with 7.5 and 6% in non-indigenous people. As noted, an added complication is the high rates of gestational diabetes, which are 1.5 times those of non-indigenous people.Reference Templeton and Pieris-Caldwell 30 Insufficient access to antenatal care, especially in remote areas, exacerbates many of these risks. By focussing on improving maternal health, public health policy can aim to break the inter-generational cycle of chronic disease.
Acknowledgements
The authors thank this community, its clinics and its Land Council for their approval of, and participation in, this research. They thank the clinics especially for access to delivery log books, death logs and medical records. This study would not have been possible without the meticulous work and records of the mission clinic, run by the Sisters of Our Lady of the Sacred Heart, and the assistance and the parish records supplied by the parish priests, members of the Order of the Missionaries of the Sacred Heart. The authors are grateful to Dr Alan Walker for access to the Royal Darwin Hospital delivery room logs, and Emma Kile, Gurmeet Singh and Andrew White for assisting in the collection of birth weights. They thank the Renal Team at Menzies School of Health Research for all their good work over the years. They also thank Professor John Mathews, who, as Founding Director of the Menzies School of Health Research, stimulated interest in the influence of birth weight on health.
Financial Support
The Tiwi Land Council provided seed funding of US $50,000 in 1992 to start this ongoing engagement, through the Stanley Tipiloura Fund. Professor Wendy Hoy received additional funds that have contributed to the current study through the National Health and Medical Research Council (NHMRC) Project Grants ‘Epidemiology and Prevention of Aboriginal Renal. Disease, Part 1’ grant number 921134, and ‘Epidemiology and Prevention of Aboriginal Renal Disease, Part 2’ grant number 951342; as well as the NHMRC Program Grant ‘Health outcomes monitoring and evaluation: learning about activity, nutrition, diet and social factors (HOMELANDS)’ grant number 320860; and The NHMRC Australia Fellowship ‘Chronic Disease in High Risk Populations’ grant number 511081. The Colonial Foundation of Australia contributed funding through four grants: Studies on the Susceptibility to Renal Disease (2001–2005); Aboriginal Chronic Disease Outreach Program in Australia, Western Australia (2001–2005); Studies on Kidney and Related Chronic Disease in Aboriginal People, Part 2 (2006–2008); and Primary and Secondary Prevention of Chronic Disease in Aboriginal People in Remote Areas (2009–2011). Dr Hoy is currently supported by the NHMRC Centre of Research Excellence in Chronic Kidney Disease, grant number 1079502.
Conflicts of Interest
None.
Ethical Standards
The authors assert that all procedures contributing to this work comply with the ethical standards of the relevant national guidelines on human experimentation (National Statement on Ethical Conduct in Human Research (2007) – Updated May 2015) and with the Helsinki Declaration of 1975, as revised in 2008. Ethics approval for work that includes the birth weight and mortality reviews was granted for the specific, Epidemiology and Prevention of renal disease in Australian Aborigines, Part 1 (HREC:Number: 91/20) and Epidemiology and Prevention of renal disease in Australian Aborigines, Part 2 (HREC:Number: 94/02), by the Ethics committees of the Royal Darwin Hospital and Territory Health Services, NT. Ethics approval for this work was also granted as a third project, An updated view of chronic disease profiles and chronic disease deaths in the Tiwi community: a 10-year follow-up, by the Human Research Ethics Committee of the Menzies School of Health Research, NT (HREC: Number: 03/51) and The University of Queensland, Brisbane, QLD (HREC: Number: 2004000028). The Tiwi Land Council also approved this research.
Supplementary material
To view supplementary material for this article, please visit https://doi.org/10.1017/S2040174417000903


 Open access