Dietary fibre (DF) modulates daily voluntary feed intake in association with changes in feeding behaviour: number of meals, meal volume, meal duration and within-day spreading of meals( Reference Bakare, Ndou and Chimonyo 1 ). In monogastric animals as pigs and humans, these effects may differ according to the origin and composition of DF and body weight (BW) of the subject. As an example, dietary inclusion of sugar beet pulp (neutral-detergent fibre (NDF) content=27 %) reduced average daily feed intake (ADFI), meal volume and feeding rate, whereas inclusion of wheat bran (NDF=23 %) did not affect ADFI in pigs of 14 kg BW( Reference Whittemore, Kyriazakis and Tolkamp 2 ). The impact of DF on satiety can be explained by (1) dietary energy dilution, (2) a direct effect due to the increase in digestive content volume with activation of mechanoreceptors, (3) an indirect effect via metabolic regulation pathways or (4) fermentations with a production of SCFA, as reviewed by Knudsen( Reference Bach Knudsen 3 ) and Li & Patience( Reference Li and Patience 4 ). The variety of animal response to the dietary inclusion of DF suggests that various hormonal, metabolic, physical and microbial pathways are involved in the regulation of feed intake. Testing DF fractions is needed to better distinguish the overall effect of DF on feed intake from the specific and functional properties of some DF fractions( Reference Bach Knudsen 3 ). Wheat aleurone layer, a fraction of wheat bran-containing fibres (arabinoxylans and β-glucans) and phenolic compounds, ferulic acids and lignans( Reference Rosa-Sibakov, Poutanen and Micard 5 ), is a suitable candidate as DF source that can affect glucose and insulin post-prandial peaks as demonstrated in horses( Reference Delesalle, Popovic and Hespel 6 ).
To our knowledge, few studies co-investigated the effect of DF level and the supplementation of a particular fraction of DF on ADFI, feeding behaviour, plasma metabolite and hormone kinetics. Therefore, this current study aimed to link the within-day dynamics of voluntary feed intake, plasma metabolites and insulin in growing pigs that had ad libitum access to feed and that received diets differing in DF level and wheat aleurone inclusion. We hypothesised that DF level in the diet and dietary aleurone supplementation modifies feeding behaviour in relation to changes in metabolites and insulin kinetics after a meal, considering that feeding behaviour is closely linked with metabolite and insulin variations( Reference Le Naou, Le Floc’h and Louveau 7 ).
The implication of this study is the modulation of feeding behaviour in pigs. Limiting voluntary feed intake by dietary composition rather than quantitative feed restriction may benefit animal welfare and facilitate increased feed efficiency( Reference Vanschoubroek, De Wilde and Lampo 8 ). Due to similitudes in digestion and metabolism between pigs and humans, results obtained in this study also furnished hypotheses regarding human food intake regulation.
Methods
The experiment was performed at the INRA experimental facilities in Saint-Gilles (France) (agreement number C35-275-32) in compliance with the French directive on animal experimentation and care (2013-118), after evaluation by a competent ethical committee in animal experimentation under the responsibility of the French ministry of research (authorisation number 2016072907418869).
Animals, housing and experimental design
The experiment was conducted with forty castrated males ((Pietrain×(Large White×Landrace)) with an average initial BW of 25·6 (sd 3·0) kg (70 days of age). To avoid pain and perturbations during time-series blood sampling, a catheter was inserted in the external jugular vein through a collateral vein according to a protocol previously described by Melchior et al. ( Reference Melchior, Sève and Floc’h 9 ) under general anaesthesia (ketamine and isoflurane). After the surgery, pigs had 2 weeks of recovery and adaptation to experimental diets and to individual housing. Then pigs were weighed and individually housed in a metabolic cage (60×120 cm) with metal floor placed in an enclosure (1·7 m3) and equipped with a weighing scale to continuously record feed consumption for 7 d. The study was conducted for thirteen batches, with each batch consisting of three or four littermates. For each batch, the three or four littermates with a similar BW were selected and successively housed for 1 week in the enclosure as only one was available. The temperature in the enclosure was maintained constant at 24°C and a 12-h lighting time span (07.30–19.30 hours) was used. Each pig had free access to water and one of the six experimental diets. During all the experiments, animals were carefully observed to detect potential injuries of welfare and disease.
Experimental diets
Two concentrations of DF (low fibre: LF (NDF=10 %) and high fibre: HF (NDF=15 %)) and three levels of aleurone supplementation (GrainWise Wheat Aleurone; Horizon Milling; 0 g/kg: A0, 2 g/kg: A2 and 4 g/kg: A4) were tested in six experimental diets (Table 1). The HF diet contained a mixture composed of 50 % of wheat bran, 33 % of soya hulls and 17 % of sugar beet pulp. This mixture of three DF-rich feedstuffs having different physicochemical properties permitted to study an overall effect of DF level rather than the effect of DF from a specific source( Reference Bach Knudsen 3 ). Experimental diets were balanced on the ratio of digestible lysine to net energy (NE). Energy content was lower in the HF diets due to the introduction of DF (–6 % of NE/kg of DM for HF diet( Reference Noblet, Fortune and Shi 10 )).
Table 1 Ingredients and chemical composition of the experimental diets
A0, no aleurone; A2, supplementation of 2 g/kg of aleurone; A4, supplementation of 4 g/kg of aleurone; NE, net energy.
* GrainWise Wheat Aleurone, Horizon Mills, Cargill with 19·3 MJ gross energy/kg DM, 18·5 % DM of crude protein, 11·1 % DM of crude fibre and 52·6 % DM of neutral-detergent fibre.
† The premix supplied (per kg diet) for LF diet: l-lysine HCl, 3 g; l-threonine, 1 g, l-tryptophan, 0·1 g; dl-methionine, 0·4 g; salt, 4·5 g; calcium carbonate, 5·9 g; dicalcium phosphate, 10·1 g; vitamin A, 1·5 mg retinol activity equivalents; vitamin D3, 25 μg cholecalciferol; vitamin E, 20 mg; vitamin B1, 2 mg; vitamin B2, 4 mg; pantothenic acid, 2000 mg; vitamin B6, 1 mg; vitamin B12, 0·022 mg; niacinamide, 15 mg; vitamin K3, 2 mg; folic acid, 1 mg; biotin, 0·2 mg; choline chloride, 50 mg; Mg, 0·1 g; Ca, 1·33 g; Fe, 80 g; Cu, 10 mg; Zn, 100 mg; Mn, 40 mg; iodine, 0·2 mg; Se, 0·15 mg and for HF diet and l-lysine HCl, 2·8 g; l-threonine, 0·9 g, l-tryptophan, 0·1 g; dl-methionine, 0·4 g; salt, 4·5 g; calcium carbonate, 4·7 g; dicalcium phosphate, 9·9 g; vitamin A, 1·5 mg retinol activity equivalents; vitamin D3, 25 μg cholecalciferol; vitamin E, 20 mg; vitamin B1, 2 mg; vitamin B2, 4 mg; pantothenic acid, 2000 mg; vitamin B6, 1 mg; vitamin B12, 0·022 mg; niacinamide, 15 mg; vitamin K3, 2 mg; folic acid, 1 mg; biotin, 0·2 mg; choline chloride, 50 mg; Mg, 0·1 g; Ca, 1·33 g; Fe, 80 g; Cu, 10 mg; Zn, 100 mg; Mn, 40 mg; iodine, 0·2 mg; Se, 0·15 mg.
‡ The NE was calculated with the equation NE=0·703×DE+1·58×CF+0·47×ST–0·97×CP–0·98×CF( Reference Melchior, Sève and Floc’h 9 ), with DE for digestible energy, EE for diethyl ether extract, ST for starch, CP for crude protein and CF for crude fibre.( Reference Melchior, Sève and Floc’h 9 )
Pigs received 500 g of a commercial growing feed (NDF=14 %) on the 1st day after the surgery and then 1000 g/d for 4 d with a transition from the commercial diet they fed before surgery to one of the six experimental diets (80/20, 60/40 and 40/60, 20/80 %). One level of DF with its three levels of aleurone supplementation was tested within each batch. Pigs had free access to experimental diets between 09.00 and 16.30 hours and between 17.00 and 06.00 hours that permitted mimicking an ad libitum feed intake at the scale of the day. Each day, feed allowance was determined to be greater than voluntary daily feed intake. To avoid spillage, feed was provided twice a day at 08.45 hours and again at 16.45 hours, before trough emptying. The daily feed allowance was weighed and a sample of offered feed was cumulated each day of measurements for each pig for immediate DM measurement. For each experimental diet, samples were pooled over the whole experiment for chemical analyses. Feed refusals and spillages were collected at the end of each week of measurements and were oven-dried to determine the refused DM.
Feeding behaviour recording
After 1 d of adaptation to the enclosure, feeding and drinking behaviour were analysed for the following 6 d. For feed intake calculations, a day of measurement began at 09.00 hours and finished at 06.00 hours. For water intake calculations, a day of measurement began at 09.00 hours and finished at 08.00 hours to take into account water meals when the feed trough was locked. The feed trough and the water container were on a weighing scale for recording feeding and drinking behaviour. The water container was filled each morning with tap water. The weight of the feed trough and the water pit was recorded every 10 s. A consumption of feed was defined as a negative variation in the weight of the feed trough. The feed intake size was calculated as the difference between the stabilised weight of the trough before and after the variation. The feed intake duration was defined as the duration between the beginning and the end of the weight variation. To compare our results with other studies, successive feed bouts were grouped into the same meal using a meal criterion defined as the maximum length between two feed bouts owing to the same meal( Reference Tolkamp, Allcroft and Barrio 11 ). Feed bouts separated by intervals shorter than the meal criterion were considered to be part of the same meal and were clustered accordingly. A meal size was the sum of the size of the feed bouts and the meal duration was the duration between the beginning of the first feed bout and the end of the last feed bout of the meal. In our study, the meal criterion was estimated using the log curves technique ( Reference Labroue, Guéblez and Sellier 12 ) and was established at 4 min. The DM feed intake per meal was calculated as the feed intake per meal adjusted for the percentage of DM of the feed measured weekly for each pig. Meals with a size below 10 g were not kept for statistical analysis but spread over other meals of the day. The ADFI, expressed in g of DM per d, was calculated for each pig as the average of dried feed intake from the 6 d considered in the analysis. From the generated database, daily number of meals, average feed intake per meal (g of DM), average duration per meal (min), daily feed intake (g of DM per d) and total ingestion duration per d (min) were calculated as indicators of feeding behaviour. Daily total water intake was calculated as the difference in the water container weight for 23 h periods.
Blood collection
On day 7, blood was sampled to analyse metabolites and insulin plasma concentrations. The catheter was externalised outside of the enclosure and permitted to collect blood samples without disturbing the animal. The first meal of day 7 was considered as a test meal. Blood (10 ml) was sampled at 08.30 and 08.45 hours (referred as pre-prandial), at the beginning of the meal and at 15, 30, 45, 60 min after the beginning of the meal. Blood samples (10 ml per sample; 5 ml collected on EDTA and 5 ml collected on heparin) were stored on ice before centrifugation for 10 min at 3000 g (4°C). Plasma was separated into aliquots and stored at –20°C until metabolites and hormone concentration analyses. For each blood sampling, the haematocrit (H) was measured and a basal haematocrit (BH) was calculated as the mean of pre-prandial haematocrits of a particular pig. Plasma metabolite and insulin concentrations were adjusted as follows to take into account the possible dilution because of water intake and saline solution perfusion to flush the catheter line between successive samplings:
 $$ \eqalignno{{\rm Adjusted \,\,concentration} {\equals} {\rm real \,\, concentration} {\times}{{(100{\minus}{\rm BH})} \over {(100{\minus}{\rm H})}}.$$
Chemical analyses
The experimental diets were analysed for DM, ash, gross energy, N, diethyl ether extract, crude fibre, different fibre fractions (NDF, acid-detergent fibre, acid-detergent lignin) and starch according to the standard procedures( 13 ). Commercial kits were used to determine plasma concentrations of glucose (Glucose RTU; bioMérieux), lactate (Lactate PAP; bioMérieux), NEFA (NEFA-HR(2); Wako Chemicals GmbH), urea (Urea UV 250; bioMérieux), α-amino nitrogen (Protéines-kit; bioMérieux) and TAG (Triglycérides Enzymatique PAP 150; bioMérieux). These parameters were measured with a Konelab 20i device (Thermo Fisher Scientific) according to manufacturers’ recommendations. Plasma concentrations of insulin were measured using an RIA kit (INSULIN-CT; CisBio Bioassays). Intra-assay CV was <5 %.
Data analyses
The NE concentration of the diets was calculated with the equation NE=0·703×DE+1·58×EE+0·47×ST–0·97×CP–0·98×CF, with DE for digestible energy, EE for diethyl ether extract, ST for starch, CP for crude protein and CF for crude fibre( Reference Noblet, Fortune and Shi 10 ).
Based on the feeding behaviour, between four and eight animals per treatment are necessary to achieve the statistical power of 90 % with an α level at 5 % to see a difference of 100 g on ADFI and a difference of two meals per d.
Pigs were individually housed in an enclosure. A batch was constituted by three or four littermates that were successively measured for 1 week each. One level of DF and three levels of aleurone supplementation were tested for one batch and the other level of DF (with its three levels of aleurone supplementation) was tested for the following batch. For the last replicate, four littermates were used, fed with LF-A0, LF-A2, LF-A4 and HF-A0 to adjust the number of pigs per treatment.
The analysis thereafter was conducted using a linear mixed model with the MIXED procedure of SAS (SAS Institute Inc.) and the assessment of significance of the factors tested in each model was based on ‘type 3 tests of fixed effects’ as experimental design is not strictly balanced. For variables considered as repeated effect, the REPEATED statement was used in the procedure. An unstructured covariance matrix (type=UN) was used for these models, because it was the covariance structure that displayed the lowest Akaike’s information criterion and Bayesian information criterion in comparison with other covariance structure that were tested (compound symmetry, Toeplitz or autoregressive). Data were tested for normality according to Shapiro–Wilk’s test of residuals.
Variables describing the feeding behaviour (ADFI, NE intake, number of meals, meal size, meal duration and average interval between two meals) were analysed in a linear mixed model with levels of DF and aleurone and their interaction considered as main factors, batch as a random factor and day of the week as a repeated effect with the pig as the experimental unit.
Water intake per d was analysed in a linear mixed model, with levels of DF and aleurone and their interaction considered as main factors, feed intake level and number of meals per d as covariates, batch as a random factor and day of the week as a repeated effect with the pig as the experimental unit.
Only data from pigs (n 26) that were fed two voluntary meals between 09.00 and 17.00 hours on the day of blood kinetic were considered for the statistical analysis of plasma metabolites and insulin concentrations.
Pre-prandial plasma concentrations of metabolites (glucose, lactate, NEFA, TAG, urea and α-amino nitrogen) and insulin were analysed in a linear mixed model with levels of DF and aleurone and their interaction considered as main factors, the interval since the last meal and the size of this last meal as covariates, batch as a random factor and time as a repeated effect with the pig as the experimental unit.
Plasma metabolites and hormone concentrations were analysed in a linear mixed model with levels of DF and aleurone and their interaction considered as main factors, the size of this test meal (expressed as g/kg BW0·60) and pre-prandial concentration of analysed metabolites as covariates, batch as a random factor and time as a repeated effect with the pig as the experimental unit. When the effect of interaction between time and DF level or aleurone supplementation were significant, post hoc tests were performed through Tukey’s pairwise comparison of the means for each time. Least square (LS) means were calculated to obtain adjusted means from the statistical model. When data are unbalanced, LS means give better mean estimates than simple means (LSMEANS statement in SAS).
Data were further analysed by multiple factorial analysis and hierarchical classification of principal components to discriminate clusters of pigs using the R statistical package ‘FactoMineR’( Reference Lê, Josse and Husson 14 ). As blood metabolites and insulin concentrations are affected by feeding behaviour ( Reference Le Naou, Le Floc’h and Louveau 7 , Reference Reynolds, Elias and Whisnant 15 ), size of the test meal and pre-prandial metabolites and insulin concentrations, pigs were discriminated based on these different factors of variation to analyse their effects on plasma metabolites and insulin kinetics. The following three classes of variables were included in the analysis: pre-meal plasma concentrations of metabolites (glucose, lactate, NEFA, α-amino nitrogen, urea and TAG) and insulin; variables characterising feeding behaviour (number of meals, average meal size (g/kg BW0·60), average duration of meal (min), total duration of feed intake per d (min) and ADFI (g/kg BW0·60)) and the size of the test meal (g/kg BW0·60). After cluster identification, data were further tested by a linear mixed model as previously described, replacing the DF, aleurone supplementation effects and their interaction by a cluster effect.
Data for pre-meal insulin concentration and concentrations of glucose, insulin, urea, NEFA and TAG in the hour after the test meal were log transformed before statistical analyses.
Differences between treatments were considered significant for P<0·05, whereas 0·05<P<0·10 was discussed as a trend. Data are shown as LS means in tables and means in graphics, with the residual square deviation as an indication of the variability.
Results
A total of two pigs fed the LF-A0 and HF-A4 diets exhibited fever associated with a low ADFI on the week of measurements. They were excluded from the experiment and subjected to antibiotic treatments (150 mg amoxicillin/10 kg for BW). Consequently, thirty-eight pigs were considered in the final analysis. Only the data from twenty-six pigs that were fed two voluntary meals between 09.00 and 17.00 hours on the day of blood kinetic were considered in the statistical analysis of plasma metabolites and insulin concentrations.
Influence of diets on feeding behaviour
There was no interaction between DF level and aleurone supplementation on any variables characterising feed intake and feeding behaviour. Pigs had less (P<0·01) but larger (19 %, P<0·01) meals with high level of DF, without effect on ADFI and NE intake (Table 2). Whereas average meal duration (10 %, P<0·01) and interval between two meals increased (14 %, P<0·01) with DF level, the total daily feed intake duration was similar. The decrease in ADFI (–20 %, when compared with other diets; P<0·01) for aleurone-supplemented diet (4 g/kg) was associated with a decreased number of meals per d (P<0·01). Pigs spent less time per d to eat, hence the interval between two meals was extended (P<0·01), with diets supplemented with 4 g/kg of aleurone. Neither DF level nor aleurone supplementation modified the total water intake, considering feed intake and number of meals as covariates.
Table 2 Effect of dietary fibre and aleurone supplementation on feeding and drinking behaviour in growing pigsFootnote * (Mean values and residual standard deviations (RSD))
LF, low fibre; HF, high fibre; A0, no aleurone; A2, supplementation of 2 g/kg of aleurone; A4, supplementation of 4 g/kg of aleurone; NE, net energy; BW, body weight.
a,b Mean values within a row with unlike superscript letters were significantly different (P<0·05).
* The experiment was conducted with five growing pigs fed LF-A0, seven growing pigs fed LF-A2, six growing pigs fed LF-A4, eight growing pigs fed HF-A0, seven growing pigs fed HF-A2 and five growing pigs fed HF-A4.
† ANOVA was performed using Proc Mixed (SAS) including effects of dietary fibre, aleurone, interaction between dietary fibre and aleurone (non-significant) and day (non-significant). Data are presented in the table as least squares means (lsmeans statement in SAS).
‡ Logarithmic transformation was previously performed to validate the normality test according to Shapiro–Wilk’s test of residuals. Values are presented in the table as means of the estimated data from the MIXED model after exponential transformation of the predicted values. RSD of these variables is calculated as the standard error of the difference between experimental data and estimated data.
Influence of diets on plasma metabolites and insulin concentrations
There was no interaction between DF level and aleurone supplementation on pre-prandial plasma concentrations of metabolites and insulin. High level of DF decreased pre-prandial insulin concentration (P=0·01) and tended to decrease pre-prandial glucose concentration (P=0·06) when compared with the diets with low level of DF (Table 3). The pre-prandial insulin concentration was the greatest with the aleurone-supplemented diet at 2 g/kg compared with other aleurone supplementations (P<0·01). The pre-prandial α-amino-nitrogen concentration was lower with the aleurone-supplemented diet at 4 g/kg (P=0·04). Pre-prandial lactate, urea, NEFA and TAG concentrations were not affected by the dietary factors. An increase in the interval between the test meal and the last meal decreased the pre-prandial concentration of insulin (P<0·01) and increased the pre-prandial NEFA concentration (P=0·05), whereas an increase in the size of the last meal increased the pre-prandial concentration of insulin (P<0·01) and decreased the pre-prandial NEFA concentration (P=0·04).
Table 3 Effect of dietary fibre and aleurone supplementation on pre-prandial concentrations of plasma metabolites and insulin in growing pigsFootnote * (Mean values and residual standard deviations (RSD))
LF, low fibre; HF, high fibre; A0, no aleurone; A2, supplementation of 2 g/kg of aleurone; A4, supplementation of 4 g/kg of aleurone; I, interval since the last meal; LMS, size of the last meal.
a,b Mean values within a row with unlike superscript letters were significantly different (P<0·05).
* The experiment was conducted with five growing pigs fed LF-A0, four growing pigs fed LF-A2, five growing pigs fed LF-A4, four growing pigs fed HF-A0, five growing pigs fed HF-A2 and three growing pigs fed HF-A4.
† ANOVA was performed using Proc Mixed (SAS) including effects of dietary fibre, aleurone, interaction between dietary fibre and aleurone (non-significant), I and the LMS. Data are presented in the table as least squares means (lsmeans statement in SAS).
‡ Logarithmic transformation was previously performed to validate the normality test according to Shapiro–Wilk’s test of residuals. Values are presented in the table as means of the estimated data from the MIXED model after exponential transformation. RSD of these variables is calculated as the standard error of the difference between experimental data and estimated data.
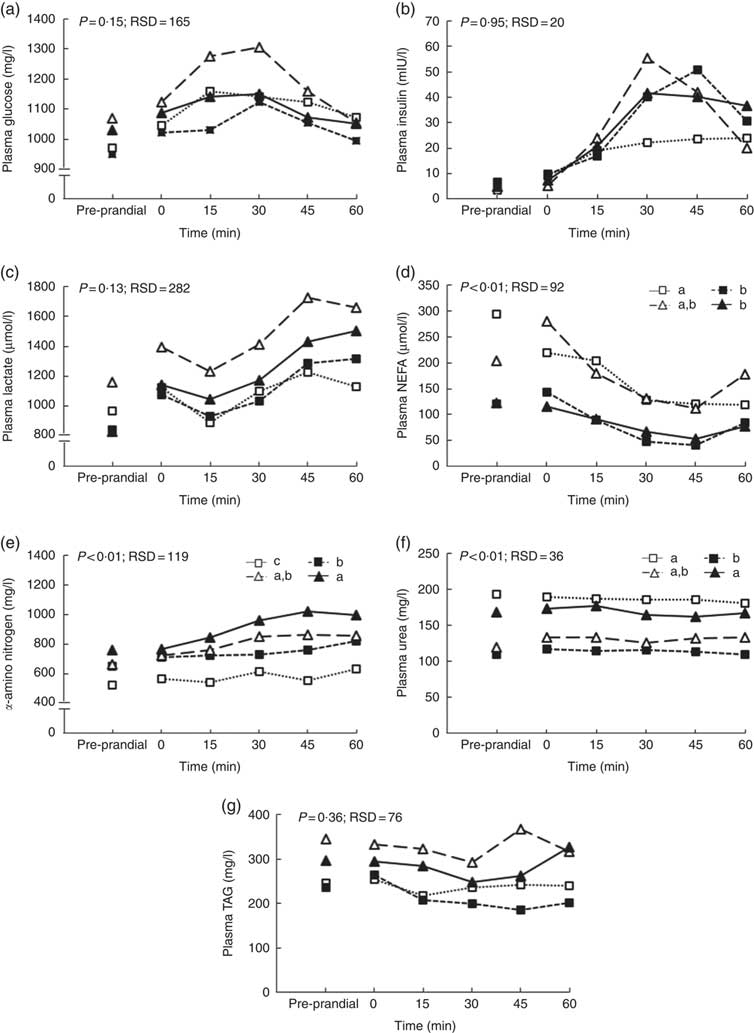
The size of the voluntary test meal was greater with high level of DF (368 v. 242 g of DM, P=0·04) and longer (19·4 v. 13·8 min, P=0·02). It was not modified with aleurone supplementation (data not shown). Except for urea concentration (P=0·18), the concentrations of all metabolites and insulin significantly changed in the first hour after the test meal (P<0·01, Fig. 1). During the first hour, there was no interaction between DF level and aleurone supplementation for α-amino-nitrogen, urea, NEFA and insulin concentrations and only a tendency for glucose and lactate concentrations (P=0·08). Moreover, the concentration of TAG was lower for the HF-A4 diet than for any other diets (P=0·02; Fig. 2). DF level did not affect any kinetics of metabolites and insulin throughout the first post-prandial hour, whereas aleurone supplementation decreased glycaemia (P<0·01; Fig. 1(b)). Insulin concentration at 15 min after the meal was lower for pigs fed high level of DF (P=0·03) and was lower for pigs fed the aleurone-supplemented diet (4 g/kg) compared with pigs fed the diet without aleurone supplementation (P=0·04).

Fig. 1 Effect of dietary fibre and aleurone supplementation on plasma glucose (a, b), insulin (c, d), lactate (e, f), NEFA (g, h), urea (i, j) and α-amino-nitrogen (k, l) concentrations in growing pigs fed diets. Results are expressed as means, n 26. The experiment was conducted with fourteen growing pigs fed low fibre (![]() ) diet, twelve growing pigs fed high fibre (
) diet, twelve growing pigs fed high fibre (![]() ) diet and with nine growing pigs fed no aleurone (
) diet and with nine growing pigs fed no aleurone (![]() ) diet, nine growing pigs fed supplementation of 2 g/kg of aleurone (
) diet, nine growing pigs fed supplementation of 2 g/kg of aleurone (![]() ) diet and eight growing pigs fed supplementation of 4 g/kg of aleurone (
) diet and eight growing pigs fed supplementation of 4 g/kg of aleurone (![]() ) diet. General linear mixed analysis was performed using the MIXED model including the fixed effect of dietary fibre level, aleurone supplementation, interaction between dietary fibre and aleurone, time, interaction between time and dietary effect, size of the test meal, pre-prandial concentration of the metabolite or insulin and the random effect of batch. P values are specified with their residual standard deviation (RSD) for the effects of dietary fibre level (a, c, e, g, i, k) and aleurone supplementation (b, d, f, h, j, l). Interaction between dietary fibre level and aleurone supplementation was never significant. Effect of the time is significant for all metabolites and insulin concentrations except urea concentration. Interactions between time and dietary fibre level or aleurone supplementation are not significant except for insulin and α-amino-nitrogen. * Significant difference at that time between levels of fibre (c) or aleurone (d), P<0·05.
) diet. General linear mixed analysis was performed using the MIXED model including the fixed effect of dietary fibre level, aleurone supplementation, interaction between dietary fibre and aleurone, time, interaction between time and dietary effect, size of the test meal, pre-prandial concentration of the metabolite or insulin and the random effect of batch. P values are specified with their residual standard deviation (RSD) for the effects of dietary fibre level (a, c, e, g, i, k) and aleurone supplementation (b, d, f, h, j, l). Interaction between dietary fibre level and aleurone supplementation was never significant. Effect of the time is significant for all metabolites and insulin concentrations except urea concentration. Interactions between time and dietary fibre level or aleurone supplementation are not significant except for insulin and α-amino-nitrogen. * Significant difference at that time between levels of fibre (c) or aleurone (d), P<0·05.
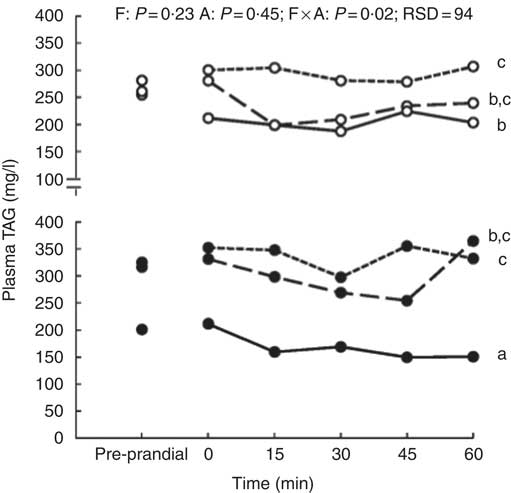
Fig. 2 Effect of dietary fibre (F) and aleurone (A) supplementation on plasma TAG concentration in growing pigs fed experimental diets. Results are expressed as means (n 26). The experiment was conducted with fourteen growing pigs fed low fibre (LF) diet, twelve growing pigs fed high fibre (HF) diet and with nine growing pigs fed no aleurone (A0) diet, nine growing pigs fed supplementation of 2 g/kg of aleurone (A2) diet and eight growing pigs fed supplementation of 4 g/kg of aleurone (A4) diet. ANOVA was performed according to a general linear mixed model using the MIXED procedure of SAS including the fixed effect of dietary F level, A supplementation, interaction between dietary F and A, time, interaction between time and dietary effect, size of the test meal, pre-prandial concentration of the metabolite or insulin and the random effect of batch. P values are specified with their residual standard deviation (RSD) for the following effects: F, A, F×A: interaction between dietary F and A. Effect of the time is significant (P<0·01) but interactions between time and dietary F level or A supplementation are not significant. a,b,c Significant dietary effect on mean TAG concentration in the hour after the test meal (P<0·05). ![]() , LF-A0;
, LF-A0; ![]() , LF-A2;
, LF-A2; ![]() , LF-A4;
, LF-A4; ![]() , HF-A0;
, HF-A0; ![]() , HF-A2;
, HF-A2; ![]() , HF-A4.
, HF-A4.
Characterisation of clusters
Two principal components accounting for 49 % of total variance among pigs were retained from the multiple factorial analyses, that is, 30 % of the first component and 19 % of the second component. Contributions of each variable to these two major components are presented in Table 4. Based on the multiple factorial analyses, the hierarchical classification discriminated pigs according to four clusters. Dietary treatment only partially agreed with cluster classification (Table 5). Clusters 1 and 2 grouped the lightest pigs (34·9 and 37·5 kg, respectively) having low ADFI (1209 and 1174 g/d, respectively) and few number of meals per d. Clusters 3 and 4 grouped the heaviest pigs (44·9 and 43·0 kg, respectively) having high ADFI (1580 and 1838 g/d, respectively) and a large number of meals per d. In addition, pigs grouped in cluster 4 ate a more important voluntary test meal than those grouped in other clusters (P<0·01). Pre-prandial plasma concentration of NEFA was greater for pigs in clusters 1 and 3 than for pigs in clusters 2 and 4 (P<0·01). Pre-prandial α-amino-nitrogen concentration varied from 516 mg/l for pigs from cluster 1 to 762 mg/l for pigs from cluster 4 (P<0·01). Mean urea concentration varied from 112 mg/l for cluster 2 to 195 mg/l for cluster 1 (P<0·01).
Table 4 ContributionsFootnote * of each variable to components 1 and 2 in the multiple factorial analysis performed on pre-prandial plasma metabolite and insulin concentrations and feeding behaviour in growing pigs
* The contribution of each variable is expressed as percentage of the variance (inertia) explained by each component.
Table 5 Characterisation of groups after clustering according feeding behaviour, voluntary test meal and pre-prandial plasma metabolites and insulin concentrations in growing pigs (Mean values and residual standard deviations (RSD))
BW, body weight; LF, low fibre; A0, no aleurone; A2, supplementation of 2 g/kg of aleurone; A4, supplementation of 4 g/kg of aleurone; HF, high fibre.
a,b,c Mean values within a row with unlike superscript letters were significantly different (P<0·05).
* ANOVA was performed using Proc Mixed (SAS) including effects of cluster and BW. Data are presented in the table as least squares means (lsmeans statement in SAS).
† Logarithmic transformation was previously performed to validate the normality test according to Shapiro–Wilk’s test of residuals. Values are presented in the table as means of the estimated data from the MIXED model after exponential transformation. RSD of these variables is calculated as the standard error of the difference between experimental data and estimated data.
During the first hour after the meal, glucose, lactate, TAG and insulin kinetics did not differ between clusters whereas NEFA, α-amino nitrogen and urea concentrations were affected (Fig. 3). NEFA concentration was greater for pigs grouped in clusters 1 and 3 compared with pigs grouped in clusters 2 and 4 (P<0·01; Fig. 3(d)). Concentration of α-amino nitrogen increased between pigs in cluster 1 and pigs in cluster 4 (P<0·01; Fig. 3(e)). Urea concentration was higher for pigs grouped in clusters 1 and 4 compared with pigs grouped in clusters 2 and 3 (P<0·01; Fig. 3(f)).
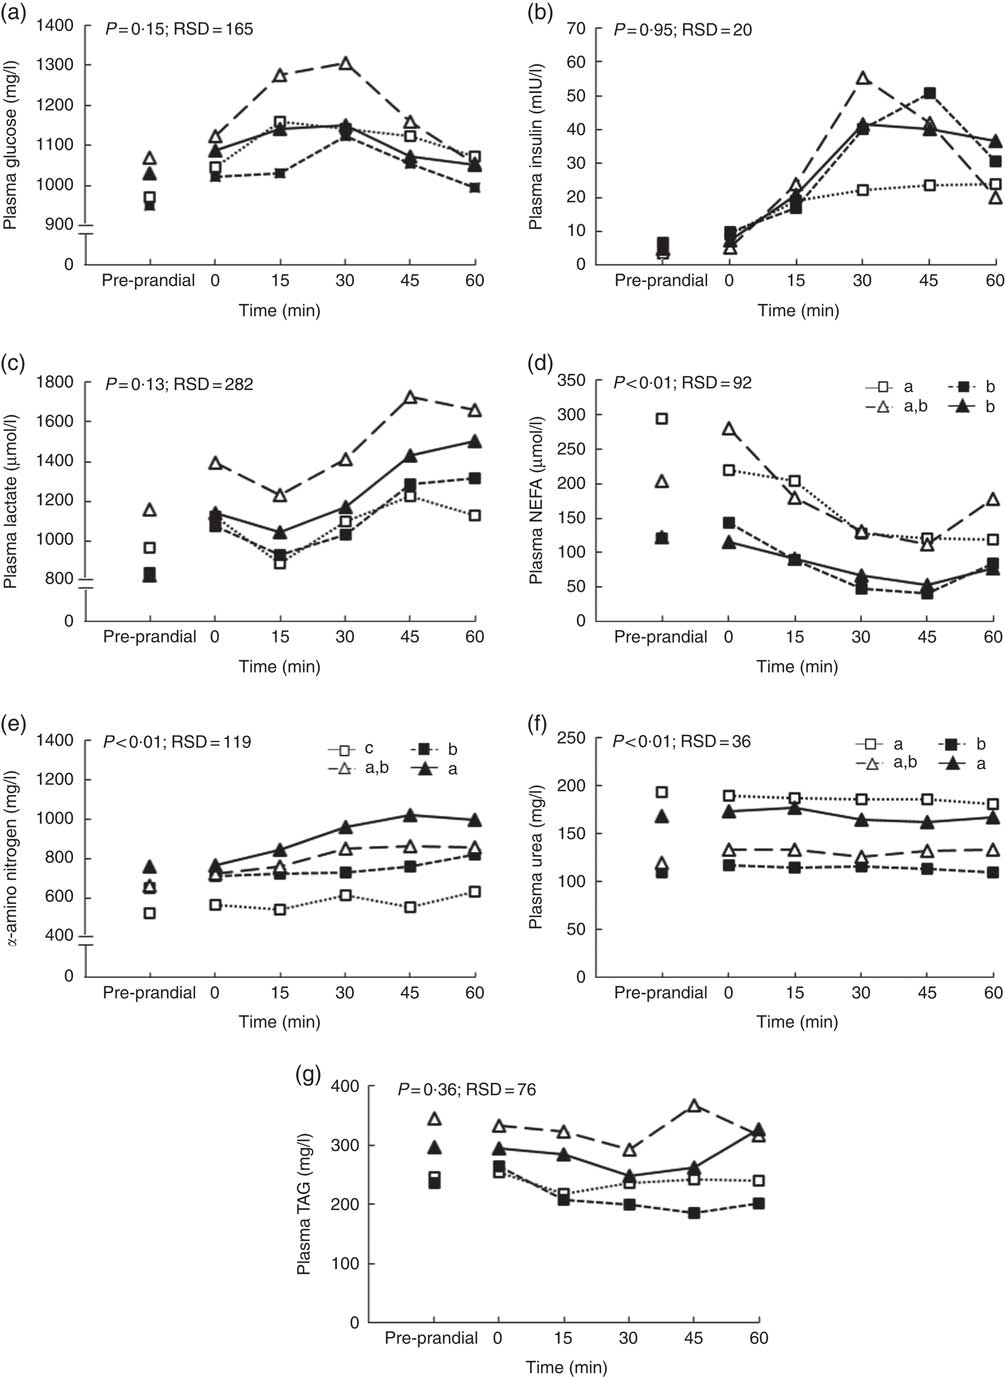
Fig. 3 Effect of clustering according pre-prandial concentrations of plasma metabolites and insulin, feeding behaviour and size of the voluntary test meal on glucose (a), insulin (b), lactate (c), α-amino nitrogen (d), urea (e), NEFA (f) and TAG (g) concentrations in growing pigs. Results are expressed as means (n 26). The experiment was conducted with five growing pigs grouped in cluster 1, seven growing grouped in cluster 2, four growing grouped in cluster 3 and ten growing pigs grouped in cluster 4. General linear mixed analysis was performed using the MIXED model including the fixed effects of cluster, time, their interaction and body weight and the random effect of batch. P values are specified with their residual standard deviation (RSD) for the effects clustering. a,b,c Significant effect of clustering on average metabolites concentrations for 1 h after the test meal (P<0·05). Effect of the time is significant for all metabolites and insulin concentrations except urea concentration. Interactions between time and clustering are not significant except for TAG. ![]() , Cluster 1;
, Cluster 1; ![]() , cluster 2;
, cluster 2; ![]() , cluster 3;
, cluster 3; ![]() , cluster 4.
, cluster 4.
Discussion
DF level or aleurone supplementation modified the feeding behaviour and blood and insulin kinetics in pigs having free access to feed for 20·5 h/d. No interaction between DF level and aleurone supplementation was found. DF level did not affect ADFI but increased meal size (28 g) and meal duration (1 min) while reducing the number of meals per d (–1 meal). Aleurone supplementation (4 g/kg) decreased ADFI (–314 g) and the daily number of meals (–1·5 meals/d). These results suggest differences in the importance of each regulation pathways (digestive, metabolic, hormonal and microbial regulations) of voluntary feed intake between the two dietary strategies that were tested to affect the feeding behaviour.
In pigs fed diets enriched with DF diluting energy concentration (–25 % of digestible energy), regulations of voluntary feed intake often led to increased ADFI (850 g of DM) to satisfy the energy requirements( Reference Cole, Duckworth and Holmes 16 ). In our study, DF enrichment, diluting the NE concentration by only 6 % when compared with the control diet, did not reduce ADFI. Similarly, an NE dilution of 5 % did not modify feed intake in growing pigs of BW between 35 and 50 kg( Reference Quiniou and Noblet 17 ). Nevertheless, the HF diet modified feeding behaviour, with pigs eating fewer meals per d of greater size than pigs fed the LF diet. The reduction in the meal frequency with the HF diet was in accordance with previous studies showing that introduction of DF can increase satiety and delay the initiation of the next meal( Reference Souza da Silva, Bosch and Bolhuis 18 ). This delay could be due to the production of SCFA by microbial bacteria, using DF as substrates for fermentation( Reference Wenk 19 ). Meal size is partly regulated by activation of mechanoreceptors and the distension of the stomach, leading to an early volumetric satiety( Reference Maljaars, Peters and Masclee 20 ). With the HF diet and its bulking properties, meals were expected to end sooner, resulting in smaller meal size due to an earlier stimulation of mechanoreceptors after meal onset. In our study, greater meals suggest that this regulation pathway was not enhanced with the HF diet compared with the LF diet and a possible adaptation of the stomach to counteract the physical volumetric effect of DF( Reference Jørgensen, Zhao and Eggum 21 ). Physical effects of DF on meal size depend on the introduction rate and nature of fibrous sources, on the BW of the pig, and on the duration of the adaptation period to the DF-rich diet( Reference Whittemore, Kyriazakis and Tolkamp 2 , Reference De Leeuw, Bolhuis and Bosch 22 ). In the present study, a mixture of three DF sources (wheat bran, sugar beet pulp and soyabean hulls) with different physical properties was used to test an overall DF effect rather than the consequences of a specific property( Reference De Leeuw, Bolhuis and Bosch 22 ). In addition, the BW of pigs (37 kg) and the adaptation period (2 weeks) were probably sufficient to satisfactorily adapt the digestive tract of the pigs with an increase in the empty stomach weight (276 v. 293 g for LF and HF diets, respectively, P<0·01, data not shown). Moreover, meal size and duration are also regulated by metabolite concentrations as suggested by the glucostatic theory of feed intake regulation( Reference Mayer 23 ). In our study, this metabolic regulation could be more important than bulking effect of high DF level. With DF level, longer (1 min) and greater (28 g) meals may be explained by a longer duration to reach glucose homoeostasis. At the end of the meal (13·8 v. 19·4 min for pigs fed LF and HF diets, respectively), although glycaemia did not significantly differ between the HF and LF diets (1112 and 1050 mg/l for pigs fed LF and HF diets, respectively, as predicted from the kinetics of plasma metabolites, P=0·28), insulinaemia was lower for the HF diet than for the LF diet (15·2 and 8·2 mIU/l, for pigs fed LF and HF diets, respectively, P=0·05). In the present study, the three fibre sources used in the HF diets are known to delay gastric emptying and to reduce digestibility of starch sources( Reference Zijlstra, Jha and Woodward 24 ). Increased duration of meals may thus permit pigs to reach glucose homoeostasis. The delayed end of the meal may be due to the lower concentration of insulin with DF level, which underlines the importance of some hormones in the regulation of feed intake.
The decrease in NE intake with aleurone supplementation (4 g/kg) suggested that ADFI regulations did not result in a constant intake of NE in all cases. The decreased ADFI was explained by a decreased meal number without increase in meal size. This result suggests an extension of satiety, which partially could be explained by microbial activity( Reference Fetissov 25 ). In our study, post-prandial NEFA concentration tended to be lower with aleurone supplementation for the first 45 min after the meal. SCFA decrease NEFA concentrations with a possible inhibition of hormone-sensitive lipase( Reference Wolever, Brighenti and Royall 26 ). As suggested in previous studies in pigs( Reference Le Gall, Serena and Jørgensen 27 ) and rats( Reference Cheng, Trimble and Illman 28 ), wheat aleurone-rich flour increased SCFA production in the caecum and colon as the consequence of arabinoxylan fermentation. SCFA can be used as an energy substrate (up to 14 % of pig maintenance requirements( Reference Dierick, Vervaeke and Demeyer 29 )), and they can modify long-term energy homoeostasis( Reference Sleeth, Thompson and Ford 30 ). SCFA stimulate satiety hormones like glucagon-like peptide-1 or peptide YY, thus inhibiting the initiation of a next meal( Reference Fluitman, Wijdeveld and Nieuwdorp 31 , Reference Hamer, Jonkers and Venema 32 ). Satiety can also be linked to a period of elimination of metabolic waste resulting from hepatic oxidation and N metabolism( Reference Allen, Bradford and Oba 33 ). Regulation of metabolic waste elimination occurs probably more than 1 h after the meal. Because urea concentration did not differ between treatments, the present results did not support this hypothesis. The increase in the interval between meals also observed with high DF level might partially result from similar mechanisms due to the presence of aleurone in DF-rich diets that contain wheat and wheat bran.
The different pathways permitting the regulation of feed intake (digestive, hormonal, metabolic or microbial) coexist, but their relative importance at a specific time might depend on diet composition (DF, aleurone) and animal characteristics. In our trial, as pigs had free access to feed for 22·5 h of the day, an important variability in feeding behaviour was observed between pigs. The daily number of meals ranged from 2 to 31 and the meal size ranged from 69 to 379 g DM ingested per meal. In most of the experiments studying metabolite or hormone kinetics, animals were fasted for at least 12 h before receiving a test meal of a fixed amount( Reference Montagne, Loisel and Le Naou 34 ), whereas in commercial farms, pigs do not have similar ADFI or feeding behaviour. Consequently, it is needed to let pigs eat with constraints as limited as possible to assess the importance of each regulation mechanism behind this variability to optimise nutritional solution. On the day of blood kinetics measurements, the interval between the meal preceding the test meal and the test meal varied from 115 to 911 min. The size of this last meal varied from 21 to 385 g of DM. Pigs did not have the same metabolic status at the beginning of the kinetic measurements. Pre-prandial glycaemia ranged from 689 to 1201 mg/l and pre-prandial NEFA concentration ranged from 45 to 485 µmol/l. Moreover, as the test meal was a voluntary meal, its size was extremely variable between animals, ranging from 98 to 710 g of DM. This variability in the feeding behaviour as well as pre-prandial concentrations of metabolites and insulin induced different responses after the voluntary test meal. Apart from a direct ANOVA according to the experimental design, a discriminant analysis leading to clustering of animals was attempted to aggregate animals in groups with similar pre-prandial metabolic status. Metabolic responses of pigs grouped in cluster 3 exhibited a large increase in glycaemia and insulinaemia after the ingestion of the meal test and fitted to metabolic responses of control groups in other studies( Reference Le Naou, Le Floc’h and Louveau 7 , Reference Koopmans, van der Meulen and Dekker 35 ). These animals had almost 9 h of fasting before the beginning of the kinetic measurements, and they were fed the LF diet without aleurone supplementation, leading to usual basal conditions before feeding. Cluster 2 grouped pigs that were fed the HF diet or aleurone-supplemented diets. The low level of NEFA in the first hour after the meal might be explained with the low pre-prandial concentration of NEFA and with the production of SCFA which are known to decrease NEFA plasma concentrations( Reference Wolever, Brighenti and Royall 26 ). This underlines the importance of microbial activity causing changes in feeding behaviour due to DF level. An increase in meal frequency (cluster 4) induced changes in regulation pathways of feed intake. In this cluster, pigs fed different experimental diets suggested that animal characteristics could be more important than diet composition in some post-prandial responses. This result is in accordance with another study which showed an important variability in feeding behaviour in the same group( Reference Labroue, Guéblez and Meunier-Salaun 36 ). Despite a low level of plasma NEFA, these pigs had a heavier test meal compared with pigs of the other clusters, which might be due to the heavy BW of animal, suggesting a larger stomach and ingestion capacity. The large meal size was associated with a high concentration of α-amino nitrogen, whereas glucose and insulin responses were less modified. Although not significant, our results are in accordance with other studies that exhibited less daily fluctuations of glucose and insulin with increased meal frequency( Reference Le Naou, Le Floc’h and Louveau 7 , Reference Munsters and Saris 37 ). Other studies reported that kinetics of glucose depend not only on diet composition but also on feeding behaviour( Reference Romsos and Leveille 38 ). We supposed that frequent meals induced a continuous supply of glucose and other nutrients without important fluctuations in their plasma concentrations. Glucose metabolism may not be the first regulation pathway that modulates feed intake in these pigs. Although other clusters showed a large test meal size (>220 g) compared with average meal size over the measurement period (<200 g), pigs grouped in cluster 1 fed predominantly the LF diet, showing a test meal more representative of the averaged meal size over other days. As pigs belonging to this cluster were light (34·9 kg), their ingestion capacity may be limited. Due to the small meal size, pigs presented a low α-amino-nitrogen concentration associated with high urea concentrations in pre-prandial situation and 1 h after the meal. These results suggest that pigs mobilised protein storages to meet energy requirements.
To conclude, there was no interaction between DF level and aleurone supplementation on the feeding behaviour of growing pigs. DF level in the diet increased meal size and decreased daily meal number without affecting ADFI, whereas aleurone supplementation decreased ADFI with a reduction in the meal number per d. The dietary supplementation with wheat aleurone modulated feed intake with effect of satiety regulation pathways, when introduced at 4 g/kg in the diet. Moreover, this trial could show that the variability in feeding behaviour and metabolic responses when pigs have ad libitum access to feed might be due to different regulation pathways with different degrees of importance depending on diet composition and animal characteristics. Inter-individual variability should be considered when diet composition is used to modulate the feeding behaviour.
Acknowledgements
The authors thank G. Guillemois and J. F. Rouaud for diets manufacturing, S. Dubois, A. Chauvin, J. Georges, F. Le Gouevec, M. H. Lohat and V. Piedvache for animal care and R. Comte, Y. Jaguelin, A. Marchais, C. Perrier and G. Robin for laboratory analyses. The authors thank R. Resmond for his help when writing the statistical section.
This work was financially supported by Provimi France – Cargill (Crevin, France) with the contract number: 2016/0019 (Cifre scheme; Cifre = Conventions Industrielles de Formation par la Recherche – industrial research training agreements for PhD students). Provimi France also provided support in the form of salaries for some authors (M. L. G., K. Q. and Y. L.).
K. Q., E. L., L. M. designed the study. K. Q. with direction from E. L. and L. M. was responsible for data collection and statistical analysis. E. L. assisted with study execution. E. L. and L. M. reviewed the manuscript and M. L. G. and Y. L. participated in the reviewing of the manuscript. All authors read and approved the final manuscript. L. M. is the corresponding author.
E. L. and L. M. had no conflict of interest. M. L. G., Y. L. obtained permanent salaries and K. Q. obtained contractual salaries (3 years) from Provimi France, which is a part of the Cargill Group. The wheat aleurone tested in the study is commercialised by Horizon Mills, which is also a part of the Cargill group (Minneapolis, MN, USA). M. L. G., Y. L. participated in the funding of this work, in the discussion of the results and in the reviewing of the manuscript but did not have any additional role in the study design, data collection and analysis, and decision to publish, or preparation of the manuscript.
Preliminary results of this work have been published in Quemeneur K., Labussiere E., Le Gall M. et al. (2018) Join dynamics of voluntary feed intake, glycaemia and insulinemia in ad libitum fed pigs. Book of Abstracts of the 69 th Annual Meeting of the European Federation of Animal Science, p. 366.