INTRODUCTION
Cytomegalovirus (CMV) infections, including transfusion-transmitted primary, and possibly secondary, CMV infections (TT-CMV), can be serious in some immunocompromised subjects. The transfusion-transmissibility of CMV is related to its latency in leucocytes and the fact that it is mainly subclinical in immunocompetent subjects. Despite modern surveillance, prophylaxis and treatment, there may still be a role for ‘CMV-safe’ blood components in susceptible recipients. Currently, two strategies are used to prevent TT-CMV – pre-storage leucoreduction and donations from seronegative donors. Some studies have concluded that, in certain high-risk patients (e.g. post-stem-cell transplant), transfusions from seronegative donors pose less risk than leucoreduced components [Reference Nichols1, Reference Vamvakas2]. Others have demonstrated the equivalence of seronegative transfusions and leucoreduction [Reference Bowden3], although the leucoreduction method used in that study was the less effective bedside method. A Canadian consensus group concluded that, while both methods were equally effective, neither was perfect [Reference Laupacis4].
CMV seropositivity rates are higher in females, older people, those of lower socioeconomic status (SES) and residents of developing countries [Reference Onorato5, Reference Krech6]. A recent study also shows a relationship between ethnicity and seroprevalence that is independent of factors such as SES [Reference Dowd, Aiello and Alley7]. Worldwide, seroprevalence in adults in the general population varies from 40% to 100% [Reference Krech6] and in random blood donors from 40% to 90% [Reference Bayer and Tegtmeier8]. Seroprevalence rates in blood donors would reflect those in the general population, although rates may be lower in this self-selected group. There are no published data on seroprevalence in the New Zealand general population but a study in 1988 assessed this in New Zealand blood donors [Reference Beresford9].
In this paper we study CMV seroprevalence, by year, age, gender, location and ethnicity in recent New Zealand blood donors. Because of recent evidence that the duration of donor seropositivity may determine the CMV safety of blood components [Reference Drew10, Reference Ziemann11], we examine this in current seropositive New Zealand blood donors and consider how these factors may impact on the future availability of CMV-safe blood components.
METHODS
Subjects
The New Zealand Blood Service (NZBS) tests CMV serostatus in all O-negative donors and other randomly selected donors. Those testing seropositive are not re-tested. Included in this analysis are only those having a first test for CMV antibody in the 4 years between 1 January 2003 and 31 December 2006. Seroprevalence was analysed in relation to the year of testing, age, sex and region where blood was donated.
In an overlapping larger group of blood donors (those having a first test for CMV antibody between the 6 years from 1 January 2003 to 31 December 2008), we also studied the effect of ethnicity keeping in mind the fact that, in our setting, ethnicity information is often missing on pre-donation questionnaires. Information on the SES of blood donors is unavailable and is not considered in this analysis. Consequently, it was not possible to assess the effect of ethnicity independent of factors such as SES. We also ascertained how many donors known to be CMV seropositive on 31 October 2007 had been found to be seropositive prior to, and how many after, 1 November 2006, i.e. were ‘remote’ (seropositive >1 year) rather than ‘recent’ (seropositive <1 year) seroconverters [Reference Drew10, Reference Ziemann11].
In addition to the testing for CMV serostatus described above, all blood donors undergo pre-donation health assessment. The demographic data recorded during this process has been extracted from NZBS computer records using a dedicated donor management software programme. Informed consent is required for blood donation and the associated testing.
Tests for CMV serostatus
Prior to October 2005, total anti-CMV (IgM and IgG) was tested using either a solid-phase enzyme immunoassay (Abbott Laboratories, USA) or an indirect haemagglutination assay (Becton Dickinson, USA). Since then a microparticle enzyme immunoassay (Abbott Laboratories) detecting IgG anti-CMV alone has been used. All these methods have comparable and high relative sensitivity and specificity (>99%) with narrow 95% confidence intervals (CI) according to the manufacturers' protocols.
Statistical analysis
Statistical analysis was performed using SAS 9.1 (SAS Institute Inc., USA).
When testing for trend across years, the Cochran–Armitage test for trend was used. Logistic regression was used to predict seroprevalence from age, sex and year, and from region and year. Two-way interactions were explored by comparing the model without interactions and each model with one interaction, although tests presented for the interaction are Wald tests. No interactions are reported from models with age, sex and year as none improved the fit of the model, as assessed by Akaike's Information Criterion which takes account of the increased number of terms in the models when interactions are added. The very large numbers of donors meant that quite small differences in seroprevalence could be detected.
RESULTS
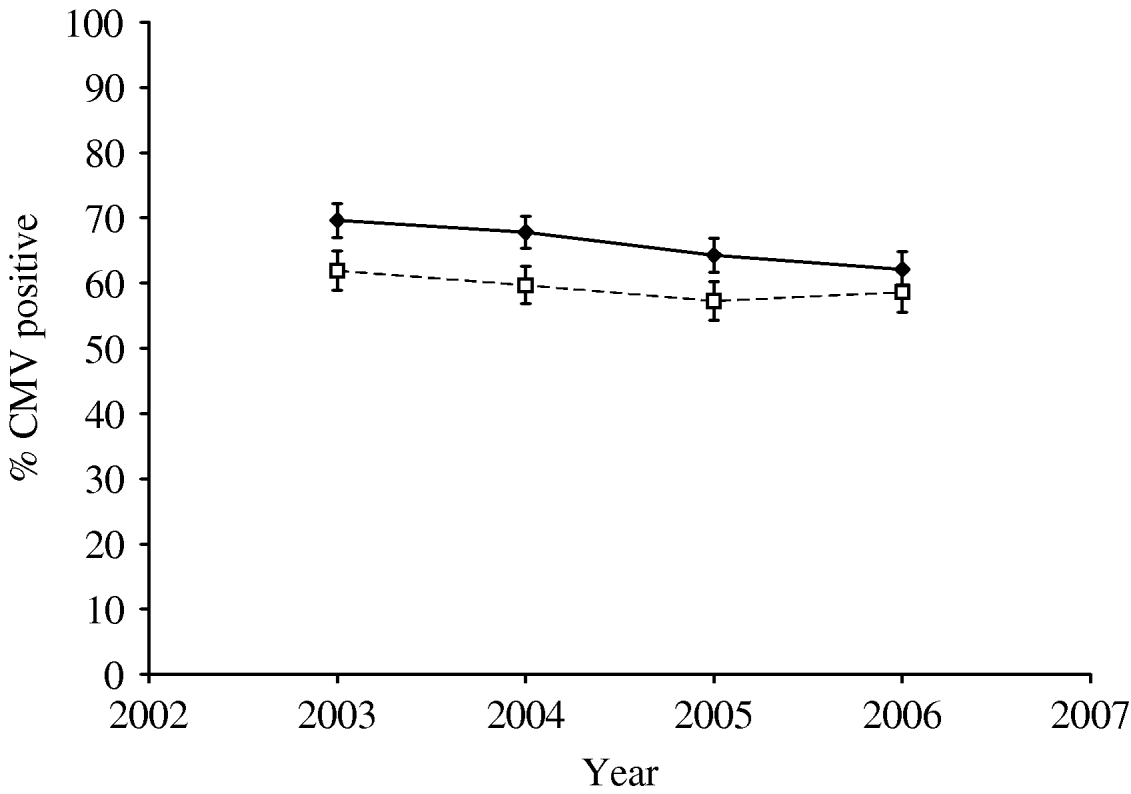
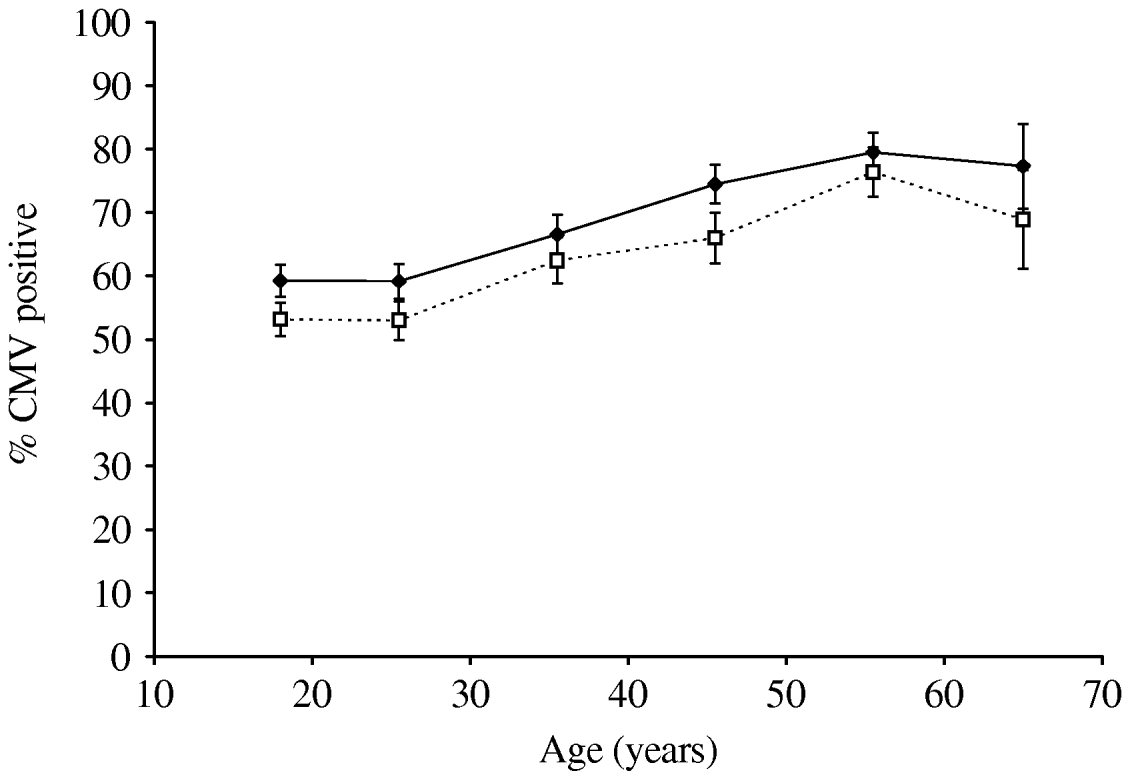
Table 1 shows the numbers of blood donors tested from 2003 to 2006 and the percentage testing positive for antibody to CMV. There was a small but steady decline in seroprevalence between 2003 and 2006 (Cochran–Armitage test for trend: z=4·37, P<0·0001). Joint analysis of sex, age group and year showed that all three were very significant predictors of seropositivity (P<0·001). The decline in seroprevalence between 2003 and 2006 was seen in both males and females though the percentage seropositive was higher in females than in males in all years (Fig. 1). Seroprevalence increased with age in both males and females and was higher in females than males in all age groups (Fig. 2).

Fig. 1. Cytomegalovirus (CMV) seropositivity (%) in New Zealand blood donors 2003–2006; percentage seropositive by year in males (- -□- -) and females (–◆–). Bars indicate 95% confidence intervals.

Fig. 2. Cytomegalovirus (CMV) seropositivity (%) in New Zealand blood donors 2003–2006; percentage seropositive by age decile in males (- -□- -) and females (–◆–). Bars indicate 95% confidence intervals.
Table 1. Cytomegalovirus seropositivity in New Zealand blood donors 2003–2006

CI, Confidence interval.
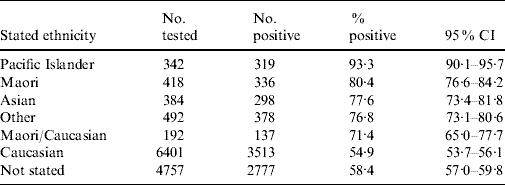
The decline in seroprevalence from 2003 to 2006 was clearest in donors from the Northern region which has the most donors. A similar but weaker and less stable trend over these years was seen in other regions. However, overall seroprevalence did not differ across regions (region: χ2=3·53, d.f.=3, P=0·27; year: χ2=23·83, d.f.=3, P<0·0001; region×year interaction: χ2=30·90, d.f.=9, P=0·0003). Ethnicity information was available in 8229/12 986 (63·3%) of those having a first test for CMV serostatus between 1 January 2003 and 31 December 2008. Seropositivity rates and 95% CIs based on stated ethnicity are shown in Table 2. Of 39 960 current CMV-seropositive blood donors no more than 1718 (4·2%, 95% CI 4·2–4·6) were found to be ‘recent seroconverters while at least 38 242 (95·7%, 95% CI 95·5–95·9) appear to be ‘remote’ seroconverters as previously defined.
Table 2. Cytomegalovirus (CMV) seropositivity based on stated ethnicity in 12 986 New Zealand blood donors having a first test for CMV serostatus between 1 January 2003 and 31 December 2008

CI, Confidence interval.
DISCUSSION
As previously mentioned, there are no published reports of CMV seroprevalence in the general New Zealand population. However, our results are similar to those from a recent national serosurvey from Australia [Reference Seale12] which found 57% seropositivity in left-over laboratory samples from individuals aged 1–59 years. Our results follow the trends in the 1988 New Zealand study [Reference Beresford9] but there are important differences between the two studies. In the current study subjects are greater in number, from all regions of New Zealand and are exclusively first-time donors. Selection of only first-time donors prevented individuals from being considered more than once in the analysis and precluded potential biases due to the inclusion of those unlikely to acquire infection because of SES, health or other reasons. However, this may have skewed results in favour of a set of younger individuals who are less likely to be CMV seropositive. In our study the majority of those tested were O negative but we know of no relationship between blood group and propensity or response to CMV infection. In the 1988 study tests detecting both IgG and IgM anti-CMV were used. In the current study, prior to October 2005, similar tests were used but after that tests detected IgG anti-CMV alone. The observed seroprevalence when both IgG and IgM are detected can be higher than when using tests detecting IgG alone [Reference Pamphilon13].
We found a steady decline in seroprevalence between 2003 and 2006 (Table 1, Fig. 1). Similar declines have been observed at other times in other settings [Reference Pamphilon13, Reference Lee14] probably related to improved socioeconomic and health conditions. Nevertheless, we found significantly higher seroprevalence than the 47% (for Waikato and Otago combined) in the 1988 study [Reference Beresford9]. Whether this is a true difference, explainable by changes in lifestyle, population mix and general health over the years or an artefact of sampling or testing is uncertain.
Moreover, as also observed in the 1988 study [Reference Beresford9], the North Island showed an insignificantly higher seroprevalence than the South Island (data not shown). This may be related to differences in SES and ethnic mix between the two islands. Maori, Pacific Islanders and Asians have significantly worse SES compared to Caucasians. Migration from the Pacific Islands and Asia has been predominantly to the North Island [15, 16]. New Zealand blood donors are predominantly Caucasian but our results indicate significant differences in CMV seroprevalence between ethnic groups (Table 2). Nevertheless, it is uncertain if, in the New Zealand context, ethnicity has an independent effect on CMV seroprevalence or if the differences between ethnic groups merely reflect differences in SES and migration from high-incidence areas.
As expected, CMV seroprevalence increases with age (Fig. 2). This is consistent with the described continuous acquisition of CMV infection in uninfected individuals [Reference de Ory17, Reference Hecker18]. The apparent decline in seroprevalence in some years in subjects aged >61 years (data not shown) may be an artefact due to the relatively small numbers in that group or there may be a biological explanation – declining antibody levels with age, for instance. Further, as expected, seroprevalence in females is significantly higher than in males (Figs 1, 2).
Leucoreduction filters remove >99·9% of leucocytes in a blood donation and so greatly reduce TT-CMV but they are not 100% effective nor are they effective against non-cell-associated CMV which can also cause infection [Reference Pamphilon13]. Because of potential infectivity during the window period, seronegativity also cannot guarantee CMV safety [Reference Vamvakas2]. In New Zealand, as in many other countries, all donations are leucoreduced and this country still has useful numbers of seronegative donors (especially in the relatively young) most of whom are genuinely CMV naive.
Only a minority of CMV-infected blood donors are capable of transmitting CMV [Reference Roback19]. Recent studies show that ‘remote’ seroconverters (seropositive >1 year) are unlikely to have CMV DNAemia, may pose a low TT-CMV risk [Reference Drew10, Reference Ziemann11] and that the proportion of donors with CMV DNAemia is inversely related to the time since the last seronegative result [Reference Ziemann11]. On the contrary, seroconverting but not yet seropositive individuals may have CMV DNAemia and be potentially infective. We found that ⩾95·7% of current New Zealand CMV-seropositive blood donors are ‘remote’ seroconverters as defined above. Only 4·2% of those known to be seropositive on 31 October 2007 had so tested during the preceding 12 months. Of these there is undoubtedly a proportion that, in fact, seroconverted more than 12 months previously – thus the proportion of ‘recent’ seroconverters in New Zealand blood donors is likely to be even less than 4·2%. On this basis, it may be possible to redesignate the majority of New Zealand CMV-seropositive blood donors as ‘CMV-safe’. Similar moves would be even more useful where CMV seroprevalence is higher than in New Zealand.
Debate continues on various aspects of CMV safety including the relative value of pre-storage leucodepletion, CMV seronegative donations and viral inactivation methods, whether the benefits from these are, or are not, additive and the characteristics indicating donations capable of causing TT-CMV. A randomized comparison of leucoreduced components from remote seroconverters and those from seronegative donors may be useful. It is likely that further re-evaluation of policies around the provision of ‘CMV-safe’ components will be necessary when more information becomes available.
DECLARATION OF INTEREST
None.


