


1. Introduction
All on-land and submarine slope failures are potentially hazardous to human populations and infrastructure (e.g. Reference TappinTappin and others, 1999; Reference Wang, Zhang, Furuya, Sassa and MaruiWang and others, 2006). It is known that accelerations produced by earthquakes give rise to short-lived inertial stresses that may lead to temporary instability upon slopes. Indeed, strong ground motions caused by earthquakes can induce a number of catastrophic geological processes, including slope-collapse phenomena such as landslides, debris slides, rockslides, rockfalls (Reference KeeferKeefer, 1984, Reference Keefer2002; Reference Hewitt, Clague and OrwinHewitt and others, 2008), sediment sliding on the ocean floor (Reference Heezen and EwingHeezen and Ewing, 1952), and seismogenic mudflows and slushflows (Reference KazakovKazakov, 2007). A rare type of catastrophic slope failure triggered by earthquakes is snow avalanches (Reference Chernous, Fedorenko, Mokrov, Barashev, Hewsby and BeketovaChernous and others, 2004). Many human casualties may result from catastrophic avalanches that occur when a snowpack with an unstable inner structure is disturbed by an earthquake (Reference LaChapelleLaChapelle, 1968).
An extensive search of the literature revealed that no previous study has attempted to compile data on observed earthquake-induced (seismogenic) snow avalanches or investigate factors important to their formation. In contrast to earthquake-induced landslides, there exist few systematically documented accounts of earthquake- released snow avalanches and there exists no comprehensive database for analysis. In this context, the main objectives of the present paper are (1) to identify and compare known and possible earthquake-released snow avalanches, (2) to describe their consequences and (3) to determine whether the criteria employed to correlate landslides and earthquakes (Reference KeeferKeefer, 1984) are applicable to the inventory of earthquake-induced snow avalanches. We believe that the compilation and analysis of earthquake-induced snow avalanche case histories would provide a range of information regarding the causes of this type of event. After summarizing the triggering mechanisms and known cases, we review some examples, ranging from confirmed to speculative with respect to triggering factors, such as natural or artificial seismicity, and discuss the relevant processes, like topographic amplification of acceleration and possible strengthening of snow under vibration.
2. General Considerations
2.1. Triggering mechanisms
2.1.1. Stress changes
Figure 1 provides a simplified schematic view of the principal triggering mechanisms of seismicity-induced snow avalanches considered in this study, ranging from natural seismicity-induced avalanches to unconfirmed events identified in statistical studies. The processes shown in the figure are described or exemplified below. We use the word ‘induced’ to indicate avalanches triggered by stress changes within the snow that were produced by seismic tremors. Some caveats and uncertainties regarding this definition are discussed in section 4.2.
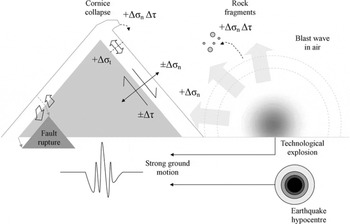
Fig. 1. Schematic sketch of seismicity-induced snow avalanches resulting from earthquakes and mine explosions, showing important triggering mechanisms. Symbols show principal changes in the elastic stress field within snow (Δσ n: normal stress; Δσ t: tensile stress; Δ τ : shear stress).
Seismicity-induced snow avalanches occur when the mechanical state of a snowpack with a condition of stress close to failure is sufficiently disturbed to cause the snowpack to collapse catastrophically (Fig. 1). Such failure depends on the state of stress in the snow. During an earthquake, it can be initiated by accelerational loading; that is, short-lived amplification of stresses and destruction of cohesional bonds between snow layers or along the bed surface (e.g. Reference Higashiura, Nakamura, Nakamura and AbeHigashiura and others, 1979). Other suggested triggering mechanisms are the direct mechanical destruction of snow by falling cornices (e.g. Reference LaChapelleLaChapelle, 1968), the rupture of the snow cover when a fault passes beneath avalanche tracks (e.g. Reference HaeusslerHaeussler and others, 2004) (Fig. 2a), or by resonance effects that result in the destruction of weak bonds between snow crystals (Reference KazakovKazakov, 1998). Shear stress amplification is a function of inertial loading, meaning that it is more pronounced at higher accelerations. It is known that the acceleration depends on the magnitude of the earthquake or explosive mass, the distance from the earthquake epicentre and the nature of underground geological structures, soil and other site effects. Longer periods of shaking are associated with increased potential for failure because under prolonged loading, microcrack nucleation can progress to produce a fracture (e.g. the Ancash earthquake, Peru, lasted for 45 s, the Denali earthquake, Alaska, for about 100 s and the Great Alaska Earthquake for about 240 s).

Fig. 2. (a) The scrap of the Denali fault (dashed white lines) is covered by fresh avalanche debris in the left-centre but is clearly visible in the right-centre (where avalanche debris is offset along the fault, indicated by arrows; the crown is shown by the hatched line), showing the different timing of release related to a foreshock and the main shock (to overcome the obscuring effects of shadows, the image is a composite of two photographs). (b) En echelon Riedel shears in snow clearly indicate the trace of the Denali fault, following an earthquake on 3 November 2002. (c) Grid of en echelon cracks in the snowpack after the Erzincan earthquake, Turkey, of 13 March 1992; a survey conducted after the melting of snow found no cracks in the ground at this site (reprinted with permission from Reference Erdik, Yüzügüllü, Yilmaz and AkkasErdik and others (1992) © Elsevier). (a) and (b) are reprinted from Reference HaeusslerHaeussler and others (2004) © Seismological Society of America.
It is important to identify other dominant factors that influence snow collapse (i.e. compressive and tensile fracturing). The key mechanisms in the formation of tensile fractures within zones of high stress concentrations (e.g. near the crown or caused by geometric imperfections) under vibration include lateral extension (Fig. 2b and c), horizontal compaction and differential vertical compaction. Earthquakes or explosions are the only phenomena, except for very local loading such as skiers and cornice collapse, that affect snow with a high loading rate at a large scale (i.e. rapid back-and-forth base shear always occurs within the brittle range of snow). In addition, earthquakes are the only process that produces a high rate of oscillations in normal pressure and tensile stress within the snow, oriented normal to the shear plane (Fig. 1). For snow, which is known as one of the most brittle and rate-dependent materials (Reference Kirchner, Michot and SuzukiKirchner and others, 2000), these effects can have severe consequences in terms of failure.
2.1.2. Snow avalanches and natural seismicity
Areas prone to snow avalanches make up 6.2% (or 9 253 000 km2) of the Earth’s surface (Reference Glazovskaya, Myagkov, Troshkina, Akif’eva, Kondakova, Kravtcova, Myagkov and KanaevGlazovskaya and others, 1992), these being defined as areas where snow-cover depth exceeds 30–50 cm and slope steepness is ≥17°, with a relative slope height of 20–30 m. Earthquakes occur mainly along pre-existing active faults, with 70% of the continental land mass on Earth composing areas of low seismic hazard, 22% areas of moderate seismic hazard, 6% of high hazard, and 2% of very high hazard (Reference Giardini, Gruenthal, Shedlock, Zhang, Lee, Kanamori, Jennings and KisslingerGiardini and others, 2003). Parts of all continents on Earth are at risk of seismic-induced snow avalanches (Fig. 3), as compiled by estimating the spatial extent of areas in which snow avalanches may be triggered by strong ground motion, based on maps showing seismic hazards (Reference GiardiniGiardini, 1999) and avalanche extent (Reference KotlyakovKotlyakov, 1997). The total area highlighted in Figure 3 corresponds to approximately 3.1 % of the total land area (4.7 × 10⁶ km2), yet despite this large at-risk area, corresponding to half of all avalanche-prone areas, only a few cases of earthquake-induced snow avalanches have been documented or witnessed during the past 110 years. These cases are discussed in the following sections.

Fig. 3. Distribution of areas at risk of earthquake-induced snow avalanche release due to natural seismicity. The lower seismicity limit corresponds to moderate seismic hazard and higher, or to peak ground acceleration (PGA) >0.8 ms−2 expected with 10% exceedance probability over a 50 year period. Total area represents about 3.1 % of the global land area (∼4.7 × 10⁶ km2). To identify those areas with a likelihood of seismic triggering, a number of Extent of Avalanche Activity maps (adapted from Reference KotlyakovKotlyakov, 1997) for different avalanche-hazard regions throughout the world were overlaid with the Global Seismic Hazard Map (Reference GiardiniGiardini and others, 1999) using ArcInfo 9.3 Geographic Information System (GIS) software (Eckert-1 projection). Some isolated volcanoes or mountain peaks in South America, Mexico, Africa, Tasmania and Papua New Guinea cannot be seen because of their small size. The Antarctic Peninsula is shown symbolically because of a lack of hazard maps for the region (other avalanche-prone regions in Antarctica are mountainous areas in northern Victoria Land and the Ellsworth Mountains; Reference KotlyakovKotlyakov, 1997).
3. Earthquake-Induced Snow Avalanches
3.1. Compilation of an inventory
To enable comparisons among various known and proposed events, we tabulated all previous cases along with the relevant available details (Table 1), and combined these data with information on relevant earthquakes. The earthquake data were obtained from various sources, mainly Engedahl and Villaseñor (2002), the composite earthquake catalog of the US Advanced National Seismic System (ANSS) and original sources. To describe the size of an earthquake, we use moment magnitude M w, which describes the amount of energy released by the event (Reference KanamoriKanamori, 1978). For a comparison of the different magnitude scales see Utsu (2002) or Reference Campbell, Lee, Kanamori, Jennings and KisslingerCampbell (2003).
Table 1. Preliminary inventory of documented, reported or witnessed earthquake-induced snow avalanches during the period 1899–2010. The results of statistical studies (i.e. cases for which there were no witnesses) are also included. At the bottom of the table, tentative conditions are provided to assist with a definition of the minimum threshold of shaking capable of triggering a snow avalanche. n/a: not available

Table 1. Continued.

An inventory of earthquake-induced snow avalanches was compiled from articles, personal communications, news reports and other sources (see Table 1). For many regions, two fundamentally different types of data were incorporated: reported or witnessed cases and cases identified based on statistical analyses (with no witnesses) (Table 1). The level of reliability of statistical data differs between seismically active regions (e.g. Himalaya; Sakhalin, Russia) and regions with low levels of natural seismicity (e.g. Khibiny mountains, Russia) (Table 1). For regions with low seismicity, there exists a low probability of a chance correlation between a seismic event and an avalanche. Thus, such regions represent a good basis for our inventory. To help in estimating the magnitude of the smallest seismic tremors that trigger snow avalanches, some additional unconfirmed examples are included in Table 1. Some details of particular cases are provided in section 4 following a basic comparison and summary of identified events.
For the period 1899–2010, we identified 22 cases of earthquake-induced snow avalanches related to natural or artificial seismicity (1.9 ≤ M ≤ 9.2) with source-to-site distances of ∼0.2–640 km; the most extreme case involved about 2000 simultaneously released large-scale snow avalanches (Table 1). These cases are summarized in Figure 4 in terms of the relationship between magnitude and maximum known source-to-site distance, with dark and light shading in the figure indicating high and low levels of reliability, respectively. For some data, the relative number of avalanches is also provided (Fig. 4).

Fig. 4. Maximum epicentral distance to snow avalanche sites as a function of magnitude M w. Closed markers indicate data from reports or eyewitness accounts. Open markers show statistical data from a number of sources (open circles are from Reference KazakovKazakov, 1998; open square is modified from Reference Chernous, Fedorenko, Mokrov and BarashevChernous and others, 2006; open diamonds are from Reference Singh, Ganju, Paul, Kumar and SharmaSingh and Ganju, 2002). Grey closed circles indicate witnessed cases without data regarding distance from the epicentre. Solid error bars indicate uncertainty in distance or magnitude. Dot-dashed lines indicate maximum possible distance from the epicentre. For many cases, absence of a dot-dashed line indicates absence of data; black dot-dashed error bars indicate maximum distance to reported landslides caused by the same earthquakes. Additional open circles around markers indicate approximate number of triggered avalanches. Dark grey shading indicates cases confirmed by eyewitness accounts; light grey shading indicates statistical data reproduced in multiple independent studies. Other details are given in the legend, Table 1 and the main text.
The small number of reports over the analysis period could be attributed to a lack of direct observations in uninhabited and remote areas affected by earthquakes. We believe that the most significant events are included in our data and that most cases would be known to local residents living in high-altitude areas and mountaineers who happened to be in the mountains during earthquake events. Consequently, the uncertainties in the statistical data and the lower and upper bounds for various parameters discussed below could be validated by additional accounts. A similarly low frequency of reports can be found for earthquake-induced ice avalanches (e.g. Reference Van der WoerdVan der Woerd and others, 2004).
3.2. Relationships between frequency–magnitude distributions for observed and statistical events
For earthquakes associated with snow avalanches during the period 1899–2010, we obtained different frequency–magnitude distributions for witnessed events and for statistically identified cases (Table 1; Fig. 5). The frequency distribution of witnessed and confirmed cases shows a peak at magnitudes of 7.0–7.9 (Fig. 5a); for statistically identified cases, the peak occurs at magnitudes of 3.0–3.9 (Fig. 5b). The obtained frequency distribution for statistical (not witnessed) cases is questionable because of the fundamental Gutenberg–Richter relationship for the distribution of earthquakes by magnitude, which could be related to a reduced frequency seen in Figure 5b from M = 3 to higher magnitudes. However, this trend is not seen at smaller magnitudes ( M ≤ 2.9), indicating that this indirectly obtained dataset does not represent chance correlations.

Fig. 5. Total number of earthquakes of various magnitudes that induced snow avalanches: (a) reported or witnessed events; (b) statistically identified cases from Reference KazakovKazakov (1998) and Reference Singh, Ganju, Paul, Kumar and SharmaSingh and Ganju (2002); and (c) combined data from reported (a) and statistically identified (b).
The cases with magnitudes less than 2.9 (obtained only in statistical studies) remain uncertain because almost all were located >100 km from the seismic source, with one exception located 25 km from the epicentre (Table 1; Fig. 5c). We should note that these data were obtained from the Himalayan sector, recorded by observatories at altitudes of 2440–5995 m in a region where the highest peaks reach 8611 m (Table 1). The nature of the topographic amplification factor at such high altitudes remains unknown, although it may be very large (see section 5.1 for details). For example, the case with the smallest source-to-site distance (25 km) reported by Reference Singh, Ganju, Paul, Kumar and SharmaSingh and Ganju (2002) had a magnitude of 1.9, recorded by an observatory at 5995 m a.s.l.
3.3. Relationship between magnitude and source-to site distance
For every earthquake listed in Table 1, the source-to-site distance is plotted against the magnitude (logarithmic scale) to enable a comparison with landslides and ice avalanches (Fig. 6). The maximum distance from the epicentre to the reported avalanche site increases with increasing magnitude and is in good agreement with the upper limit of earthquake-induced landslides proposed by Reference KeeferKeefer (1984). Although all the statistical data points lie above this upper bound in Figure 6, some landslides also lie above this limit, between two clusters of data points (first cluster: statistically obtained snow avalanches; second cluster: landslides and reported snow avalanches). The closeness in Figure 6 of these landslide events and some avalanche events suggests that snow avalanche events were correctly identified.
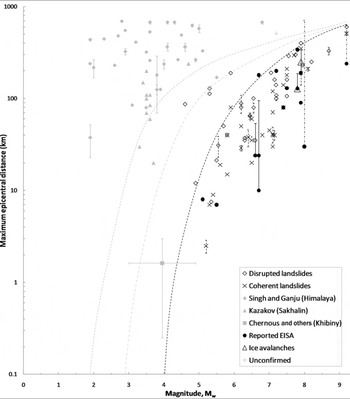
Fig. 6. Comparison of the maximum distance from the epicentre to earthquake-induced snow avalanches (EISA) and landslides for earthquakes of different magnitudes. Filled circles are data from reports; grey diamonds, triangles and the square indicate data from various statistical studies (Reference KazakovKazakov, 1998; Reference Singh, Ganju, Paul, Kumar and SharmaSingh and Ganju, 2002; Reference Chernous, Fedorenko, Mokrov and BarashevChernous and others, 2006). The ‘+’ symbol indicates an unconfirmed case (1992? – Table 1). Open diamonds represent category I landslides (disrupted slides or falls); crosses are category II landslides (coherent slides). Data points are adapted from Reference KeeferKeefer (1984, Reference Keefer2002), Reference Keefer, Manson and KeeferKeefer and Manson (1998) and Reference Rodríguez, Bommer and ChandlerRodriguez and others (1999); magnitude determinations are typically given in moment magnitude; for individual cases refer to originals. Open triangles indicate earthquake-triggered ice avalanches (Reference Plafker, Ericksen and VoightPlafker and Ericksen, 1978; Reference Van der WoerdVan der Woerd and others, 2004). Solid black error bars indicate the maximum possible distance from the epicentre. Black dot-dashed error bars indicate the maximum distance to reported landslides caused by the same earthquakes. The dashed line shows the upper bound for category I landslides, as determined by Reference KeeferKeefer (1984). The faint dot-dashed line shows the approximate upper bound for landslides that exceeded Keefer’s upper bound. The faint dashed line shows the approximate upper bound for earthquake-induced snow avalanches.
3.4. Lower limit of earthquake magnitudes that cause snow avalanches
To determine the minimum degree of ground motion associated with triggering, we identify a reported lower bound (M = 5.1) and a statistical lower bound (M = 3.0) (Table 1; Fig. 4). The fact that three independent statistical studies yield comparable lower magnitudes demonstrates that the estimation is robust. The upper bound for earthquake-induced landslides, as proposed by Reference KeeferKeefer (1984), approaches zero distance at M = 4.0; this is exceeded in only a few cases (Fig. 6). For example, Reference Rodríguez, Bommer and ChandlerRodríguez and others (1999) and Reference KeeferKeefer (2002) discussed a report by Reference Feng and GuoFeng and Guo (1985) regarding landslide collapse associated with a M = 2.9 event, and suggested this as the smallest known earthquake to have caused a landslide. This value is comparable to the minimal magnitudes associated with snow avalanches, as estimated in statistical studies (Figs 4 and 5). This limit may be lower in the case of an imminently unstable snowpack located at the epicentre, but no such accounts are known to the authors, which would provide factual information on the smallest ground tremors associated with triggering of a snow avalanche. The lower limit could be as low as M = 1.9, based on the estimate of peak ground accelerations (PGA) reported by Reference Chernous, Fedorenko, Mokrov and BarashevChernous and others (2006) in a study of mine sites (Table 1) and the established attenuation relationships for low-magnitude earthquakes (e.g. Reference Frisenda, Massa, Spallarossa, Ferretti and EvaFrisenda and others, 2005). This assumed lower limit may also be supported by known (although questionable) reports on train-triggered depth-hoar avalanches (e.g. Reference Ivanov and Vasil’evIvanov and Vasil’ev, 1975). Train-induced viaduct vibrations in areas located close to slopes (within ∼9–15 m) can produce PGA with similar magnitudes (∼0.01–0.02 g, where g is gravitational acceleration (9.8 m s−2) (e.g. Reference Ling, Chen, Zhu, Zhang, Wang and ZouLing and others, 2009)) and are known to result in structural damage to fragile historic buildings (Reference HassanHassan, 2006).
In summary, we suggest a higher upper bound for earthquake-induced landslides than that proposed by Reference KeeferKeefer (1984), and suggest that the bound for earthquake-induced snow avalanches approaches zero source-to-site distance at M = 1.9 (where PGA ≈ 0.03 g) (Fig. 6), based on Reference Chernous, Fedorenko, Mokrov and BarashevChernous and others’ (2006) measurements and possible train-induced vibrations (Fig. 4; Table 1). This approximation is consistent with the results of statistical studies performed by Reference KazakovKazakov (1998) and Reference Singh, Ganju, Paul, Kumar and SharmaSingh and Ganju (2002) (Fig. 6).
3.5. Magnitude and number of earthquake-induced avalanches, and the area affected by such events
Figure 4 shows a general increase in the total number of avalanches with increasing earthquake magnitude, although the lack of quantitative information in available reports prevents a detailed analysis of this trend. The same relation holds between magnitude and the total area affected by snow avalanches. To the best of our knowledge, the concentration of avalanches has only been estimated for a single case (around the epicentre of the Great Alaska Earthquake: ∼0.4 avalanches km−2 (Reference HackmanHackman, 1968)), although this previous study provided no details regarding changes in avalanche concentration with distance from the epicentre. The approximate relationship between magnitude and total number of landslides (N) is as follows (e.g. see the review by Reference KeeferKeefer, 2002):
Moreover, it is known that landslide concentration decreases away from the epicentre, thereby indicating the triggering of landslides by earthquakes (Reference Simonett, Jennings and MabbuttSimonett, 1967). A similar trend is expected for snow avalanches, although relevant data are lacking.
Based on the good agreement between reported earthquake-induced snow avalanches and Keefer’s upper limit for the maximum epicentre–landslide distance (Fig. 6), and given that the strongest event in both cases corresponds to the Great Alaska Earthquake, we expect that the upper bound regarding the maximum area affected by snow avalanches will be similar to or even higher than that for landslides (according to Reference Plafker, Kachadoorian, Eckel and MayoPlafker and others (1969), the total landslide-affected area during the Great Alaska Earthquake was 269 000 km2). Reference Keefer(Keefer 2002) proposed the following approximation of the total area affected by landslides, A (km2), for magnitudes 5.5 < M ≤ 9.2:
To test whether this relation is relevant to earthquake-induced snow avalanches, a rough estimation could be made for the M6.7 Nenana earthquake, Alaska, for which the affected area was about 1900 km2 (see Table 1 for details). This event falls exactly on Keefer’s linear regression mean and slightly below the upper bound proposed by Reference Rodríguez, Bommer and ChandlerRodríguez and others (1999) (Fig. 7). Another point could be estimated for the Khibiny mountains ( M3.0–4.9, affected area ∼28–128 km2; Table 1; Fig. 7). We stress that this approximation does not allow any firm conclusions, as it is based on unconfirmed information; additional (and more accurate) data are required to estimate the area affected by earthquake-induced snow avalanches.

Fig. 7. Comparison of the maximum area affected by snow avalanches and landslides (km2) for earthquakes of different magnitudes. Filled circle is datum from Nenana earthquake (Table 1); filled diamond is landslide-affected area from Reference Plafker, Kachadoorian, Eckel and MayoPlafker and others (1969); square indicates data from Reference Chernous, Fedorenko, Mokrov and BarashevChernous and others (2006). Black dashed curve is the upper bound for landslides, as determined by Reference Rodríguez, Bommer and ChandlerRodríguez and others (1999); open diamonds represent cases for which the area exceeds the upper bound, plotted for Richter local magnitude, M L (Reference KeeferKeefer, 2002). Faint dotted line shows the approximate upper bound of the area that includes landslides that exceeded Rodríguez’s upper bound and statistical data from Reference Chernous, Fedorenko, Mokrov and BarashevChernous and others (2006) (Table 1).
The degree of scatter in the reliable data in Figure 6 demonstrates that the snow profile structure, and topographical and site effects are other important factors in terms of the correlation with triggering factors. The main emphasis should be placed on pre-existing static snow strength and snowpack stability on the slope, which show great spatial and temporal variability in mountainous areas. In terms of the Great Alaska Earthquake, Reference LaChapelleLaChapelle (1968) noted that ‘few data are available on the character of the avalanches and the preexisting snow conditions’. Unfortunately, the same could be said for our entire inventory: data on snow structure at the starting zones of avalanches are only available for two events in Japan, which showed that snow strength was weak enough to be stressed until failure by accelerational loading (see Fig. 8b–d and Appendix for details and references). It is clear that the influence of snow fabric and local snow stability means that the occurrence of an avalanche at some distance from the epicentre does not always means that avalanches would also have occurred closer to the source. Accordingly, it is difficult to estimate a ‘threshold’ shaking intensity without knowledge of local snow stability conditions. Because any comprehensive comparison of earthquake-induced and ‘normal’ avalanches would be impossible without detailed information on the snow profile and strong ground motions in the vicinity of the site, these rare records from Japan are provided in the Appendix for future reference.

Fig. 8. Photographs showing examples of earthquake-induced snow avalanches. (a) North-Chuya mountain range, Siberia. Labelled peaks are: 1. Quiziltash peak (3486 m a.s.l.), 2. Aktru mountain (4044 m a.s.l.), 3. Kurkuryo mountain (3982 m a.s.l.). After an aftershock the snow cover on Quiziltash peak collapsed in an avalanche. This photograph, taken on 2 October 2003, is courtesy of A.A. Emanov, Altay-Sayan Branch of Geophysical Survey SB RAS. The other images show slopes in Japan on which earthquake-induced avalanches occurred: (b, c) Nino-magari, Yamagata prefecture (20 February 1978), located 180 km from the epicentre (reproduced from Reference Higashiura, Nakamura, Nakamura and AbeHigashiura and others, 1979; the crown is shown by the arrow); and (d) Nakazato village, Niigata prefecture (4 January 2001), located 8 km from the epicentre (reproduced from Reference Ogura, Izumi, Miyazaki and KobayashiOgura and others, 2001). Both avalanches collapsed over roads; in the first case, traffic flow was disrupted for 2 hours. Note a convex curvature of the slope in (c); such a geometry may be important in terms of the topographic amplification of acceleration. Snow profiles and earthquake fact sheet for both events are provided in the Appendix.
4. Case Histories of Earthquake-Induced Snow Avalanches
4.1. Natural seismicity as a trigger
The phenomenon of earthquake-induced snow avalanches has been observed or studied in natural environments such as the mountains of Peru (Huascarán: the main event was classified as a rock–ice avalanche (e.g. Reference Zemp, Haeberli and EamerZemp and Haeberli, 2007)), Alaska (Chugach Mountains (e.g. Reference FieldField, 1965; Reference LaChapelleLaChapelle, 1968)), Russia (Sakhalin island: Reference KazakovKazakov, 1998; Altay: personal communication from A.A. Emanov, 2008), Japan (Yamagata prefecture: Reference Higashiura, Nakamura, Nakamura and AbeHigashiura and others, 1979; Niigata prefecture: Reference Ogura, Izumi, Miyazaki and KobayashiOgura and others, 2001) (Fig. 8), Turkey (eastern Anatolia: Reference Erdik, Yüzügüllü, Yilmaz and AkkasErdik and others, 1992) and India (Western Himalaya: Reference Singh, Ganju, Paul, Kumar and SharmaSingh and Ganju, 2002).
The deadliest avalanche in recorded history was triggered (along with many other large snow avalanches (Reference BaileyBailey, 1982)) by the Ancash earthquake, Peru (1523 h, 31 May 1970; M = 7.8). A rock–ice avalanche with an estimated volume of 50–100 × 106 m3 originated from the Nevados Huascarán and resulted in 18 000–20 000 deaths (Reference Zemp, Haeberli and EamerZemp and Haeberli, 2007). Reference Plafker, Ericksen and VoightPlafker and Ericksen (1978) reported that ‘the beginning of the fall was accompanied by rise of a white cloud of snow that was presumably shaken off the mountain’. Among the most recent (although smaller-scale) events developed entirely in snow and without human casualties, one occurred in Alaska, USA, and another at Altay, Russia (Table 1). At the beginning of the Denali fault earthquake sequence (Nenana Mountain earthquake, Alaska, 23 October 2002; M = 6.7), many snow avalanches occurred in tandem with rockfalls (Reference Eberhart-PhillipsEberhart-Phillips and others, 2003; Fig. 2a and b). Another avalanche occurred in the Gorny Altay during an aftershock (1 October 2003; M = 6.7) of the Chuya earthquake (27 September 2003; M = 7.3; E.V. Leskova and others, http://gs.sbras.ru/branch/altaysayan/publications-archive/), when the snow cover on Quiziltash peak (3486 m a.s.l.), North-Chuya mountain range, completely collapsed as an avalanche, exposing the underlying rock surface (Fig. 8a) (personal communication from A.A. Emanov, 2008).
In recent years, avalanche- and earthquake-prone areas such as the southern part of Sakhalin island, Far East Russia, and Niigata and Iwate prefectures, northern Honshu, Japan, have been hit by powerful earthquakes (2 August 2007, 23 October 2004 and 17 July 2007, and 14 June 2008, respectively; moreover, an unprecedented vertical acceleration (3.8 g) was recorded during the Iwate–Miyagi earthquake (M = 6.9; Reference Aoi, Kanugi and FujiwaraAoi and others, 2008)). While these disasters occurred during periods of little or no snow cover, they highlight the importance of understanding the potential consequences of strong ground motion in snowbound mountainous areas during winter, when the amount of snow on mountain slopes is at its maximum. For example, the earthquake in Niigata on 23 October 2004 (1756 h; M = 6.6) triggered 267 landslides (the Northridge (California, USA) earthquake on 17 January 1994 triggered about 17 000). During winter, the consolidated mass of snow crystals may play a role analogous to that of loose sedimentary composite material, which may collapse simultaneously on a number of slopes.
4.2. Artificial seismicity as a trigger
Areas located close to large quarries and underground mines where strong artificial ground motions are regularly caused by technological explosions (Fig. 1) may experience snowslides similar to natural earthquake-induced avalanches (e.g. the Khibiny mountains, Kola Peninsula, Russia (Fig. 9a-c), and Taumi-kozan, Itoigawa city, Japan (Fig. 9d)).

Fig. 9. (a) Weekly explosion in the Rusvumchorr open-cast mine, Khibiny mountains (200 tons of explosives; 67° N, 33° E;∼1000 m a.s.l.). The mine contains extraordinarily rich deposits of apatite ore (‘stone of fertility’); the two main mining settlements in this district are Kirovsk and Kukisvumchorr. (b) Photograph of the Central open-cast mine, showing the confined paths of avalanches (arrows) and the location of explosions (ellipse). (c) Frequency distribution of the number of days with snow avalanches and technological explosions in the Central mine area (1959–95), classified by day of the week (data adapted from Reference Chernous, Fedorenko, Mokrov and BarashevChernous and others, 2006; Table 1). (d) Avalanche slope at Taumi-kozan, Itoigawa city, Niigata prefecture, Japan (36° N, 137° E; 900 m a.s.l.). The average snowpack depth is 400–600 cm. Photographs in (a) and (b) were taken by E.A. Podolskiy; the photograph in (d) is courtesy of I. Kamiisi of NIED.
Because of the scarcity of naturally occurring seismo-genic avalanches (which occur as a function of two processes with a low joint probability: the existence of snowpack with a structural weakness and the occurrence of a seismic event in the area), the Khibiny mountains are a suitable site for observations, as they are located in an area with low natural seismic activity but with regular anthropogenic seismicity caused by technological explosions or rockbursts, including the strongest rockburst known in Russia (16 April 1989, M L = 4.1).There exists a statistically significant correlation (n = 7, r = 0.88, p < 0.01) between weekly distributions of explosions and avalanches at the Khibiny mountains for 1959–95 (Table 1), with the day with the peak number of avalanches (Friday) corresponding to the day with the largest number of explosions conducted by the mining company (Apatit) (Reference Chernous, Fedorenko, Mokrov and BarashevChernous and others, 2006) (Fig. 9c). This correlation suggests that unconfirmed reports from Taumi-kozan (where similar explosions are conducted) are reliable, although witness reports are lacking (Fig. 9d).
Two additional factors should be considered in the case of mine sites: blast waves in air and outbursts of small rock fragments from open-mine explosions (Figs 1 and 9a). Air-blast waves, which arrive several seconds after seismic waves, can be important in generating failure on nearby slopes, but are negligible at distances greater than about 0.4–0.5 km (Reference Chernous, Fedorenko, Mokrov, Barashev, Hewsby and BeketovaChernous and others, 2004). Outbursts of small rock fragments into the air are also of potential importance, but are unlikely to reach distances greater than ∼0.3 km. Accordingly, these factors are unlikely to be important in terms of the statistical analysis by Reference Chernous, Fedorenko, Mokrov and BarashevChernous and others (2006; Fig. 9d), which considered all types of explosions (open-mine and underground). The effect of air-blast waves on nearby slopes is currently under investigation.
4.3. Examples of avalanches triggered by natural seismicity
4.3.1. Alaska
The simultaneous release of many earthquake-induced avalanches occurred in a glaciated area of the Chugach Mountains at 1736 h on 27 March 1964 during the Great Alaska Earthquake (M = 9.2), representing one of the most spectacular examples of earthquake-induced avalanches (Table 1). According to Reference LaChapelleLaChapelle (1968), a pilot ‘noticed snow avalanches suddenly and simultaniously falling from the mountain slopes in all directions’ (near Mount Spurr). As a result of analyses of 2000 aerial photographs taken after the earthquake by the US Geological Survey (USGS), 2036 slides were identified in the 5177 km2 area north and west of Prince William Sound, which includes the epicentre of the earthquake (near the head of Unakwik Inlet) (Fig. 10a); 95% of the slides were snow avalanches (20 rockslides, 58 combined snow- and rockslides, and 1958 avalanches and snowslides) (Reference HackmanHackman, 1968). The two longest runout distances of avalanches within several kilometres of the epicentre were about 3 and 5 km. The average density of slides was one slide per 2–3 km2. The dominant directions of the slides (southwesterly and northeasterly) reflect the prevalence of northwest–southeast-trending valleys with steep sides facing northeast and southwest (Reference HackmanHackman, 1968).

Fig. 10. (a) Map showing the distribution and movement direction of post-earthquake slides and avalanches (arrows) around the epicentre (‘+’ symbol in the left-centre part of the map) of the 27 March 1964 Great Alaska Earthquake (95% of the failures were snow avalanches). Reprinted with permission from Reference HackmanHackman (1968) © US National Academy of Sciences, courtesy of the National Academies Press, Washington, DC. (b) Slab avalanche fracture line at the Alyeska ski area (about 70 km from the epicentre) after the Great Alaska Earthquake (photograph by B. Sandahl). Reprinted with permission from Reference LaChapelleLaChapelle (1968) © US National Academy of Sciences, courtesy of the National Academies Press, Washington, DC. (c) Thickness of the slab shown in (b) (3.0–3.6 m) compared with the frequency distribution of 200 dry slab thickness reported from fracture-line studies; note that skier-triggered dry-snow slab avalanches deeper than 1 m are rare events (adapted from Reference McClung and SchaererMcClung and Schaerer, 2006).
Many witnesses were at the Alyeska ski area at the time the earthquake struck; Reference LaChapelleLaChapelle (1968) stated that ‘If the earthquake had occurred an hour earlier (before the chair lift was shut down), it would have endangered about 450 skiers in the area’. To underline the scale of the event, a photograph of a fracture line for one of these avalanche releases is shown in Figure 10b and compared with the frequency distribution of slab thickness (Fig. 10c) reported from fracture-line studies (Reference McClung and SchaererMcClung and Schaerer, 2006). Other outcomes of the event were numerous cornice falls and snow-bridge collapses. Cornice falls represent a strong trigger which can destabilize even relatively stable snow slabs (Reference LaChapelleLaChapelle, 1968). A number of positive outcomes of this event were identified by Reference LaChapelleLaChapelle (1968): ‘Thanks to the powerful triggering action of the earthquake, most of the avalanche danger zones have been identified’ and ‘the information on avalanche activity provided by this single event would have taken 50 years to duplicate by any reasonable level of normal observations’.
A number of possible consequences of the earthquake-triggered avalanches should also be mentioned. It is well known that avalanches may represent a significant accumulation factor for the net budget of glaciers. An unusual phenomenon was described by Reference Tarr and MartinTarr and Martin (1912, Reference Tarr and Martin1914) after the Yakutat earthquake, Alaska (September 1899, M = 7.4–8.0): a number of glaciers in the Yukatat Bay region showed anomalous advances (by as much as 3 km). Consequently, the authors proposed an earthquake-advance theory, claiming that snow delivered by seismic-triggered avalanches in source areas induced changes in the regimen of the glaciers. Reference Tarr and MartinTarr and Martin (1912) reported that ‘the mountains were so profoundly shaken by the earthquakes that great avalanches of snow and rock were thrown down … This probably happened not merely once but again and again during September, 1899’. Later, Reference FieldField (1968) wrote that ‘this shaking is probably the most intense to which any glaciers have been subjected during the past century in any area of the world’. The earthquake-advance theory of Reference Tarr and MartinTarr and Martin (1912, Reference Tarr and Martin1914) initially gained widespread acceptance and was used to interpret a mechanism of glacier surge (e.g. Reference DesioDesio, 1954), but ultimately the theory failed to gain lasting support (Reference PostPost, 1960, Reference Post1967; Reference FieldField, 1968; Reference BaileyBailey, 1982). For example, during the Great Alaska Earthquake, the amount of snow that cascaded onto ice fields and glaciers was estimated to be insufficient to affect the mass balance of the glaciers (Reference PostPost, 1967). A recent M = 7.9 earthquake at Denali (in 2002) occurred at a time of little snow, but almost 100 km of the fault ruptured through glacier ice (Reference HaeusslerHaeussler and others, 2004).
In addition to the hazards aspect of seismogenic avalanches, the recognition of such unique nonclimatic factors in the mass balance of a glacier is crucial for palaeoclimate reconstructions. For example, in a rare case reported in the Tien Shan, central Asia, debris related to a large, presumably earthquake-initiated avalanche from the eastern slope of Khan-Tengri (6995 m a.s.l.) was identified in a 165 m ice core recovered from South Inilchek Glacier (5300 m a.s.l.) (Table 1; Figs 4 and 6; Reference AizenAizen, 2002). The drilling site was consequently moved several kilometres upslope from the avalanche-affected area (personal communication from Reference AizenV.B. Aizen, 2010).
Spectacular Alaskan earthquake-induced avalanches have been witnessed and reported by mountaineers. An eyewitness account was provided by Reference BrowneBrowne (1913) in the area of Mount Brooks during an earthquake on 7 July 1912 (M = 7.2): ‘the whole extent of the mountain wall that formed its western flank was avalanching … The avalanche seemed to stretch along the range for a distance of several miles, like a huge wave’ (the description ‘several miles’ may correspond to 3–8 km). Another account was given by a party of mountaineers on Mount Saint Elias during an earthquake on 9 July 1958 (M = 7.8): ‘The avalanching altered radically the snow and ice surfaces on the steeper slopes … Some snowfields were carried away, and many crevasses were opened’ (Reference FieldField, 1968). On 17 June 1963, a smaller earthquake (M = 5.5) was experienced by a party camping on Columbus Glacier, near Mount Saint Elias (Reference FieldField, 1968). Reference EverettEverett (1965) stated that ‘The entire North Face of Saint Elias was avalanching. In addition, the North Faces of Mts. Newton and Jeannette were also avalanching. What probably started as a hundred smaller avalanches quickly joined together as one huge avalanche wall, about seven miles long [∼11.3 km] and 2000 to 3000 feet high [∼600–900 m]′.
4.3.2. Western Himalaya
Another region with extremely high seismic and avalanche activity, the Western Himalaya, India, has only been investigated in one study that documented and assessed avalanches likely to have been triggered by earthquakes. Reference Singh, Ganju, Paul, Kumar and SharmaSingh and Ganju (2002) performed a statistical analysis of the relationship between seismic activity and avalanche releases in the Western Himalaya, and found a direct contribution of seismic tremors to avalanche release in the area. They mention that some of the analysed cases involved casualties (Table 1). Their analysis was based on tabulated data on major seismic events in Himachal Pradesh, Kashmir and the Laddakh region (30–40° N, 72–82° E), and avalanches that occurred on the same day (cases were considered only if they were not expected by observers and could not be explained by nival–meteorological factors) for six winter seasons from 1995 to 2000 (Figs 4 and 6).
A single earthquake-induced avalanche event was witnessed by locals in the Western Himalaya in 1979, although eyewitness accounts have yet to be documented and only the year of the event is known to researchers at the Snow and Avalanche Study Establishment at Manali, India (personal communication from T.D. Vaishnava, 2009). Finally, shaking produced by technical explosions required for construction of the 8.9 km Rohtang tunnel, India, may trigger snow avalanches in the region (personal communication from R. Nagarajan, 2009; Table 1); this possibility will be examined as construction proceeds. Considering the rate of population growth in India, the high level of seismic activity in the Himalaya and the fact that India is particularly prone to avalanches (565 deaths during 1995–2006; Reference Podolskiy, Sato and KomoriPodolskiy and others, 2009), the issue of seismically induced avalanches in this region should be considered in greater detail, given the serious consequences of such events.
4.3.3. Eastern Anatolia
Some interesting cases have occurred in the Turkish mountains, although there are no detailed descriptions in published papers or documents known to the present authors or members of the Turkish avalanche team (Avalanche Research–Development, Reconnaissance and Prevention Branch (ÇAGEM); personal communication from O.M. Yavaç and Z. Yazici, 2009). Turkey has a large incidence of deaths due to avalanches (average of 22 deaths per year, with a maximum of 443 deaths in 1992; Reference PodolskiyPodolskiy, 2009). Most of the avalanche-prone areas in Turkey are located over the most seismically active fault in the eastern Mediterranean: the North Anatolian transform fault (NATF) (Fig. 11). This fault produced 35 disastrous earthquakes in the 20th century, including two of the largest earthquakes in Turkey: Erzincan (26 December 1939; M 7.7), which resulted in 32 700 deaths, and Izmit (17 August 1999; M 7.8), which is resulted in 17 118 deaths (although unofficial estimates quote a figure of ∼40 000) (Reference PodolskiyPodolskiy, 2009). The eastern part of this fault system (especially Erzincan) runs beneath the most avalanche-prone areas in Turkey (eastern and southeastern Anatolia). In this area, the NATF meets the East Anatolian transform fault. This fracture zone has a high probability of strong earthquakes (>0.6 g) within the next 50 years. The occurrence of earthquakes in this area during winter has the potential to induce avalanches, which may lead to a high number of victims in the case that rescue operations are delayed by access problems related to roads blocked by avalanches. The large number of fatalities during the Erzincan earthquake (32 700; the second-deadliest earthquake in Turkey) can be attributed in part to extremely cold temperatures and deep snow, which delayed rescue efforts because roads were blocked by avalanches and landslides. Probably a similar situation occurred in Erzincan province after the 13 March 1992 earthquake (M = 6.6; 498 deaths; Table 1) (Fig. 2c shows a grid of cracks in the snow produced by this earthquake), when avalanches blocked roads, and it appears that in both cases the avalanches were triggered by seismic tremors.

Fig. 11. (a) Effect of topographic amplification in the case of mountain ridges oriented perpendicular and parallel to the dominant direction of seismic ground motion. The ten lower curves show the seismic response along the profiles. (b) Locations of valleys (short black bars) for which topographic amplification may influence avalanche starting zones along the NATF (EACP: East Anatolian contractional province; EATF: East Anatolian transform fault; and NEAFZ: Northeast Anatolian fault zone).
5. Other Relevant Processes
5.1. Stresses and topographic amplification of acceleration
According to Reference Geli, Bard and JullienGeli and others (1988), topographic amplification of acceleration produced by strong ground motion is maximized at the top of a hill or ridge (Fig. 11a). In a past study on landslides triggered by earthquakes, Reference Asano, Matsuura, Ochiai, Okamoto, Lacerda, Ehrlich, Fontoura and SayãoAsano and others (2004) found that ‘seismic response acceleration was affected by the topology and geology, such as amplifying acceleration toward the ground surface and especially large amplification on ridges’. This finding is critically important for seismogenic snow avalanches because the starting zones of most avalanches are located close to ridges. For this reason, large amplification of acceleration along ridges, by factors of 2 or even 10 (Reference Spudich, Hellweg and LeeSpudich and others, 1996; Reference Asano, Matsuura, Ochiai, Okamoto, Lacerda, Ehrlich, Fontoura and SayãoAsano and others, 2004), can be considered a potential magnifying factor for inducing avalanche release via destabilization of the unstable snowpack. The results of seismic response analysis of a ground model and finite-element analysis, conducted to assess the risk of landslide occurrence (Reference Asano, Matsuura, Ochiai, Okamoto, Lacerda, Ehrlich, Fontoura and SayãoAsano and others, 2004), reveal that large response acceleration is likely to occur on ridges oriented perpendicular to the propagation direction of seismic waves (axis along which the seismic ground motion was applied). For example, the Pontus mountains in Turkey are a natural setting with a high probability of such an effect (Fig. 11b). This mountain range is underlain by the NATF, one of the world’s most active faults. The entire eastern part of this fault lies within avalanche-prone areas, where many valleys on the Black Sea side of the Pontus mountains are oriented perpendicular to the fault. Consequently, many starting zones of avalanche tracks in this region are oriented perpendicular to the dominant direction of potential ground motion, and thus have a high probablility of being subjected to large response accelerations during a future seismic event.
5.2. Strengthening of snow under minor shaking
It is known that soil subjected to vibrations becomes compacted and thereby stronger. This type of effect may also occur in snowpack, strengthening the snow rather than resulting in destabilization. For example, the lack of seismogenically induced avalanches in a heavy-snow area of the Srednekan basin, Magadan Oblast, Russia, which is affected by natural and anthropogenic seismic activity, could be explained by snow compaction resulting from ground trembling (personal communication from Yu.G. Seliverstov, 2009); in contrast, earthquake-induced avalanches (volumes of ∼105 m3) have been witnessed in this region. In addition, Reference Singh, Ganju, Paul, Kumar and SharmaSingh and Ganju (2002) proposed that minor earthquakes with magnitudes less than 2 may act to enhance the stability of the snowpack (see also Reference Chernous, Fedorenko, Mokrov, Barashev, Hewsby and BeketovaChernous and others, 2004). This hypothesis remains to be confirmed by experimental results and field observations.
6. Concluding Remarks and Future Questions
This study attempted to fill a gap in our knowledge regarding the occurrence of earthquake-induced snow avalanches, and sought to provide a brief overview of relevant processes and to estimate the frequency of this rare natural hazard. Known cases (about 22 for the period 1899–2010) are documented from only a fraction of the world’s mountains and were confirmed for earthquakes with magnitudes as low as ∼M 5, and located up to 340–640 km from the epicentre in the case of the strongest earthquakes. The results of statistical studies indicate comparable minimal magnitudes for such events (M>3), but smaller threshold magnitudes (>1.9), which remain to be validated. Reported cases agree well with the upper bounds of known landslides in terms of the relationship between earthquake magnitude and the maximum distance from the earthquake source or total area affected by landslides. However, most of the statistically identified data lie above the upper bound of distance from source to landslides. These data are yet to be confirmed by witnessed cases. Despite the lack of documented cases, it is possible to suggest that earthquake-induced avalanches are common in areas prone to both seismicity and avalanche activity (representing about 3.1% of the land on Earth). The lack of a physical understanding of the phenomenon and its development means that a comprehensive experimental and observational study is required.
The forecasting of seismic avalanches is closely related to short-term predictions of earthquakes. Because no reliable method of earthquake prediction has been developed (except for real-time seismology, which provides a 10–30 s warning of the approach of S-waves (e.g. Japan Meteorological Agency)), we can only assess the probability of avalanche release during seismic events. For this purpose, it is necessary to understand the change that occurs in snow stress under vibrations and earthquake loading.
In terms of the factors that may contribute to seismogenic avalanches, the following should be considered and investigated:
-
1. the behaviour of different types of snow under vibrations with different accelerations that produce short-lived stresses in the snow cover,
-
2. the dynamics of inertial stresses and fracture,
-
3. the role of high loading rate, normal pressure change, resonance effects, crack propagation, and toughness characteristics,
-
4. topographic amplification of acceleration upon mountain ranges,
-
5. avalanche-flow changes under strong ground motions (e.g. mechanical fluidization and reduction of basal friction during shaking).
Given the infrequent occurrence of earthquake-induced avalanches, experiments are the best approach to understanding the behaviour of snowpack during earthquakes. Cold-laboratory shaking-table tests are required to determine the response of snow to earthquake vibrations and to understand the specifics of acceleration-induced stresses and failures. A series of experiments using a shaking machine with variable degrees of freedom and inclinations would help to estimate the critical accelerations that have the potential to cause failure on snow slopes, or to determine the effects of shaking on avalanche flow, as determined from the results of experiments based on the artificial shaking of slope models. Cold-laboratory, shaking-table tests are required to determine the response of snow to earthquake vibrations and to understand the specifics of acceleration-induced stresses and failures (see Reference Podolskiy, Nishimura, Abe and ChernousPodolskiy and others, 2010).
Acknowledgements
We are greatly indebted to P. Bartelt for editing assistance and to T. Faug and an anonymous reviewer for detailed and insightful reviews. This work was partially supported by the Ministry of Education, Culture, Sports, Science and Technology, Japan, and by a grant (05-05-64368-A) from the Russian Foundation for Basic Research; this support is greatly appreciated. We are also grateful to D.A. Short, D. Bodington, B.O. Grigholm and A. Stallard for help with improving the English. This work was partially supported by the Ministry of Education, Culture, Sports, Science and Technology, and Grants-in-Aid for Scientific Research (18651093), Japan, and by a grant (05-05-64368-A) from the Russian Foundation for Basic Research.
Appendix
Snow profiles and earthquake fact sheet for earthquake-induced avalanches observed in Niigata and Yamagata prefectures (2001 and 1978, respectively), Japan.


