


A complete education extends beyond the classroom as colleges and universities strive to produce well-rounded citizens (Colby et al. Reference Colby, Beaumont, Ehrlich and Corngold2007). Part of this broader civic education includes presenting students with tools to become active and informed participants in democratic decision making. In most of the United States, registering is an important prerequisite for voting in elections. College students, like other populations that relocate on a regular basis, have lower rates of voter registration than the broader population, which lessens their collective electoral clout. Can schools take simple steps to increase voter registration among their students?
The imperative for answering this question is not mere idealism. Colleges and universities have a legal requirement to take proactive steps in registering their students to vote. A 1998 amendment to the Higher Education Act requires them to obtain voter-registration forms before the local registration deadline and distribute them to students enrolled in all degree and certificate programs; failing to comply can jeopardize federal student-aid funds. Although oversight of progress in registering students to vote and enforcement of penalties are lax, colleges and universities have both legal and moral motivations to register their students to vote.
Few people involved in higher education would disagree with the goal of assisting students to engage in civic life, but the question remains of how to accomplish this efficiently.
Few people involved in higher education would disagree with the goal of assisting students to engage in civic life, but the question remains of how to accomplish this efficiently. College students are an unusual population, and the effort to engage them in politics presents logistical and psychological hurdles for universities. Young people are as likely as older people to be involved in civic activities (e.g., volunteering and belonging to groups), but they are considerably less likely to be involved in electoral politics (Keeter et al. Reference Keeter, Zukin, Andolina and Jenkins2002; Wattenberg Reference Wattenberg2015). Part of this reduced attention to voting may be due to the fact that college students often reside in two separate geographic areas—home and school—which psychologically weakens their duty to participate in any one jurisdiction’s election. Furthermore, they are young and have not yet developed the habit of voting (Gerber, Green, and Shachar Reference Gerber, Green and Shachar2003), and they may not have information about the basic mechanics of voting (Addonizio Reference Addonizio2006). Moreover, registration is a larger burden for people who relocate frequently (Highton Reference Highton2000; Wolfinger and Rosenstone Reference Wolfinger and Rosenstone1980). Even when they are not moving across jurisdictions, students are highly mobile and change their address frequently, which makes updating registration information more important and compounds the difficulty of the task. Footnote 1 However, our interviews with student leaders indicated that increased bureaucratic costs and inexperience with voting are not the sole drivers of opting out of electoral politics. Some students deliberately reject formal politics on principle, preferring instead to address social issues by directly helping people (Long Reference Long2002). Students who consciously opt out of electoral politics may be especially difficult to engage. Moreover, it is not clear whether the authority enjoyed by schools in academic disciplines extends to ethical and civic realms; therefore, they may be ineffective messengers regarding the importance of electoral politics. Thus, the lessons learned from other civic-engagement experiments may not apply to university efforts to register students, and a rigorous program evaluation of registration efforts is needed.
Registration is generally a difficult behavior to study because the appropriate sampling universe is not clear. Unlike “Get Out the Vote” experiments that focus on an official list of registered voters, there is no list of unregistered citizens for experiments on voter registration. Scholars have been forced to study larger units (e.g., streets) (Nickerson Reference Nickerson2015) or rely on consumer data (Mann Reference Mann2011). Footnote 2 A college campus is an excellent laboratory for the study of registration because the list of enrolled students defines the targeted population and schools have contact information for all students—even those who are not registered to vote. Thus, students are not only a normatively interesting population to study; they also solve the nontrivial research-design problem of creating a well-defined subject population.
Our experiment was conducted in partnership with the American Association of State Colleges and Universities (AASCU) across 16 public universities in 2006. Classrooms participating in the experiment were randomly assigned to one of three conditions: (1) no intervention, (2) registration presentation by a professor, or (3) registration presentation by a student volunteer. We then matched the home and school addresses for students enrolled in the experimental classes to official voter-registration lists to determine which students were registered and which ultimately voted. This experiment, involving 25,269 students in more than 1,026 treatment classrooms, found that presentations by both students and professors increased voter registration rates by approximately 6 percentage points. Voter turnout rates increased by 2.6 percentage points. These two results indicate that roughly one third of the students registered to vote in this intervention voted and that college campuses have a sizeable number of students who would participate with direct classroom outreach. Footnote 3 Presentations took less than 15 minutes of a single class period and appeared to be an effective and efficient means for schools to increase registration rates among their students. This approach should be adopted more broadly by institutions seeking to convert the legal mandate of making registration forms available to a registration program that successfully engages students in the electoral process.
THE EXPERIMENTAL STRATEGY
College campuses are an excellent place to conduct voter-registration experiments because student directories are an ideal sampling frame, for four reasons. First, addresses should be accurate because students registered for classes (and paid tuition) only a month before the experiment, and the administration must mail grades and future bills. Second, where applicable, schools provided both home and local addresses. Because young people often maintain an address with their parents, having both addresses allows subjects to be tracked more accurately. Third, 84% of the schools in the experiment provided dates of birth to facilitate an accurate match in the voter file—even if the addresses were not current. Fourth, the directory contained information about every student in the classrooms included in the experiment, thereby satisfying our need for a well-defined subject population.
Schools were recruited by the AASCU and its American Democracy Project (ADP) through e-mail solicitations to member campuses. Upper-level administrators agreed in principle to participate and appointed a chief coordinator for the experiment, Footnote 4 who participated in a five-hour training session at the national ADP meeting in Utah. Footnote 5 Researchers followed up with all campus contacts by e-mail and telephone to answer questions, confirm participation, complete Institutional Review Board (IRB) forms, and map out campus registration plans. All institutions in the experiment were public, did not have competitive enrollment processes, and generally catered to area residents. The students in the experiment came from higher socioeconomic strata than noncollege youth, but they encompassed a diverse array of racial, economic, and social backgrounds (see table A1 in the online appendix for a list of the schools included).
Implementing the classroom-based registration experiment required several steps. First, professors had to be recruited to participate in the experiment; most did not respond to our requests. Footnote 6 A few especially motivated professors did not agree to participate because they objected to the control group. Although not representative of all classes on campus, the set of professors that did participate covered a broad range of disciplines and levels.
Second, the classes were randomly assigned to one of three conditions: (1) control group, which did not receive any registration outreach; (2) registered by the professor, with an assistant delivering registration cards to professors before class and later collecting the completed cards; and (3) registered by a student assistant, who the professor allowed to come in at the end or the beginning of class to make a brief presentation and distribute registration cards. The randomization occurred within strata and, when possible, each professor’s courses were placed within a single strata. Footnote 7 Professors had significant latitude about what they said regarding registration. A sample script was provided to project coordinators on each campus (see online Appendix B); however, each campus, peer, and professor customized the presentation. Footnote 8 A key component of the treatment was that registration cards were distributed to students to fill out during class. This generally occurred in September, after the school year began, but a few classrooms in states with late registration deadlines had presentations in early October.
Third, it was necessary to devise a solution to restrictions imposed by the Family Educational Rights and Privacy Act (FERPA). Some university legal teams interpreted FERPA as forbidding the disclosing of courses in which a student was enrolled at the time of the experiment, even with IRB approval and strict privacy protections. We worked with legal departments at several universities and agreed that courses would provide a meaningless code associated with treatment assignments. The codes then were appended to the student directory. This strategy allowed researchers to know the assignment and unit of randomization without knowing a specific class taken by a student. Ultimately, 12 of the 16 schools provided course numbers or codes; the remaining four appended the treatment assignment but did not provide a course code. Footnote 9
Knowing the unit of randomization was important because it is possible that students taking a particular course share similar civic-participation propensities. For instance, early-morning courses may be more appealing to people with afternoon jobs, and students taking political science courses may be pressured in other ways to register and vote. As a result, the analysis needed to cluster the standard errors on the classroom—the unit of randomization (Arceneaux and Nickerson Reference Arceneaux and Nickerson2009). On average, the clustered standard errors were 17% larger than in a naïve analysis that treated all students as independent observations. For the four schools that did not provide course codes, the standard errors provided in this way were multiplied by 120% to adjust the standard errors.
In all of the experiments, registration and turnout were ascertained by matching student directories to a nationwide voter file maintained by Catalist LLC, a for-profit company that provides voter information to partisan and nonpartisan civic organizations. These files include official validated voting data based on state voter-registration and turnout records. Matches were made to both school and home addresses but relied primarily on name and date of birth, which are unique identifiers in almost all instances. Catalist LLC uses fuzzy matching that has been calibrated using a machine-learning algorithm. Hand-checking several dozen names, we found no obvious mistakes or missed matches. As a result, we believe that the key dependent variable was measured accurately for students regardless of where they live and was not subject to error from self-reporting or social desirability.
RESULTS
Before analyzing the experiments, it is interesting to consider the range of registration rates across schools. The average school had 59% of the control group registered. Most of the schools fell narrowly within those bounds (i.e., 10th percentile = 51% and 90th percentile = 68%). According to the 2006 Current Population Survey, 62% of eligible students reported being registered to vote, which was below the average of 78% for all citizens older than 18. Thus, the behavior of students involved in the experiment mirrored that of students nationwide.
Figures 1 and 2 show the complier average treatment effects for the classroom experiments with presentations led by professors (dark bars) and students (light bars), respectively. (See tables A2 and A3 in Appendix A for the full regression tables.) In general, classroom presentations were effective in increasing rates of voter registration. In all, 11 of 14 professor-led presentations resulted in positive coefficients, and eight of those experiments crossed traditional thresholds for statistical significance. If there truly were no effect of the presentation, we would have observed 11 positive coefficients in 14 experiments less than 3% of the time; therefore, these results are extremely unlikely to be due to random chance. Pooling all of the experiments, we estimate that presentations by professors increased the rate of voter registration by 6.5 percentage points (s.e. = 1.5). Because the rate of voter registration in the control group was approximately 60%, this means that registration rates increased by 10% as a result of the presentation. Thus, nearly half of the difference between registration rates in the general populace and among students could be addressed by classroom presentations led by professors.

Figure 1 Complier Average Treatment Effect versus Control of Classroom Presentations on Voter Registration
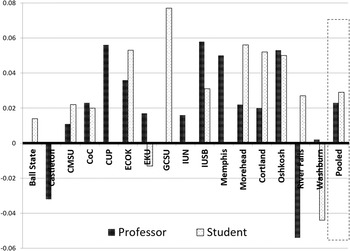
Figure 2 Complier Average Treatment Effect versus Control of Classroom Presentations on Voter Turnout
The results are almost as positive for student-led classroom presentations. Of the 12 schools conducting these experiments, 10 were positive and seven crossed traditional thresholds for statistical significance. Under a null hypothesis of no effect, 10 positive results in 12 experiments would be observed only 3% of the time. Pooling the results, we estimate that student presentations encouraging voter registration increased the rate by 5.6 percentage points (s.e. = 2.1); that is, registration rates increased by 9% in treatment classrooms. Mobilization by students is statistically indistinguishable from registration by professors. This finding suggests that the context of a captive classroom audience is more important than the specific authority conducting the registration.
A natural follow-up question is: What happened to turnout after students were registered? Because not every student who registered will ultimately vote, the effect of the classroom presentations on voter turnout is important to measure. Figure 2 presents the complier average treatment effect of the professor-led (dark bars) and student-led (light bars) classroom presentations on voter turnout. We observed that 12 of the 14 experiments testing presentations led by professors showed an increase in voter turnout, which would occur less than once in 100 times if the presentations were ineffective. Pooling all of the point estimates, we estimate that professor-led registration efforts in the classroom increased voter turnout by 2.3 percentage points (s.e. = 0.008). Almost identical results were found for student-led presentations, in which 10 of the 12 experiments had positive coefficients and a pooled estimate of 2.9 percentage points. Because the overall rate of turnout across campuses in the control group was 20%, the classroom presentations appear to have increased voter turnout rates by 10%.
Mobilization by students is statistically indistinguishable from registration by professors. This finding suggests that the context of a captive classroom audience is more important than the specific authority conducting the registration.
These estimated effects are not trivial. If a professor made a presentation to 100 students, they created six new registrants and two votes among students who otherwise would have abstained. Given that door-to-door registration drives were found to increase overall registration rates by 4.4% (Nickerson Reference Nickerson2015) and that e-mail outreach is not effective (Bennion and Nickerson Reference Bennion and Nickerson2011), these results demonstrate that classroom registration efforts are relatively effective. This finding is particularly striking because two thirds of all participating schools had campus-wide voter registration tables available to students during the experiment and all had various forms of traditional campaigning taking place. If all 4 million students currently enrolled at AASCU schools received registration appeals in the classroom, our results predict an increase of 240,000 new registrants and approximately 80,000 new voters.
DISCUSSION
Institutions of higher education have a civic, pedagogical, and legal obligation to register their students to vote. The experiments described in this article demonstrate that this obligation can be fulfilled with minimal investment on the part of the university. Taking 15 minutes of class time during the fall semester increased registration rates by approximately 10%, which translated into a downstream increase in turnout of 10%. Moreover, it does not matter whether the presentations were performed by student volunteers or professors. With such high returns for a minimal investment of resources by universities, these experiments removed objections to engaging students based on efficacy or logistics concerns.
It is possible that alternative strategies such as setting up registration tables and including registration forms in enrollment materials can achieve similar results, but we suspect that neither strategy will prove to be as effective. Although students were certainly free to not fill out a registration card, a unique feature of the classroom presentations was that the audience was captive and forced to focus briefly on voter registration. Because the students least attentive to voter registration are likely to be those who need assistance in registering, less aggressive strategies are less likely to be successful. However, the success of alternative strategies is an empirical matter, and we strongly encourage systematic experiments using these strategies.
SUPPLEMENTARY MATERIAL
To view supplementary material for this article, please visit http://dx.doi.org/10.1017/S1049096516001360.Footnote *


