


Introduction
Antarctic coastal latent-heat polynyas form by a number of processes (Reference Massom, Harris, Michael and PotterMassom and others, 1998). In the case of the Mertz Glacier polynya (MGP), centred on −67° S, 145° E, a floating glacier tongue extends northwards into the prevailing westward advection of sea ice around the coast. Grounded icebergs on a shoal north of the terminus anchor a fast-ice cover ∼ 2 0 km wide (hereafter referred to as the "finger") from March-April to October-November each year, doubling the length of this blocking feature (to −160 km). The latter prevents ice advection into the polynya, where strong and persistent katabatic winds draining into Buchanan Bay enhance rapid rates of sea-ice formation and removal. While katabatic winds maintain near-shore localized areas of open water and high ice-production rates (e.g. in Buchanan Bay), more extensive polynya openings and closings are dependent on the passage of synoptic weather systems. As a result of these and other factors, the MGP is a major site of formation of cold high-density water that contributes to Antarctic Bottom Water (AABW) production (Reference Rintoul, Injacobs and WeissRintoul, 1998; Reference Bindoff, Rintoul and MassomBindoff and others, 1999), and is thus of global significance.
In this paper, we report on other important yet previously overlooked processes affecting polynya behaviour and size on synoptic to seasonal time-scales. These include the break-out of fast ice "upstream" (to the east of the region), the effect of the ensuing floe train as it drifts across the polynya region, and grounded iceberg and fast-ice distributions "downstream". We present data collected during a July-August 1999 cruise on board the Australian ice-breaker R/V Aurora Australis. Fast-ice, grounded iceberg and polynya distributions were monitored using satellite data from cloud-free U.S. National Oceanic and Atmospheric Administration (NOAA) Advanced Very High Resolution Radiometer (AVHHR) channel 4 (thermal infrared; λ 10.5μm; spatial resolution ∼1km) scenes received at Casey Base, and RADARSAT ScanSAR (frequency 5.3 GHz; A 5.6 cm; 100 m resolution; 500 km swath width) data collected at McMurdo Sound and processed at the Alaska SAR (synthetic aperture radar) Facility. In situ observations used include automatic weather station (AWS) data from the Stillwell Islands (66°57.5’ S, 143°56.4’ E), drifting-buoy data and routine hourly observations of sea-ice characteristics (including snow and ice thickness). Where speeds are given, they represent the total translation of the buoy or floe divided by the total time.
Controls on Polynya Shape and Size
The sequence of events from mid-June to late November 1999 gives insight into the complex role of fast ice and grounded icebergs in polynya and regional pack-ice behaviour. Figure 1 is an AVHRR image from 14 June showing sea-ice conditions in and around the MGP. Southeasterly winds have created an elongated coastal polynya extending from Commonwealth Bay to the tip of the "finger". To the north, a compact stream or "tongue" of vast (as large as 25 km diameter) thick floes from the east, consisting of multi-year fast-ice floes which have broken out and thick floes, extends right across the polynya outlet region (from ∼147° to west of 136° E).

Fig. 1. An AVHRR channel 4 image, 14 june 1999 (1657 UTC), with features referred to in the text marked. DD, dumont d’urville; cb, commonwealth bay; wb, watt bay; bb, buchanan bay; gb, grounded icebergs; FI, fast ice. grounded bergs S and T originate from ninnis glacier ( Reference Wendler, Ahlnas and Linglewendler and others, 1996). ice to the south of the "tongue" is much thinner and therefore significantly "warmer" in thermal infrared images. a-d refer to ice- and snow-thickness distributions given in table 1. arrows denote the approximate large-scale ice-drift direction (light denote new ice, dark denote thick, multi-year and broken-out fast ice), as determined from buoy tracks (Reference Lytlelytle and others, 2001) and satellite-tracked floes. mean daily drift speeds of large floes 1 and 2, as tracked in sequential AVHRR images between 14 and 16 june, are ∼0.08−0.17M s−1 (6.9−14.7km d−1).
The supply of fast-ice floes increased in early July with a break-out of the eastern part of the "wedge", which now ran from ∼66.2° S, 150° E to Cape Freshfield (Fig. 2); in June, it extended to the northeastern tip of the Cook Ice Shelf (Cape Hudson). Once loosened, the ice was cleared out northwards at an estimated mean speed of ∼0.1 m s"1 (over the period 11−17 July) as a series of immense floes, up to 70 km × 40 km in size, that fed into the "tongue".
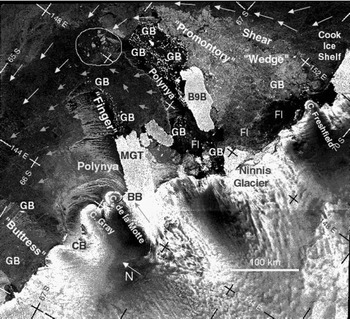
Fig. 2 RADARSAT scansar mage for 4 august 1999 (1032 UTC). the "wedge" of highly deformed perennial fast ice has a strong backscatter signature, consistent with multi-year sea ice with a thick multi-layered snow cover. the yellow circle contains the six tracked floes. abbreviations as for figure 1. arrows denote the approximate large-scale ice drift (short denote new ice, long denote thick multi-year ice). grounded iceberg locations are determined from time-series analysis of sequential SAR images. swath width is 500 km, and spatial resolution degraded to 200 m. the large polynya was produced by very strong winds (to ∼25m s−1) associated with a broad trough of low pressure lying east-west along 63−65° s. ©RADARSAT international/NASA, 1999
Table 1. large-scale ice- and snow-thickness distributions from ship observations, for locations a-d marked in figure 1, july-august 1999

Lines on the satellite images represent boundaries between different ice regimes, based on their thermal signature and hourly ice observations. On a north-south transect along ∼143° E from 22 to 24 July, very thick and multi-year floes were encountered in a ∼165 km wide band (∼63.0−64.5° S). They accounted for an average of about 40−50% of the total ice concentration (which was in the range 80−100%), but in places drifted in compact (100% concentration) assemblages. While floe size was in the range 20−100 m in the north (affected by swell break-up), a band of very large floes (>2km across) was concentrated along the southernmost 20 km of the "tongue". The thickness of these high-freeboard multi-year floes ranged from an estimated 2−6 m (possibly an underestimate), with old weathered ridges an additional 3−4 m high. The snow cover was 1−2 m thick and multi-layered, suggesting that the ice was of multi-year origin rather than being highly deformed first-year ice. The boundary between this band and thinner ice to the south was very abrupt.
Further to the east (∼145.6° E) and on 24 August, the boundary between the "tongue" and the thinner (∼0.4 m) ice to its south again occurred very abruptly at −65.6° S, in both surface observations and AVHRR imagery. The southern part of the "tongue" comprised a 100% concentration of vast flat floes of ice similar to first-year fast ice observed in the "finger", i.e. 0.7 −0.9m thick ice with a 0.2−0.5 m thick snow cover, with multi-year floes 3−6 m thick −15 km to the north. Between 25 and 26 August, the ship drifted westwards with these floes at a rate of 0.21−0.55 m s"1 (in winds to ∼ 2 5 m s−1) in the storm marked Q in Figure 3.
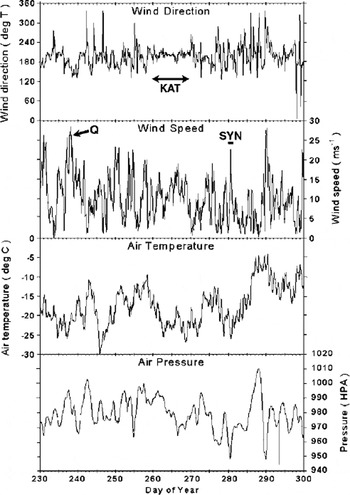
Fig. 3. time series of meteorological data collected by the stillwell islands aws, august-october 1999.
To the east of the MGP, a "promontory" of very thick perennial fast ice extends ∼300 km out from the coast, anchored by grounded Iceberg B9B, as well as two 90 km lines of multiple grounded bergs to the north, and more dispersed grounded bergs to the southeast. This blocking feature has a profound effect on the sea-ice cover over a large region. A significant build-up of highly deformed ice occurs upstream to form a compact "wedge" of semi-stationary thick ice (estimated area ∼ 4 5 000 km2, as derived from the SAR image of 4 August (Fig. 3)). Ice drifting westwards along the Antarctic coast to the east of-150° E and south of-66° S is deflected northwards by the eastern boundary of the combined "promontory" and "wedge" (Fig. 1). This ice emerges to the northwest of −66° S, 149° E to feed into the "tongue" as a stream of thick floes individually up to 700 km2 in area. Mean speeds of five vast floes breaking away from the tip of the "wedge" and entering the "tongue" in August (Fig. 3), as derived from feature-tracking in sequential SAR scenes, range from 0.06 to 0.26 m s−1 (mean 0.17 m s−1, n = 29) over a 16 d period (2−18 August). The ice edge is located at ∼58.5° S at this time.
The region around 64.5−65.5° S, 147° E forms a confluence for streams of thick ice from regions to the east (Fig. 1), including periodic break-outs of fast ice from the eastern margin of the "wedge" (later in the season) and other unknown coastal sites. Thinner ice originates from the persistent embayment between Mertz Glacier, large grounded bergs (marked S andT) and Iceberg B9B, which has relatively deep water and regularly opens in response to storms to form a site of periodic high ice formation. Ice drifting from this region is deflected to the northeast then northwest by the "finger" (Fig. 1). As such, a stream of ice ∼450 km wide at 152° E is effectively concentrated into a compact band only 50−200 km wide to the west of 149° E, assuming a net westward drift (as shown in Reference Heil and AllisonHeil and Allison, 1999). Given the drift speeds outlined above, and from Figure 1, the westward advance of this "tongue", which approximately follows the 3000 m bathymetric contour, represents the transport of a large volume of relatively thick ice across the polynya outlet zone. Assuming a mean thickness of 4 m, a concentration of 50% and a mean speed of 0.17 m s-1 for these floes, the daily mass flux of this thick ice through a gate 100 km wide north of the "wedge" would be 3.19 × 10 9 3 3d −1 (or an area of ice of ∼ 9 0 0 0 km2). As such, these floes may account for a substantial fraction of the total regional ice volume, and form a major fresh-water source. Although the "tongue" tapers to the west, and floe fragmentation occurs (although large floes to ∼ 3 0 0 km2 in area are still apparent), it remains a coherent and spatially continuous barrier which hems in the polynya region and separates it from the outer pack-ice zone further north.
To the west of the MGP, a further impediment to the outflow of ice formed in the polynya occurs annually in the form of an annual "buttress" of heavily deformed first-year fast ice extending −90−120 km outwards from the coast east of Dumont d’Urville. Its initial formation in mid-April is linked to the trapping of ice from the polynya by a north-south, −100 km long line of bergs grounded on shoals ∼ 2 0 0 m deep (Figs 1 and 3). By mid-May fast ice has connected these bergs to the coast and another group at −65.8° S, 140° E, with dispersed grounded bergs to the south also acting as anchor points. The influence of this feature extends back towards the polynya as a zone of highly deformed thick ice builds up eastwards. Together, the "tongue" and "buttress-greatly narrow the outlet zone for ice forming in the polynya, to −60−100 km wide, compared to an ice-producing coastal front which is often ∼ 3 0 0 km long (Fig. 1). The "buttress" partially breaks out and re-forms a number of times each season, in response to severe storms and possibly long-period swell penetration from the open ocean and tidal effects, but persists until late into the year.
The ice to the south of the "tongue" is significantly thinner (as reflected by its thermal signature in Figure 1). Sea-ice thicknesses from ship observations are marked in Figure 1 and presented in Table 1. As expected, there is a gradient in thickness from southeast to northwest, with significant thickening occurring by deformation as the ice drifts northwestwards towards the constricted outlet and in particular in the vicinity of the "buttress" and the associated grounded bergs.
Synoptic-scale polynya behaviour
While polynya size depends on wind direction and strength, it is also greatly influenced by the blocking features described above. Although the Mertz Glacier and "finger-are of paramount importance to polynya opening, the "tongue" and "buttress" work to limit its size. They directly limit its northern and western extent, respectively. Moreover, by creating a constricted outlet zone to the northwest, they cause intermittent "back-filling" of the polynya. An example is given in Figure 4. On 2 October (day 275), a cyclone centred on 63° S, ∼140° E generated easterly-southeasterly winds up to 20 ms−1 (Fig. 2, marked SYN), creating an extensive elongated polynya adjacent to the coast and "finger" (Fig. 4a). The cyclonic centre (as seen in U.S. National Centers for Environmental Prediction (NCEP) re-analysis data) then moved rapidly to the south> east (it is centred on 67° S, −165° E at 1200 UTC on 3 October), setting up a more southerly airstream. Combined with low temperatures (∼15°C), these conditions drove high rates of frazil-ice formation. By this process, the polynya produces ice more quickly than it can be transported out of the region by the wind. "Bottleneck" conditions across the outlet zone lead to ice deformation (ridging and rafting) as ice is exported from the polynya, and eventually "backk-filling" of the polynya as ice production exceeds export. Six*• teen hours after the 2 October image, this led to a significant it reduction in the area of open water (Fig. 4b), and thus frazil-ice formation. Thus, while strong southerly to easterly winds Is are required for the polynya to initially open, they also generate high ice-formation rates which may subsequently "choke" it. Subsequent storms cause a temporary reopening and flush out the polynya region to some extent before closure again occurs, and so the cycle continues. While the "tongue" temporarily and partially disperses during interrmittent storms, it remains a coherent and significant barrier. r. With their deep draft and high freeboards, the very thick floes react to changes in wind forcing differently than does the thinner surrounding ice, and have a large impact on the latter. Note, for example, the "shadow effect" (open water and new ice) in the lee of the northern boundary of the "tongue" at-146° E in Figure 4a.
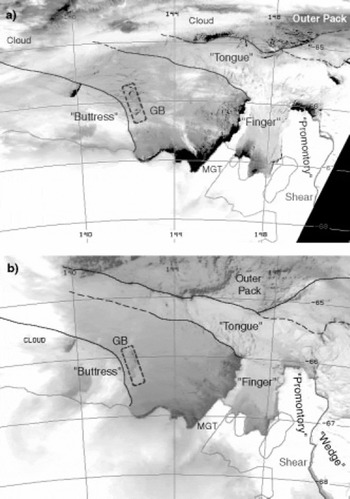
Fig. 4. avhrr channel 4 images for (a) 2 october (1623 utc), and (b) 3 october 1999 (0821 utc).
Localized forcing by katabatic winds is a significant feature of the Commonwealth Bay to Buchanan Bay region to the south. Katabatic winds entering Buchanan Bay are persistent and stronger, more consistent in direction and different in phase than those entering Commonwealth Bay, with winds being less strong in the intervening Watt Bay (personal communication from I. McCarthy, 1999). When katabatic winds predominate, they produce smaller openings in the ice cover, as illustrated in Figure 5a, compared to the larger "shadow effects" associated with cyclones (e.g. Figs 3 and 4). At this time (25 September), a quasi-stationary high-pressure ridge was present just to the west (along −135−140° E), with a weak pressure gradient over the region producing light southerly synoptic winds. The main forcing was katabatic, with localized winds of-15 m fl combining with consistently low air temperatures (-18° to −26°C) over a 10 day period (days 263−273 in Fig. 2 (marked KAT), or 20−30 September), with the exception of a lull on day 270. Note the consistency in wind direction (from the south) over this period.
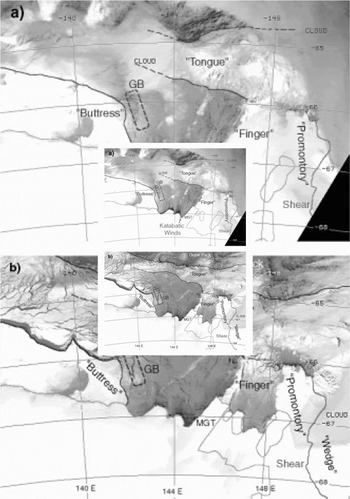
Fig. 5. avhrr channel 4 images for (a) 25 september (1600 utc), and (b) 29 september (1112 utc) 1999. note the long cloud streets emanating from buchanan bay in (a). when open, the polynya has a significant effect on regional cloud and precipitation regimes. note also the fragmentation of the northern margin of the "buttress" in ( b); this, and subsequent reforming, is a regular occurrence. this ice cover is similar to that in june (fig. 1), with the "tongue" continuing to be a prominent feature.
In spite of their limited areal extent, polynyas driven predominantly by katabatic winds generate very high rates of ice (and cloud) production. As these winds typically dissipate in strength some tens of kilometres offshore, they lose their ability to transport the ice. This again results in significant and often rapid "back-filling" to greatly diminish the open-water area, as shown in Figure 5b. By this time (-4 days later), the katabatic winds have combined with slight southerly pressure-gradient winds. This process is compounded by the presence of a well-developed "buttress" to the west. Buoy drift data (Reference LytleLytle and others, 2001) show that whereas sea ice formed along the upper western margin of Mertz Glacier Tongue (MGT) and "finger" largely drifts northwestwards towards the outlet zone, ice produced along the southern coastal margin typically swings to the west, as also shown by frazil streamer orientations in Figure 3. This ice subsequently becomes trapped in, and contributes to, the zone of heavily deformed and semi-stationary ice adjacent to the grounded iceberg and "buttress" zone. This again causes rapid "back-filling", particularly in Commonwealth Bay, and limits the western extent of the polynya. The southeastern margin of the buttress at times totally fills in Commonwealth Bay (e.g. late July 1999).
Other conditions which lead to periodic and rapid polynya closure are changes in wind direction, and the cessation of strong winds combined with rapid refreezing by nilas formation. Such a situation occurred between 19 August (day 231) and 21 August (day 233) (Fig. 2). From 38 cloud-free AVHRR scenes from 18 August to 31 October 1999, it was estimated that the polynya was closed on 13 days (34% of the time), large in the south (Commonwealth Bay to Buchanan Bay region) on 4 (11%), small in the south on 5 (13%), fully open (from the "finger" to Commonwealth/Watt Bay) on 9 (24%) and small in this extended region on 7 days (18%).
A Significant Late-Season Change in Polynya and Regional Sea-Ice Behaviour
The cycle of events described above continued until early October in 1999, when there was an abrupt change in regional sea-ice and polynya behaviour (as observed in the AVHRR time series), related to synoptic atmospheric forcing. Net ice advection changed from northwest to northeast, remaining that way until the ice surrounding the polynya disappeared in early December. The AWS time series from about 7 October (day 280) until 24 October (day 297) show a strong southwesterly-westerly component (Fig. 2). Significantly, this halted the supply of thick floes from the east, dispersing the "tongue" and effectively flushing out the polynya region and the thick-ice region to the east of the "wedge" (Fig. 6). Rather than feeding into a westward-drifting "tongue", vast floes (up to 100 km × 50 km) produced by the continuing break-up of the eastern "wedge" margin were thereafter swept northeastwards, as determined by analysis of AVHRR time series to the east (not shown). The migration of a cyclone inland on 15−17 October set up strong southwesterly-westerly winds (Fig. 2), which greatly enlarged the polynya area, and created a more divergent ice cover to the north which now connected to the dynamic outer pack. Unimpeded by the "tongue" and largely drifting away from the receding "buttress", ice forming in the polynya was now swept continuously northeastwards. This "conveyor belt" process may replicate the conditions which would occur throughout the winter (although possibly with higher ice-production rates) if the "tongue" and "buttress" were not present.
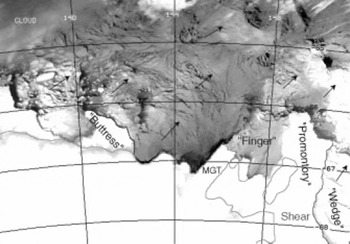
Fig. 6. AVHRR channel 4 image showing the dispersal of the "tongue"and pack ice, 12 october 1999 (1816 UTC). although the fast-ice "finger" disintegrated by 10 october, the iceberg line continues to act as a significant blocking feature. arrows denote the approximate large-scale drift direction of the ice, as determined from the time series of avhrr images (10−12 october). b, "buttress"; pr, "promontory"; FI, fast ice.
In November, the polynya region was temporarily enclosed by a more dispersed "tongue", composed of first-year ice drifting from the west-southwest rather than the east (Fig. 7). This behaviour continued until ∼2 December, when the new "tongue" abated, exposing the polynya region to the wider open ocean. Although large portions of fast ice broke off in mid-October, a reduced-area "promontory" (compared to early in the season (e.g. Fig. 1)) remained largely intact to greatly influence polynya behaviour in the following year (2000). The "buttress" diminished greatly in size between mid- and late November, finally disappearing by mid-December.
Fig. 7. AVHRR channel 4 image from 14 november 1999 (1919 UTC). arrows denote the approximate large-scale drift direction of the ice, as determined from the time series of AVHRR images (15−21 october). b, "buttress"; PR, "promontory"; FI, fast ice.
Comparison with Conditions in Previous Years
Comparison of 1998 and 1999
Analysis of longer-term AVHRR data shows that the "tongue" of fast-ice floes played a significant role in polynya development from mid-February in 1998, compared to late summer (early March) in 1999. Significant new-ice formation began in the polynya region in February in both 1998 and 1999. A more dispersed "tongue" also enclosed a greatly enlarged polynya region from mid-October until mid- to late November in both years, with localized frazil-ice formation continuing in Buchanan Bay until late November. The supply of thick and broken-out fast ice from the east occurred each year, but at different times; this led to a significant variability in polynya areal extent and the timing of maximum extent (July in 1998, August in 1999). More open ice conditions in and around a larger polynya were present in July 1998 (than in July 1999), as also witnessed on a cruise to the region in July 1998. This is related to the absence of a well-developed "tongue" from the late May to mid-July period in 1998 and a smaller "buttress" (Fig. 8), allowing the largely unimpeded northward and northwestward export of ice from the polynya. Initial "buttress" development began in early April in 1999, compared to early May in 1998. This feature had disintegrated by early November in 1998, while it persisted to mid-December in 1999. Such variability may have important implications for regional air-sea-ice and biota interactions (e.g. the breeding success of penguins), and may affect the role of the polynya as a major site of water-mass modification and formation, which is of global significance.
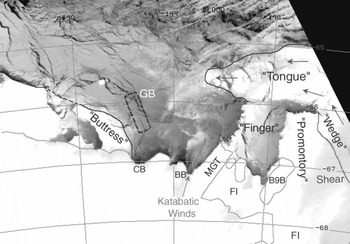
Fig. 8. AVHRR channel 4 image from 17 july 1998 (0639 UTC). note the onset of the westward "tongue" advance, while winds are largely from the southwest.
Conditions in October 1963
A comparison has been carried out with conditions in October 1963, as seen in declassified ARGON photoreconnaissance satellite imagery (Fig. 9). Although there are detailed differences, such as a narrower Buchanan Bay in 1963, the overall ice morphologies in 1963 and 1999 (Fig. 6) are very similar. The polynya was also present in 1963, as was the "buttress", MGT (although its outline is difficult to distinguish accurately), the breaking-up "finger", and the smaller polynya in the fast-ice "embayment" between MGT and the "wedge". To the east of MGT, the fast-ice "wedge" and its eastern shear boundary bear a striking resemblance to the same features present in 1999. Again, the region to the east can be seen as a supplier of thick ice. Image enhancement of subtle shadowing on this promontory suggests that it was largely composed of fast ice in 1963 rather than a more advanced Ninnis Glacier tongue, the latter having been suggested by Reference Wendler, Ahlnas and LingleWendler and others (1996). This implies that similar patterns of grounded icebergs were present 36 years ago, and that these played an equally important role in the formation of blocking features and the build-up and supply of thick ice from the east and, ipso facto, an equally important role in determining the behaviour of the polynya. An important difference is the absence of Iceberg B9B in 1963, which only grounded in its current position in June 1992 (Reference KeysKeys, 1994).

Fig. 9. A composite visible image of two scenes of the MGP region collected by the argon satellite, 29 october 1963. spatial resolution is ∼140 m. wendler and others (1996) suggest that the mertz glacier terminus advanced by about 26 km between 1964 and 1993, whereas ninnis Glacier retreated by about 20 km from 1962 to 1993 cf, cape freshfield.
Conclusion
This observational account has shown that the behaviour of the MGP is the result of a combination of complex processes and phenomena that are largely remote from the polynya itself yet still exert a considerable influence. While showing that strong winds associated with synoptic and katabatic systems are instrumental in initially opening the polynya, it has highlighted the importance of fast-ice and grounded iceberg distributions to both the east and west, and the role played by a compact zonal stream of thick ice and broken-out fast ice drifting to the north. Such processes are site-specific and therefore not currently parameterized in high-resolution polynya models (e.g. Reference Willmott, Morales Maqueda and DarbyWillmott and others, 1997). By these processes, regional sea-ice dynamics have a considerable impact on ice thermodynamics in the polynya and beyond, particularly when a break-out event to the east of the MGP coincides with a large outgrowth of the "buttress" to the west. This study has also shown that significant fast-ice break-out events occur in winter, and has identified a smaller polynya ∼ 70 km to the east.
Coastal latent-heat polynyas are often described as the "ice factories" of the Antarctic pack, as ice production rates in them can be significantly greater than for adjacent ice-covered regions (Reference LytleLytle and others, 2001). In the case of the MGP, this role may be greatly modified by periodic closures of the open-water area by "back-filling", which may result in a lower total annual ice growth than otherwise expected. Polynya behaviour is profoundly influenced by the presence of the "tongue" and "buttress", from February-March to November and from April-May to November-December, respectively. Only late in the season (after mid-October) do relatively unrestricted outflow conditions of ice formation and removal occur.
On decadal time-scales, the implications are intriguing. While similar conditions may have prevailed over at least the last 37 years, much depends upon the configuration of the coastline and the distribution of grounded icebergs related to iceberg calving locations and rates. Were the "wedge" to diminish in its northward extent, the resultant more southerly advection of thick ice from the east might be sufficiently forceful to modify or destroy the "finger" and potentially almost halve the net size of the MGP (although the build-up of the "wedge" and its role as both a supplier and creator of thick ice floes might be diminished). Moreover, the more southerly presence of the "tongue" might greatly affect the ability of the polynya to open due to severe back-filling. Significant calving from MGT might also dramatically alter conditions in the MGP.
Little is currently known about long-term changes in iceberg-discharge rates, which would affect the grounding distribution of bergs and subsequently fast-ice extent. Improved information on bathymetry is also required, a difficult proposition given the impenetrable nature of the ice cover to the east of Mertz Glacier. It is clear that we need to develop a significantly better understanding of the complex processes affecting polynyas under present-day conditions in order to better understand their long-term role in the global climate system, and their potential response to global change. A detailed follow-up study is in progress to analyze interannual variability using longer-term satellite and other data, and to identify sites of fast-ice break-out, quantify their magnitude and determine causal effects. Future research will focus on changes in the coastal configuration and fast-ice and grounded-iceberg regimes, and how these have affected the polynya regime.
Acknowledgements
The authors are very grateful to Captain Pearson and the crew of R/V Aurora Australis, and helicopter crews. The AVHRR data were collected at Casey station by Australian Bureau of Meteorology (BoM) personnel, and we thank K. Shepherd, S. Pendlebury, N. Adams and K. Jacka (all of BoM) and N. Young and G. Hyland (Antarctic CRC) for their excellent help. SAR analysis was carried out with the help of B. Giles (Antarctic CRC). Grateful thanks are due to the two reviewers, C. Geiger and T. Markus. RADARSAT imagery was supplied by the Alaska SAR Facility, via an agreement with NASA. ARGON imagery was obtained from the U.S. Geological Survey Earth Resources Observation Systems (EROS) Data Center. NCEP charts were provided by the U. S. National Oceanic and Atmospheric Administration-Cooperative Institute for Research in Environmental Sciences (NOAA-CIRES) Climate Diagnostics Center, Boulder, CO, from their website at http://www.cdc.noaa.gov/.


