


1. Introduction
Cyber physical production systems (CPPS) are complex, interconnected, intelligent and innovative product-service systems that require iterative processes and cross-disciplinary as well as cross-company cooperation in all phases of project realisation. Appropriate cooperation, that is, efficient information exchange between multiple interdisciplinary teams, is therefore crucial for the result of the project as inappropriate cooperation may cause delays, cost overruns and quality problems (Vogel-Heuser et al. Reference Vogel-Heuser, Böhm, Brodbeck, Kugler, Pantförderer, Zou, Buchholz, Bauer and Lindemann2020a). Further impeding this challenge, machines and plants as parts of CPPS may operate for more than 30 years and often evolve already during the commissioning and start-up phases deviating from the as-built documentation of the supplier/contractor team (Birkhofer et al. Reference Birkhofer, Wollschlaeger, Schrieber, Winzenick, Kalhoff, Kleedörfer, Mühlhause and Niemann2012).
Appropriate communication and a collective mindset among multiple teams or organisations are required to achieve the efficiency and effectiveness of collaborative engineering, and take an important role, accordingly, for making strategic decisions in the CPPS engineering process. Thus, providing information covering such various aspects from multidisciplinary engineering environment would be beneficial for decision-making to consider multiple perspectives.
The Business Process Model and Notation for Innovation (BPMN+I) (Vogel-Heuser et al. Reference Vogel-Heuser, Brodbeck, Kugler, Passoth, Maasen and Reif2020b) was introduced as a combination of workflow models using an enlarged BPMN and a table-based assessment, often applied for comparison of multiteam and organisational decisions by human resource or management departments. In this article, we propose, at first, a direct integration of multiteam and organisational aspects into the graphical notation. Secondly, we include empirical and historical findings to ensure the validity of the well-established subjective expert ratings. Consequently, we propose BPMN++ with eight new notational elements, two subdiagrams, and an adjusted weighting system that enable the modelling of the evaluated cooperation aspects and thus replace the evaluation tables of the BPMN+I. Furthermore, BPMN++ notation enables quicker identification of relevant data and provides a uniform notation, a more compact presentation, and easier modifiability from an engineerings point of view. A formalised description is provided as meta model to increase clarity. We also include a first set of empirical studies and historical qualitative and quantitative values in addition to subjective expert-based ratings to increase validity. We select a short-term decision in the start-up phase of CPPS as a use case, according to Vogel-Heuser et al. (Reference Vogel-Heuser, Fay, Schäfer and Tichy2015): a physical part of a CPPS is changed to fix a design bug due to unknown requirements like temperature, humidity or even the raw materials used. This change requires an adaptation of inherent involved software as a workaround because the mechanical solution is not feasible to be made on short notice, and therefore, interdisciplinary collaboration is needed. The selected use case is especially valuable for evaluating our approach, since the commissioning and start-up phase is one of the most complex and critical phases in plant engineering and may affect the outcome of the entire project (Cagno, Caron & Mancini Reference Cagno, Caron and Mancini2002). Commissioning describes the general process of setting up the plant while the use case within this article focusses on establishing the functionality of the plant in the start-up phase.
This article is structured as follows. After summarising the state of the art in modelling organisational, team-wise and systems design aspects in CPPS design and operation in Section 2, we introduce the proposed notation for the integration of multiteam and organisational aspects in Section 3. In Section 4, we introduce and compare models of two alternative solutions (workflows) for a short-term management decision in the start-up phase of CPPS using BPMN++. In Section 5, we rate the two alternative solutions for the use case using the BPMN++ models and evaluate the rating and assessment procedure itself. Section 6 provides a conclusion and outlook for future work.
2. State of the art in integration of organisational, team and systems engineering aspects in CPPS design and operation
As the state of the art needs to address all three aspects, that is, multiteam, organisational and systems engineering aspects of CPPS, we give a short introduction and refer to our already published survey papers, for example, Vogel-Heuser et al. (Reference Vogel-Heuser, Böhm, Brodbeck, Kugler, Pantförderer, Zou, Buchholz, Bauer and Lindemann2020a,Reference Vogel-Heuser, Brodbeck, Kugler, Passoth, Maasen and Reifb), which provide a broader overview of the different views.
Modelling interdisciplinary systems design with additional consideration of multiteam systems (MTS) and organisational aspects poses a challenge since different modelling techniques and tools are used to describe technical, psychological and sociological aspects of the system. MTS are complex sociotechnical systems (DeChurch & Zaccaro Reference DeChurch and Zaccaro2010) consisting of ‘networks of interdependent teams that coordinate at some level to achieve (…) [their] goals’ (Zaccaro et al. Reference Zaccaro, Dubrow, Torres and Campbell2020, p. 479). Interdependencies refer to individuals within teams, teams within the system and the system with external constituencies (DeChurch & Zaccaro Reference DeChurch and Zaccaro2010). Organisations increasingly rely on working in systems in order to address challenges such as globalisation, increasing dependencies, a complex and dynamic environment, as well as the continual need for innovation and flexibility. Multiteam system performance depends not only on the quality of cross-team coordination and leadership (e.g., Hoegl, Weinkauf & Gemuenden Reference Hoegl, Weinkauf and Gemuenden2004; Marks et al. Reference Marks, DeChurch, Mathieu, Panzer and Alonso2005), but also on emergent states such as trust and openness between teams and team members (DeChurch & Zaccaro Reference DeChurch and Zaccaro2010; Shuffler, Jimenez-Rodriguez & Kramer Reference Shuffler, Jimenez-Rodriguez and Kramer2015).
As the use of different models often leads to inconsistencies, Bordeleau et al. (Reference Bordeleau, Combemale, Eramo, van den Brand and Wimmer2018) propose a tooling infrastructure to support tracing links between heterogeneous models in order to enable cross discipline coupling of models in a language-oriented way. The authors are interested in the organisational relations or the relations created via workflow dependencies in product development, but not in the modelling of team aspects like trust or organisational aspects like the distribution of workflow to different companies. To avoid the issue of disparate models, Fleischmann et al. (Reference Fleischmann, Schmidt, Stary, Obermeier and Börger2012) propose a Subject-oriented Business Process Management (S-BPM) that considers agents in an organisational environment. They provide a framework for executing different behaviour models without transforming them into a specific model language. However, they do not take into account Model-Based Systems Engineering (MBSE) approaches and the required coupled tool support to ease cooperation between teams and disciplines, which is mandatory for our approach. Hassannezhad & Clarkson (Reference Hassannezhad and Clarkson2018) focus on decisions made in such networks and address the propagation, especially of management decisions, with consideration of organisational dynamics. They developed a conceptual framework that enables modelling of a decision network in order to understand the criticality and consistency of decisions, but did not consider engineering workflow aspects. To support the modelling of heterogeneous workflows on different hierarchical levels, Kozma, Varga & Larrinaga (Reference Kozma, Varga and Larrinaga2019) propose a notation that merges the BPMN and Coloured Petri Nets (CPN) into one model that is fitted into the service-oriented architecture of the developed arrowhead framework (Arrowhead Framework 2020). However, they do not take into account the influence of MTS and organisational aspects. Recently in the UK and US, a SysML based MBSE approach and its documentation [Unified Profile for DoDAF/MODAF – UPDM, Object Management Group (OMG1) 2017] is mandatory for defence products. UPDM supports modelling of organisational aspects using SysML activity diagrams yet lacks some of the organisational and all multiteam aspects, which are included in our approach and highlighted in the following.
Vogel-Heuser et al. (Reference Vogel-Heuser, Fay, Schäfer and Tichy2015) describe an evaluation scenario, in which physical parts of a plant are changed. These changes require an adaptation of software and, therefore, an interdisciplinary collaboration. In the following, a workflow that requires a collaboration of two or more teams with information and/or material exchange is called a cooperation process. In order to assess the feasibility and effectiveness of cooperation processes with several actors, Vogel-Heuser et al. (Reference Vogel-Heuser, Brodbeck, Kugler, Passoth, Maasen and Reif2020b) proposed the enriched notation BPMN+I based on the BPMN 2.0 collaboration diagram Object Management Group (OMG2) 2014], which allows the modelling of cooperation processes under consideration of psychological and sociological aspects. For this purpose, a connection element (so-called ‘cooperation arrow’) was introduced as a new notation element to two or more processes (usually performed by different teams or companies) that are carried out in cooperation. Based on this, checklists were introduced with which various technological, team and inter-team and organisational aspects of the respective interaction could be evaluated (Vogel-Heuser et al. Reference Vogel-Heuser, Brodbeck, Kugler, Passoth, Maasen and Reif2020b, Table 1). This approach turned out to be helpful, for example, for the evaluation of two alternative workflows. However, the use of checklists requires to handle two different data sources, including the different model types and corresponding documents that might be inconsistent. Especially handling them is harder in the case of a change in one of the workflows as they are not integrated or coupled systematically. Furthermore, tool-support is missing. Additionally, the evaluated cooperation aspects are not directly visible in the diagram but have to be traced just in the checklists. In Section 3, we demonstrate, how adjustment, made necessary by such changes is realised, and how historical and empirical data are integrated into the model to decrease subjectivity.
Table 1. Basic elements of the cooperation diagram

2.1. Empirical findings regarding factors affecting MTS performance
In the following, empirical findings in psychology regarding effective MTS functioning, which can be used to rate different MTS-related and organisational aspects in the BPMN++, are introduced.
Besides behaviours and processes such as leadership, coordination and communication, which have been mainly studied in the context of MTS functioning (Shuffler, Jimenez-Rodriguez & Kramer Reference Shuffler, Jimenez-Rodriguez and Kramer2015), emergent states have been neglected in MTS analysis. However, due to their impact on subsequent behaviours and processes, emergent states such as trust and shared mental models drive effective MTS functioning, both within and across MTS levels. Trust and commitment in MTS may be especially important among MTS leaders (Shuffler, Jimenez-Rodriguez & Kramer Reference Shuffler, Jimenez-Rodriguez and Kramer2015). Trust facilitates MTS collaboration (Vogel-Heuser et al. Reference Vogel-Heuser, Brodbeck, Kugler, Passoth, Maasen and Reif2020b), whereas distrust across teams harms system-level performance, as “teams will over-monitor one another to the detriment of MTS goals” (Shuffler, Jimenez-Rodriguez & Kramer Reference Shuffler, Jimenez-Rodriguez and Kramer2015, p. 29). Shuffler et al. further elaborate that MTS with prior interaction may have fewer difficulties in establishing trust. Moreover, MTS that are very large may face more challenges in establishing shared mental models compared to smaller MTS. Mental models are organised knowledge structures that help individuals to describe, explain and predict events in their environment (Mathieu et al. Reference Mathieu, Heffner, Goodwin, Salas and Cannon-Bowers2000). Shared mental models allow team members to draw on their own well-structured knowledge as a basis for selecting actions that are consistent and coordinated with those of their teammates (Mathieu et al. Reference Mathieu, Heffner, Goodwin, Salas and Cannon-Bowers2000, p. 274). Shared mental models can include models of task (e.g., task procedures and strategies), technology (e.g., equipment, operating procedures and system limitations), team interaction (e.g., roles, responsibilities and communication channels) or the team (e.g., teammates’ skills, attitudes, preferences and knowledge) (Mathieu et al. Reference Mathieu, Heffner, Goodwin, Salas and Cannon-Bowers2000). According to prior work (Vogel-Heuser et al. Reference Vogel-Heuser, Böhm, Brodbeck, Kugler, Pantförderer, Zou, Buchholz, Bauer and Lindemann2020a) common understanding among all teams within the MTS (i.e., shared mental model) is emerging about important issues of the MTS like shared mental model of processes in the MTS (e.g., how is work conducted in the MTS? mentioned 20 times by 9 interviewees) and a shared mental model of partners in the MTS (i.e., who in the MTS is doing what with which goal?).
In our work, we focussed on trust as effective emergent state and on shared mental models as cognitive emergent states because these two factors have been empirically supported to foster MTS functioning (Zaccaro et al. Reference Zaccaro, Dubrow, Torres and Campbell2020). Moreover, to be more precise on what is meant by shared mental models, we added a definition which includes both technical and psychological aspects.
Integrating psychological findings on MTS emergent states into a graphical notation of the systems engineering workflow will provide more elaborated descriptions of MTS and their characteristics, and enrich the quality and predictive power of technical descriptions by the consideration of the actors’ psychological states. Whenever empirical findings for selected aspects of the MTS evaluation are available, they should be incorporated instead of purely subjective ones gained by expert evaluation. Consequently, empirical findings need to be added as notational elements.
2.2. Empirical findings regarding factors affecting organisational structures
Empirical studies in organisational research, specifically in organisational sociology, have focussed on establishing a ‘microfoundation’ (Powell & Colyvas Reference Powell and Colyvas2008) of organisational and institutional theory. This foundation highlights that in organisational practice or ‘institutional work’ (Lawrence Reference Lawrence2006), a formal organisational structure is only one aspect that members of organisations use to coordinate both cooperation and competition within and between organisational boundaries. Most of the empirical research has been on the microfoundation of intra-organisational structures and inter-organisational relations in cases of higher education, in and between companies and institutional actors such as standardisation bodies, trade and inter-trade organisations or regulators. Empirical studies on interdisciplinary engineering practice and technical decision-making are still rare compared to decision-making in other application areas such as management in the frame of Industry 4.0 (Meyer, Schaupp & Seibt Reference Meyer, Schaupp and Seibt2019) or in the field of Empirical Software Engineering (Fernandez & Passoth Reference Fernandez and Passoth2019). Formalising existing studies in other application areas can help to extend their scope and to identify relevant gaps regarding decision-making in interdisciplinary engineering.
When competing companies collaborate, there often appear competitions in the meantime of collaboration, which facilitate and support innovation (Ritala, Kraus & Bouncken Reference Ritala, Kraus and Bouncken2016). However, this includes challenges such as tensions in cooperation between different actors, which need to be managed properly to reach desired results. Thereby, specifically stakeholders with cooperation experience can profit by gaining knowledge and capturing value from the cooperation (Bouncken & Friedrich Reference Bouncken and Friedrich2016). Research has shown that cooperation is also supported (or hindered) by shared memberships (or the lack thereof) between organisations in inter-organisational institutions (in this article: equal to inter-companies) or ‘meta-organisations’ (Garaudel Reference Garaudel2020), such as sectoral coordinating bodies, consortia or unions. While contracts or binding legal regulations always carry the risk of being broken or circumvented in practice, the empirical research on personal relationships between members of different organisations has shown that they play a decisive role in helping organisations trust each other by creating and carefully supporting existing interpersonal networks (Kroeger Reference Kroeger2012). Such mixtures of formal and informal coordination create helpful and effective forms of ‘partial organisation’ (Ahrne & Brunsson Reference Ahrne and Brunsson2011) where some mechanisms and practices of formal organisations are implemented, while others are missing. This can alter the flexibility, as informal operations increase with more personal relationships. If a formal agreement is in place in between two companies, stakeholders from both companies can act in a clearly described frame and have a better understanding of the accountability of each partner. This does not hinder companies to act against a formal agreement, but the status of the agreement set the stage for further handling resulting disputes. Integrating selected organisational mechanisms into BPMN++ will help mapping and understanding the role of such partial organisations in decision-making processes in engineering. Another important aspect for successful collaboration is the ability and experience of stakeholders to adapt their work style and communication to heterogeneous partners as well as to partners with diverse cultural backgrounds. This does not only include cultural diversity in the sense of actors and stakeholders from different countries or geographical regions (Winkler & Bouncken Reference Winkler and Bouncken2011), but also in the sense of work cultures, innovation cultures or organisational cultures (Calhoun & Sennett Reference Calhoun and Sennett2007).
2.3. Historical post calculation data to evaluate MTS and organisational aspects
Several approaches estimating project and change costs to support decision-making are introduced in the following. Cost Model (COCOMO) II (Boehm et al. Reference Boehm, Abts, Brown, Chulani, Clark, Horowitz, Madachy, Reifer and Steece2000) estimates costs using several approaches based on function points and cost drivers. Function point analysis (Dreger Reference Dreger1989) estimates the size of a system by adding up the number and weights of all transaction and data elements and compares these indicators to already finished projects and their costs (post calculation). Additionally, architecture-based change impact analysis exists for cross-disciplinary classical software systems, for example, Karlsruhe Architectural Maintainability Prediction (KAMP) as well as automated production systems, for example, KAMP4aPS (Heinrich et al. Reference Heinrich, Koch, Cha, Busch, Reussner and Vogel-Heuser2018). Schmied et al. (Reference Schmied, Gebhardt, Mörtl and Lindemann2017) describe an approach to analyse indirect costs of engineering changes. Such changes can lead to ripple effects, that is, they propagate through the whole chain of the workflow. All these approaches lack to include MTS or organisational aspects and mostly focus on technical aspects.
3. Concept of the integrated graphical notation BPMN++
In the following, we will introduce our BPMN++ approach that is based on BPMN+I (Vogel-Heuser et al. Reference Vogel-Heuser, Brodbeck, Kugler, Passoth, Maasen and Reif2020b) and enriched by the following aspects:
(i) The specification of the eight newly added and already existing notational elements and their appropriate usage is formalised as a meta model to avoid ambiguity (Section 3.5, Figure 4).
(ii) The organisational and MTS evaluation criteria are integrated into the notation itself, resulting in additional notational elements to be embedded in the cooperation process and inter-process interactions (Table 3).
(iii) The notation is split into two diagrams: one to express the cooperation processes and the psychological aspects [called as ‘cooperation diagram’ (Section 3.1)] and the other for the stakeholder aspects, including the organisational aspects [called as ‘network of actors’ (Section 3.2)].
(iv) A source of rating is added to differentiate weights and ratings from empirical or historical post calculation data and/or subjective ratings by experts (Section 3.3).
(v) In order to enable a clearer differentiation in the evaluation of alternatives with different ratings, the weighting for the three rating levels is adapted to a nonlinear manner (Section 3.4).
(vi) A quantitative assessment procedure (cp. Figure 3) is proposed that additionally considers tool-coupling, data backbone and time to include the maximum allowed workflow duration in the evaluation (Section 3.4).

Figure 1. Depiction of the BPMN++ modelling of a cooperation process with two involved actors from different companies.

Figure 2. Notational element for type of rating in both cooperation diagram and network of actors.
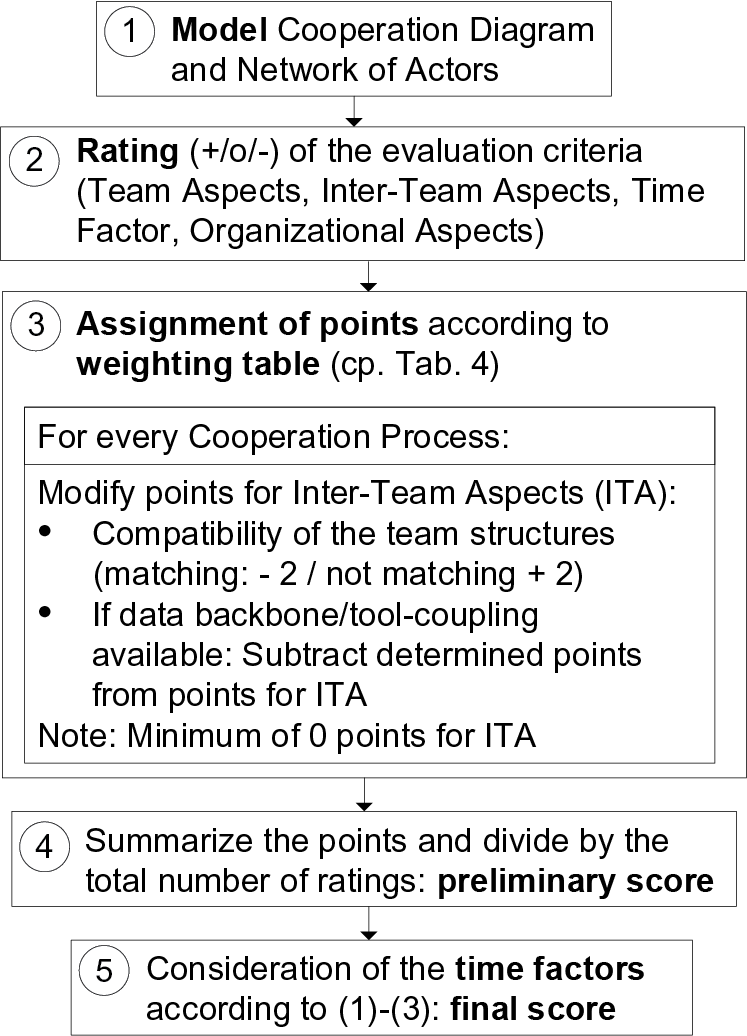
Figure 3. Procedure for the quantitative assessment of workflows [step 5 refers to Eqs. (1)–(3) within this section].
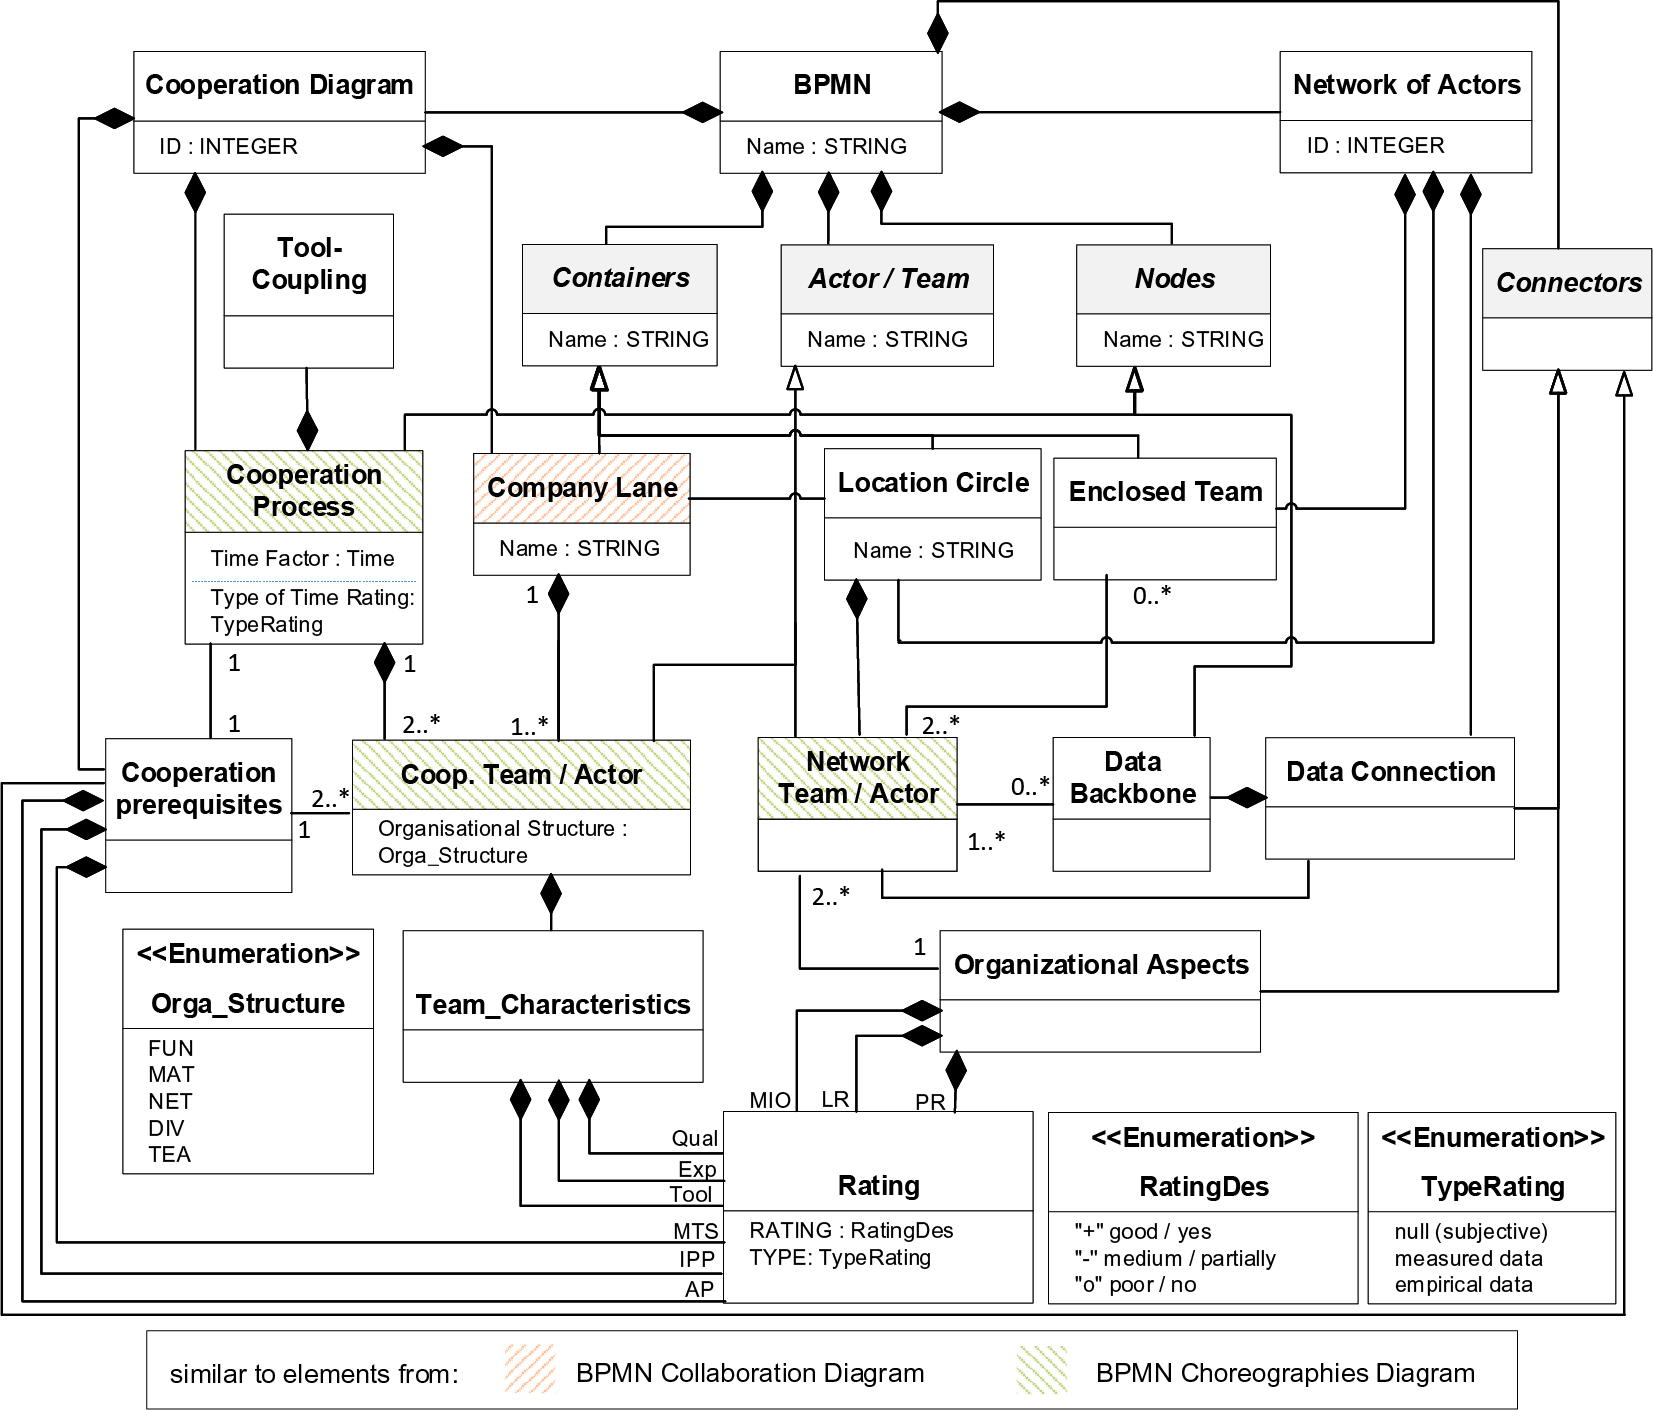
Figure 4. UML class diagram representing the meta model for the elements in the proposed submodels of the BPMN++ notation (note: TypeRating measured data refers to postcalculation data from prior projects).
Table 2. Basic elements in the network of actors – hatching added for clarity only
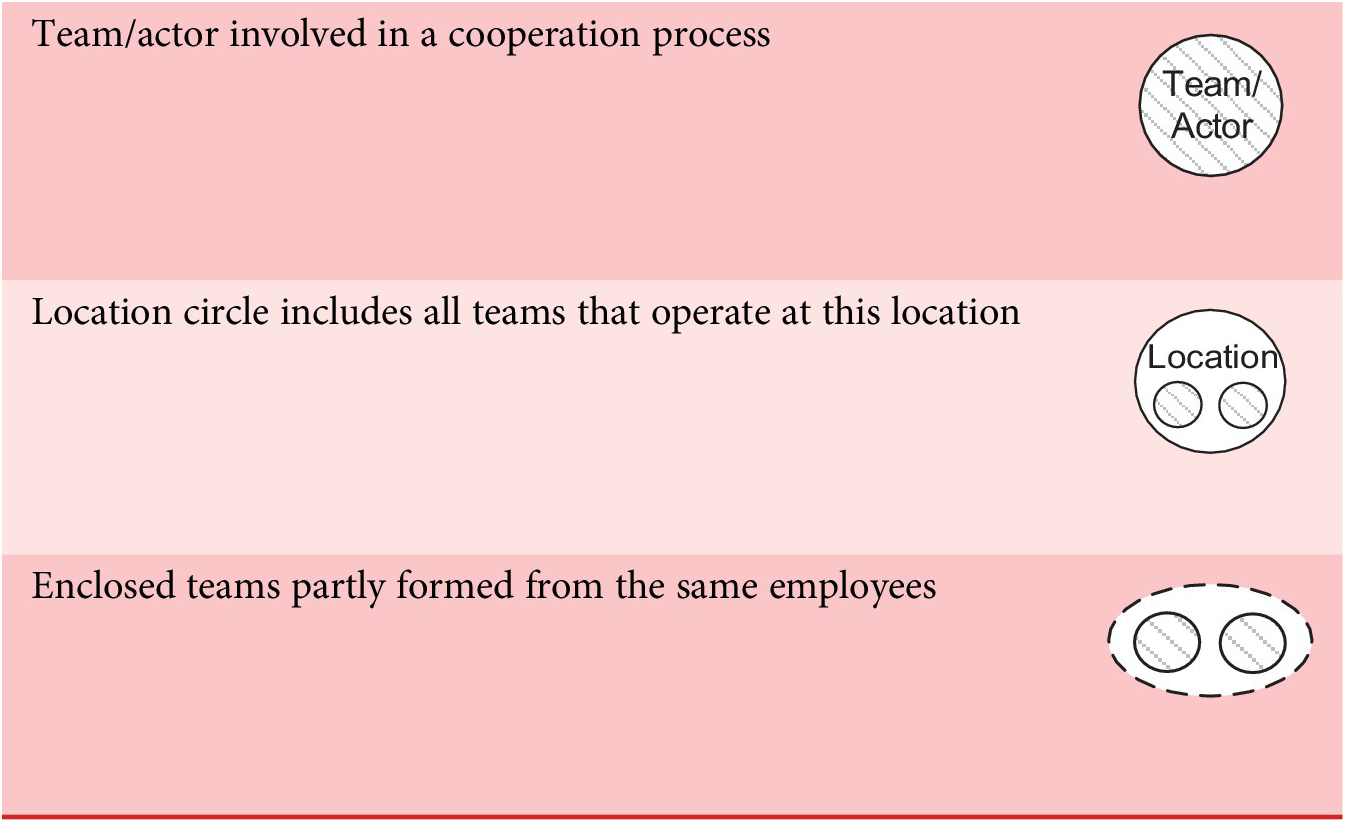
Table 3. Notation elements for enriching the cooperation diagram and the network of actors
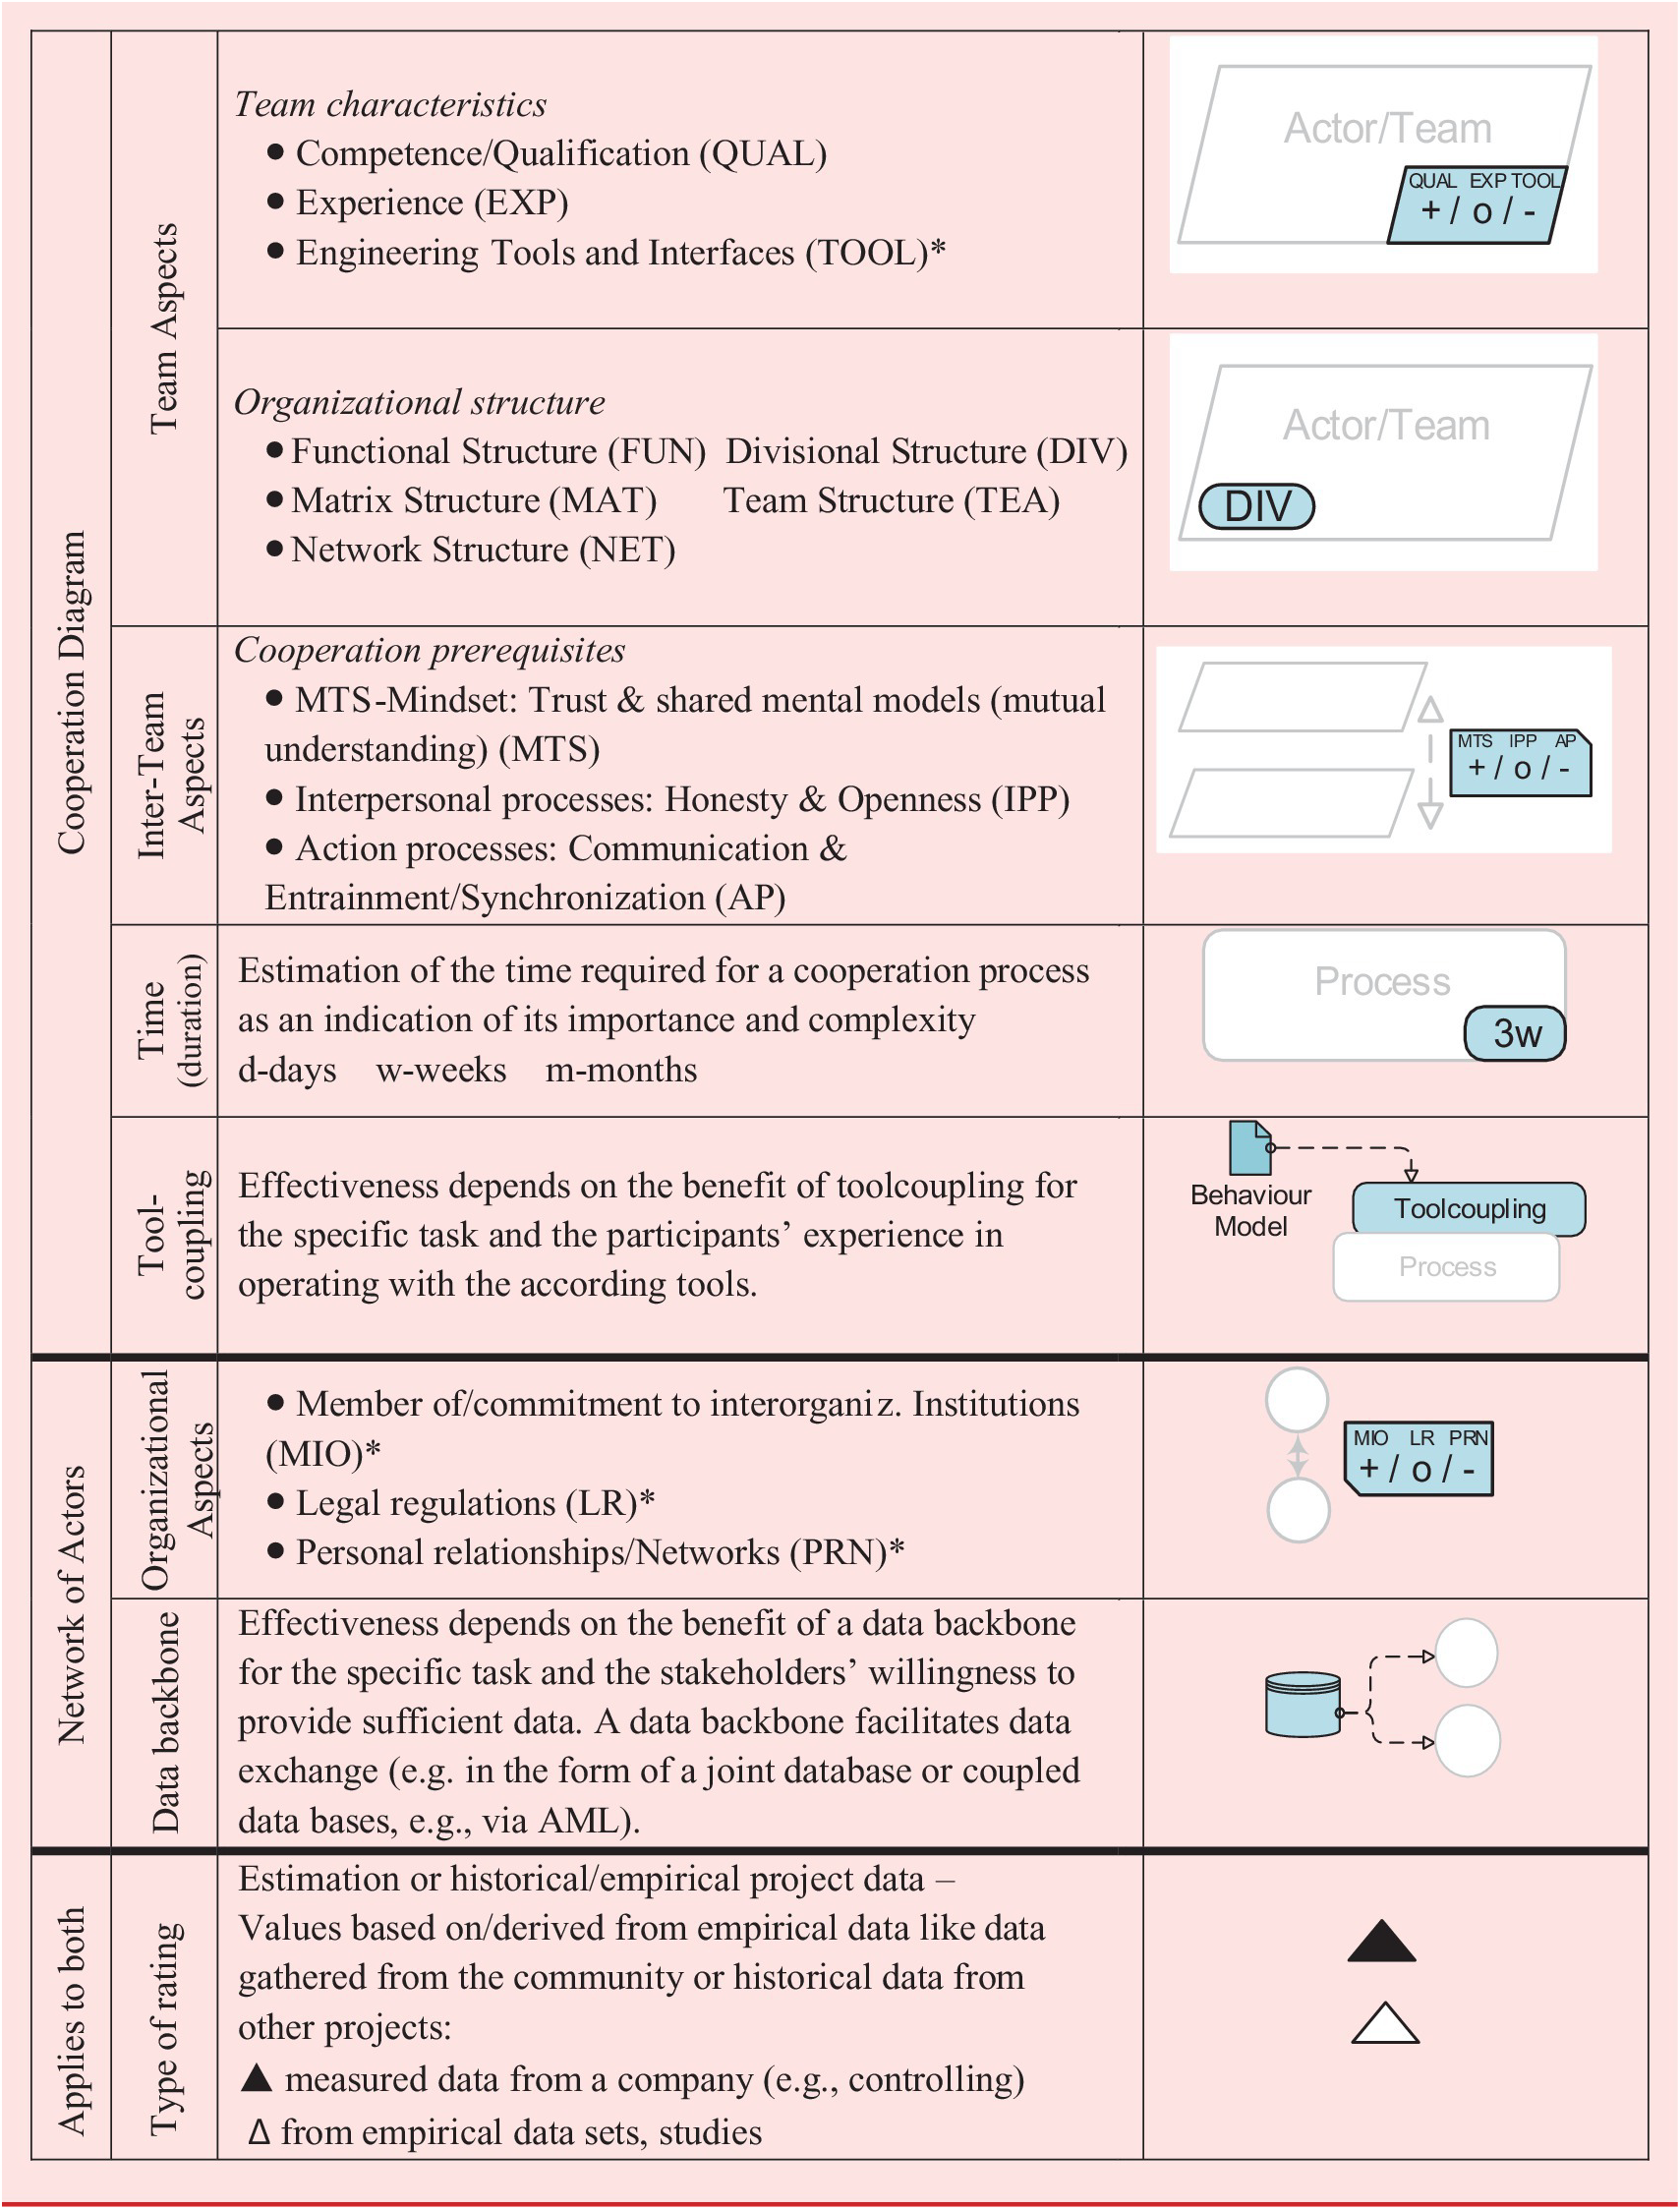
For clarity, the newly introduced elements for information enhancement are highlighted blue. If no further explanation is given, the evaluation criteria are rated ‘+’ (good), ‘o’ (medium) and ‘−’ (poor). If marked with *, evaluation criteria are rated ‘+’ (yes), ‘o’ (partially) and ‘−’ (no).
3.1. Cooperation diagram
The design of the Cooperation Diagram is based on the BPMN 2.0 choreography diagram [Object Management Group (OMG2) 2014]. This focusses on a sequence of concrete interactions between the involved partners and does not consider the internal behaviour of them. In our approach, these interactions correspond to the cooperation arrows in the BPMN+I diagram. We propose to enrich the sequence of interactions by adding visual information in the Cooperation Diagram to describe team qualities and MTS performance further.
Basic structure of the cooperation diagram
In our proposed BPMN++ approach, we adapt the standard notation of the BPMN choreography diagram; instead of modelling the cooperation process and associated teams as a ‘coherent block’, we separate cooperation processes and teams and model them with individual elements. In addition, we introduce lanes representing companies analogous to the BPMN 2.0 collaboration diagram [Object Management Group (OMG2) 2014] or SysML activity diagram. Teams/actors belonging to one company are assigned to the corresponding lane (cp. Figure 6, left side with the lanes ‘company G’, ‘company B’, and ‘supplier U2’ enclosing associated teams involved in cooperation processes). A cooperation process (Figure 1 and Table 1) corresponds to the cooperation that results from two or more technical processes in the BPMN+I diagram, which are performed in cooperation of different teams. In the cooperation diagram, these technical processes are combined to one cooperation process, which is named accordingly.
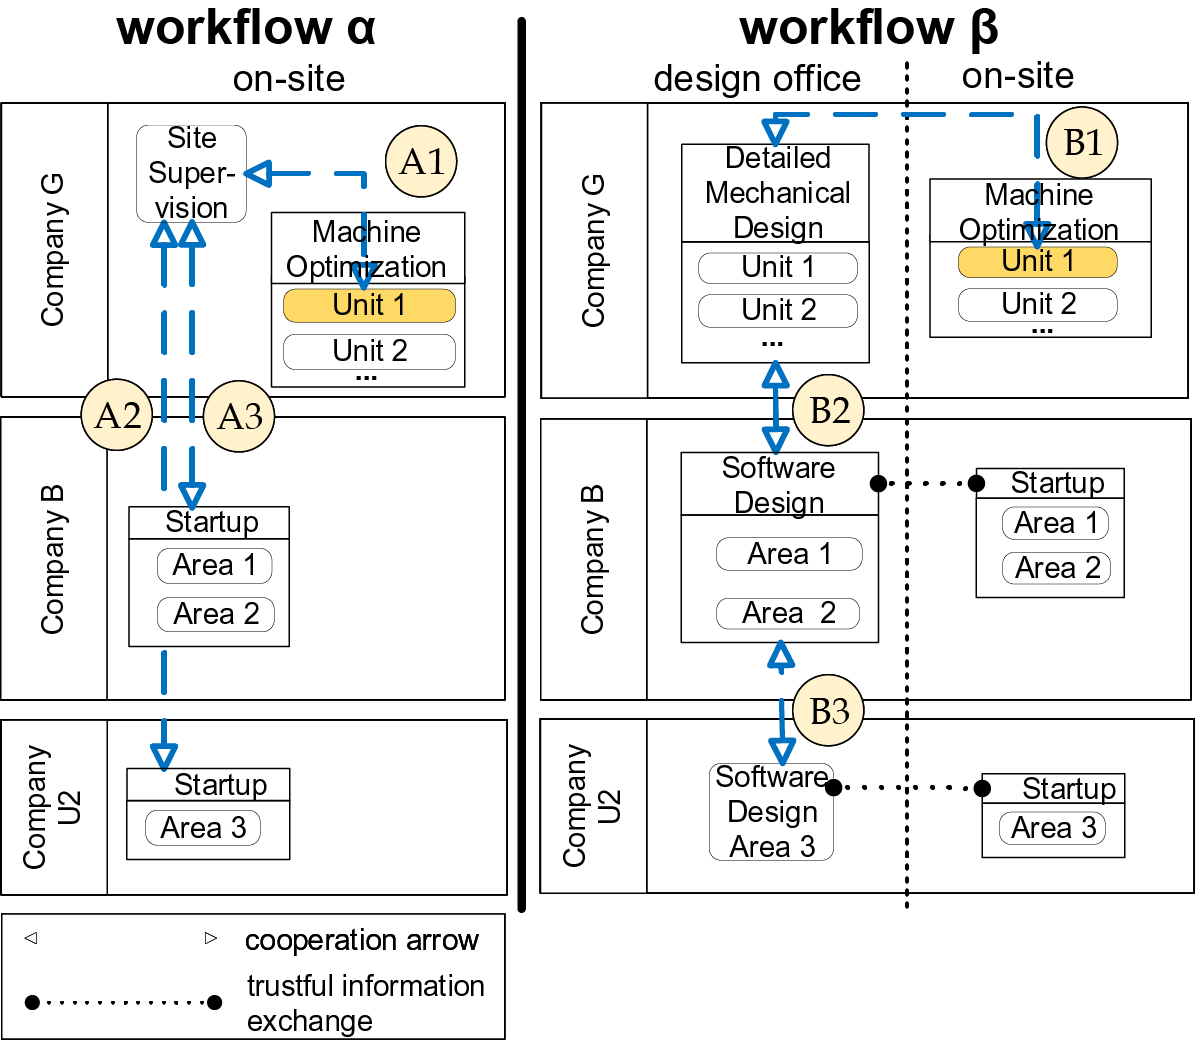
Figure 5. Modelling the cooperation of the two alternative solutions in BPMN with BPMN+I extension (blue arrows): software change on-site ( $ \alpha $, left), software change in design office ( $ \beta $, right) (excerpt from Vogel-Heuser et al. Reference Vogel-Heuser, Brodbeck, Kugler, Passoth, Maasen and Reif2020b, Figure 5).
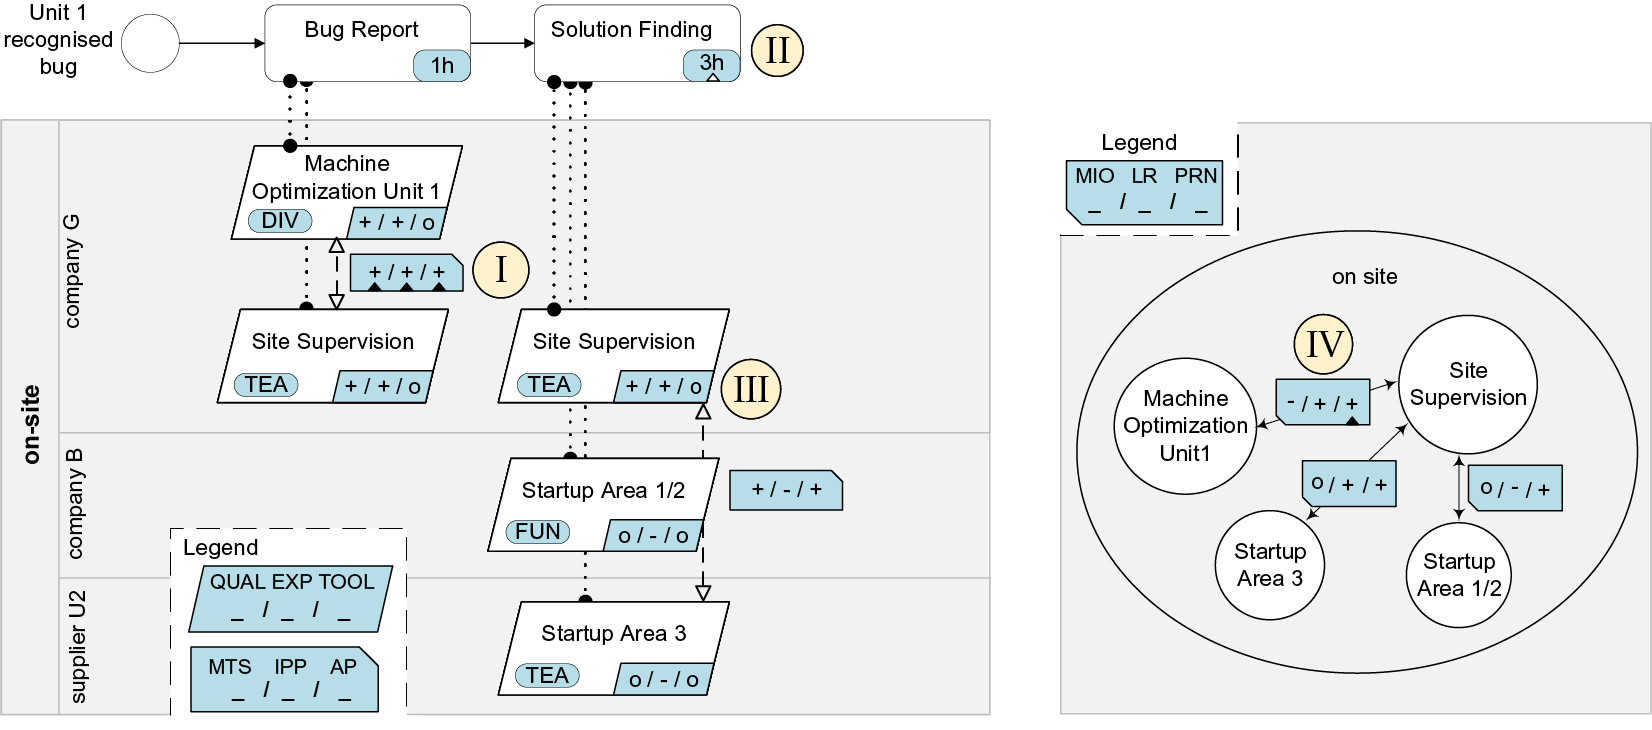
Figure 6. Software change on-site (workflow  $ \alpha $): Cooperation Diagram (left) and Network of Actors (right).
Related cooperation processes and teams/actors are connected with a dotted line (Figure 1). The teams/actors are positioned below their related processes. Also, all teams are assigned to the pool lane that corresponds to their associated company.
Enrichment of the cooperation diagram
In order to include the technological and psychological aspects (cp. Vogel-Heuser et al. (Reference Vogel-Heuser, Brodbeck, Kugler, Passoth, Maasen and Reif2020b), Table 1, tool/technological support and psychological aspects), the Cooperation Diagram is enriched with five notational elements (Table 3, Cooperation Diagram) addressing team aspects, inter-team aspects (ITA), time and tools. The team aspects represent the cooperation criteria that can be applied to a team independently of the cooperation partners, for example, competence. Note that the evaluation of the team aspects for the same team can vary, since competence depends on the task assigned. Similarly, the ITA represent the evaluation criteria that result from the cooperation of two or more teams, such as communication, and depend on all partners involved. As introduced in Section 2.1, trust and shared mental models (mutual understanding) within the MTS as part of MTS-Mindset have been empirically validated and will be included in the notation with the abbreviation MTS. The time describes the estimated duration of a cooperation process. This allows management personnel to identify the complexity of a cooperation process indirectly and to model the required fulfilment of time constraints.
As appropriate tool support is essential for the successful cooperation in and between engineering teams and organisations (Friedl et al. Reference Friedl, Weingartner, Hehenberger and Scheidl2014; Dotoli et al. Reference Dotoli, Fay, Miśkowicz and Seatzu2019; Löwen et al. Reference Löwen, El Sakka, Schertl and Fay2020; Vogel-Heuser et al. Reference Vogel-Heuser, Böhm, Brodbeck, Kugler, Pantförderer, Zou, Buchholz, Bauer and Lindemann2020a), it should be explicitly modelled. As more tools are being used to exchange knowledge between teams, they need to be integrated or coupled to support such cooperation processes.
3.2. Network of actors
A second subdiagram, the Network of Actors, illustrates the inter-organisational relations between the companies involved in the cooperation processes. Thus, it allows for a quick overview of possible effects of inter-organisational relationships on cooperation between teams/actors from different companies. In the Network of Actors, all teams/actors are listed and assigned to the location graphically in which they are operating.
Basic structure of the network of actors
The basic elements of the Network of Actors are depicted in Table 2. If teams/actors from different companies work together at the same site, they are modelled within the respective location circle. Teams/actors, partly consisting of the same personnel, are marked to identify possible advantages of already existing personal networks in consecutive cooperation processes.
Enrichment of the network of actors
The Network of Actors is enriched with sociological evaluation criteria (cp. Vogel-Heuser et al. (Reference Vogel-Heuser, Brodbeck, Kugler, Passoth, Maasen and Reif2020b), Table 1, organisational aspects). For this purpose, sites whose associated teams/actors work together in a cooperation process are linked with a double-sided arrow and evaluated according to the criteria in the section ‘network of actors’ in Table 3.
Additionally, as a new notational element, a data backbone is to be modelled as it facilitates data exchange among the teams [e.g., in the form of a joint database or coupled databases, e.g., via Automation Markup Language (AML)]. The trust factor evaluates the openness of the involved teams/actors regarding data sharing. This trust factor indicates the extent to which a team/actor provides data to ensure maximum effectiveness of the cooperation process or the extent to which a team/actor restricts data sharing to protect its knowledge from the cooperation partners (Levin et al. Reference Levin, Cross, Abrams and Lesser2002).
3.3. Source of rating
To distinguish different sources (types) used as assessment basis for the rating of all blue elements (Table 3), a filled (black) or empty (white) triangle can be added. A filled triangle indicates the availability of historical data to support the rating of the respective evaluation aspect, whereas an empty triangle indicates underpinning by empirical data. In prior works, only a subjective rating by a group of experts was used (cp. Vogel-Heuser et al. (Reference Vogel-Heuser, Brodbeck, Kugler, Passoth, Maasen and Reif2020b)). For some of the MTS and organisational aspects, empirical studies (Sections 2.1 and 2.2) and/or historical postcalculation data (Section 2.3) are also available and can be used to ensure a more empirically validated rating. However, since this rating concerns the subjective evaluation of a psychological variable, judgement distortions can naturally never be completely excluded, but reduced by empirically validated and reliable judgement scales. As a tool for evaluation, such subjective ratings by different experts can even be used to map different assessments and, therefore, identify conflicts and potential controversies. Figure 2 depicts how the symbol is applied to the notation elements to indicate the source of the rating. In this context, available historical data are rated better than empirical data because they are more concrete, often quantitative and closer to the individual industrial use case. If both types of data exist, only the filled triangle for historical indexing data are used.
3.4. Enriched and adapted rating and procedure for the quantitative assessment of workflows
To make a quantitative comparison of the alternative workflows modelled in the BPMN++ (step ![]() , Figure 3), we calculate an overall score for each alternative based on the ratings (+/o/−) (step
, Figure 3), we calculate an overall score for each alternative based on the ratings (+/o/−) (step ![]() , Figure 3). For this purpose, the ratings are converted into points from a quantitative assessment procedure (step
, Figure 3). For this purpose, the ratings are converted into points from a quantitative assessment procedure (step ![]() , Figure 3). In order to obtain a meaningful total score at the end, it must be taken into account that the alternative scenarios can have a different number of cooperation processes/teams and, thus, a different number of ratings. Therefore, we propose to calculate the score by dividing the summarised number of points by the respective total number of ratings (step
, Figure 3). In order to obtain a meaningful total score at the end, it must be taken into account that the alternative scenarios can have a different number of cooperation processes/teams and, thus, a different number of ratings. Therefore, we propose to calculate the score by dividing the summarised number of points by the respective total number of ratings (step ![]() , Figure 3). Additionally, this reduces the influence of different modelling styles on the resulting score (e.g., a project may be modelled by one person with x, by the other with y processes). We further discuss the normalisation of the rating points in Section 5.2.
, Figure 3). Additionally, this reduces the influence of different modelling styles on the resulting score (e.g., a project may be modelled by one person with x, by the other with y processes). We further discuss the normalisation of the rating points in Section 5.2.
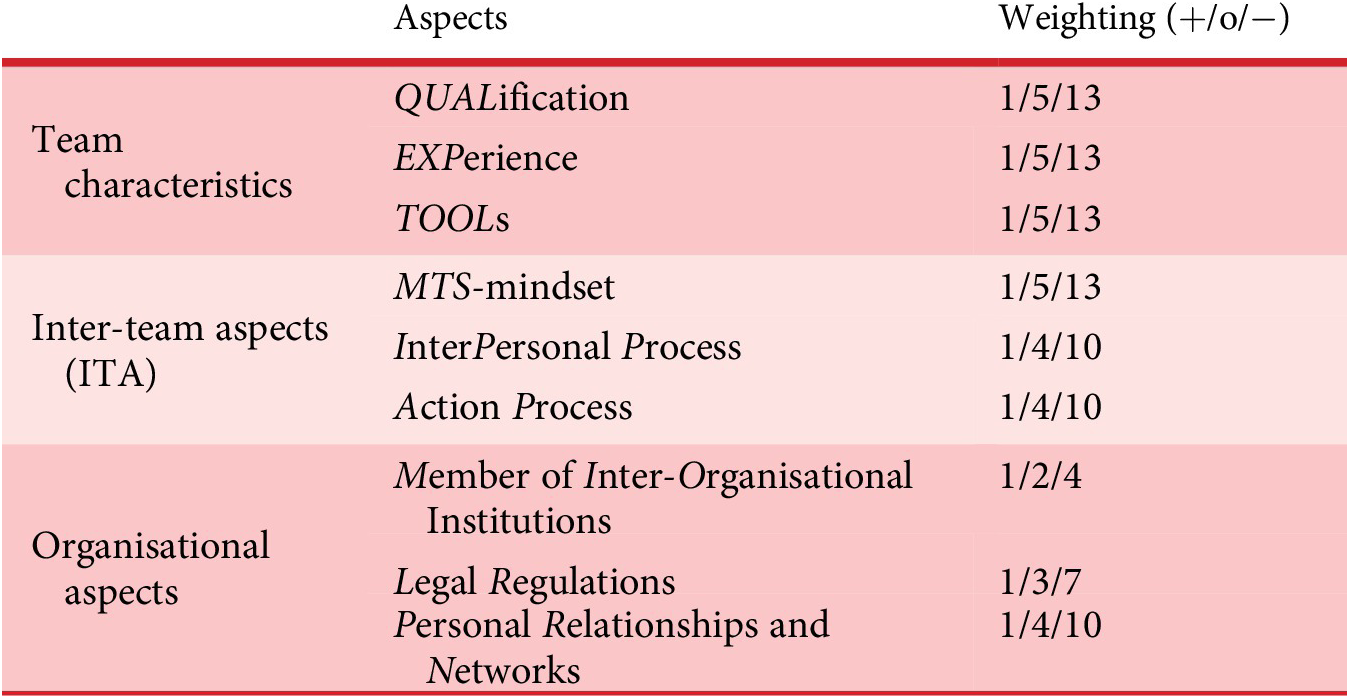
Since different evaluation aspects have varying degrees of impact on the success of the project, we introduce weighting schemes of the factors, which allows for prioritisation of certain aspects. These weightings must be empirically determined or estimated. It should be noted that small scores are correlated with a better evaluation. The best possible rating is represented as one, while average and poor ratings receive higher values than one (cp. Table 4). Critical aspects receive higher scores than noncritical aspects for average and poor ratings. Vogel-Heuser et al. (Reference Vogel-Heuser, Brodbeck, Kugler, Passoth, Maasen and Reif2020b), Table 1) proposed four different sets of weights for the three level scales (+/o/−). In order to enable a clearer differentiation in the evaluation of alternatives, the weighting for the three levels is, as proposed by industrial experts, carried out in a nonlinear manner (DIN 323-1 for example like a Fibonacci sequence, DIN 323-1:1974:08 1974), for example 1/2/4 for less critical aspects up to 1/5/13 for most critical aspects (cp. Table 4). To verify the plausibility of the selected weightings, we conducted an analytic hierarchy process (AHP) approach (Saaty Reference Saaty1990). This approach enables multicriteria decision-making and is, for example, often applied to socioeconomic operation decisions when both qualitative and quantitative factors need to be considered (Subramanian & Ramanathan Reference Subramanian and Ramanathan2012). By pairwise comparison of the influence of the aspects [applying the defined factors for intensity of importance (Saaty Reference Saaty1990, Table 1)], we calculated Priority Vectors from the resulting matrix. Compared to the normalised weightings of the medium-rated aspects from our approach, we obtained similar values. However, with the AHP approach, the nonlinear spreading effect can only be partially resembled.
Table 4. Weighting of evaluation criteria
Additionally to the evaluation criteria in Table 4, we propose to include tool-coupling, data backbone and maximum allowed duration for the workflow. Data backbone and toolcoupling are essential technical means to support and ease the design workflow and should consequently be included explicitly.
For a precise assessment, the ratings for data backbone and tool-coupling are each divided into two subcriteria with the weighting 2/1/0 for the options yes/partially/no. Because the benefit can only be reached if both subcriteria are fulfilled, the ratings of the respective subcriteria are multiplied, resulting in a range of 0–4 points. Since they lighten the cooperation effort, the points of data backbone and tool-coupling are to be subtracted from the ITA points of the respective cooperation process.
For the quantitative assessment of data backbone we propose the subcriteria:
(i) Whether using the data backbone is beneficial for the task.
(ii) Whether actors provide sufficient data for meaningful use of the data backbone.
And for tool-coupling we propose the subcriteria:
(i) The benefit for the task using tool-coupling.
(ii) The experience in tool usage.
Additionally, the compatibility of the team structures also affects ITA: two points are subtracted in case of optimal compatibility, and two points are added in case of poor compatibility. For example, by applying the weights (Table 4) to a cooperation process with ITA with items of (MTS, IPP, AP) rated as (o, o, o), we obtain 13 points (ITApre). The cooperation process is beneficially supported by tool-coupling and conducted by teams that are experienced in tool-coupling resulting in four points to be subtracted. Additionally, the participating teams have a matching organisation structure (compatibility of team structure, resulting in two points to be subtracted). Consequently, six points are subtracted from ITApre resulting in seven points for the ITA of this cooperation process.
In the following, the calculation of the score for the kth workflow is described. For the calculation of a preliminary score S pre,k for each alternative workflow (cp. Figure 3, step ![]() ), the cooperation aspects of all cooperations within the workflow are rated. Using the weighting table, the respective points are determined. According to the previous section, points are added or subtracted from the ITA points, depending on data backbone, tool-coupling and team structures. The sum of all determined points is taken and then divided by the number of rated cooperation aspects. For example, a cooperation process with three involved teams has 15 cooperation aspects (3 × 3 team aspects, three ITA and three organisational aspects). To obtain the preliminary score for this workflow (in this case only one cooperation process), the sum of points from the ratings is divided by 15. By normalising the sum with the number of rated cooperation aspects, the preliminary score S pre,k is independent from the number of cooperation processes and involved teams.
), the cooperation aspects of all cooperations within the workflow are rated. Using the weighting table, the respective points are determined. According to the previous section, points are added or subtracted from the ITA points, depending on data backbone, tool-coupling and team structures. The sum of all determined points is taken and then divided by the number of rated cooperation aspects. For example, a cooperation process with three involved teams has 15 cooperation aspects (3 × 3 team aspects, three ITA and three organisational aspects). To obtain the preliminary score for this workflow (in this case only one cooperation process), the sum of points from the ratings is divided by 15. By normalising the sum with the number of rated cooperation aspects, the preliminary score S pre,k is independent from the number of cooperation processes and involved teams.
In industrial settings the duration to design or realise a solution must be taken into account for example due to contractual penalties in the event of a time overrun. To consider the time needed to finish the necessary cooperation processes within one workflow (step ![]() , Figure 3), we calculate the total time of each workflow by summing up the required cooperation process times ti,k (i represents the index of the cooperation process) for all nk cooperation processes in a first step.
, Figure 3), we calculate the total time of each workflow by summing up the required cooperation process times ti,k (i represents the index of the cooperation process) for all nk cooperation processes in a first step.
 $$ {t}_k=\sum \limits_{i=1}^{n_k}{t}_{i,k}. $$
In a second step, the calculated total times tk of the alternative workflows are divided by tmax in order to obtain a dimensionless time ratio rtk. Thereby, tmax represents the allowed duration to complete the project. As a consequence, the total time within all alternative workflows must be equal to or smaller than tmax. Hence, rtk, the time ratio value of a workflow, represents the normalised time ratio compared to the maximum allowed time. That is, it will approach to zero for a workflow that only requires a small fraction of the time or increase towards one for a workflow that requires more time fraction.
 $$ {rt}_k=\frac{t_k}{t_{max}}. $$
To determine the highest possible impact of the time on the score of the alternative workflows, a dimensionless time criticality factor TC is introduced. The product of TC and rtk represents the proportion of the preliminary score that is added to obtain a final score S final,k that includes time consideration. Thereby, TC defines the maximum possible proportion of S pre,k in case the time ratio rtk equals one.
 $$ {S}_{final,k}={S}_{pre,k}\cdot \left(1+ TC\cdot {rt}_k\right)\hskip0.5em \mathrm{with}\hskip0.5em 0\hskip0.3em \le \hskip0.3em {rt}_k\hskip0.3em \le \hskip0.3em 1;0\hskip0.3em \le \hskip0.3em TC\hskip0.3em \le \hskip0.3em 0.5. $$
TC must be determined in a use case specific way since the time criticality depends on boundary conditions of the project. We propose to use values between 0 and 0.5 (inclusively) for TC. To include the possibility to consider the time but to avoid override of the evaluation of cooperation aspects, a maximum value of 0.5 for TC was found to be appropriate by performing exemplary calculations. In general, a high value for TC might be chosen for projects with a high time-criticality and a low value for projects that have high requirements regarding the quality of the results. If a value of 0.5 is chosen for TC, a maximum of half the value of S pre,k is added to itself to obtain S final,k. In this case, the time consideration has a considerable influence on the final score, and thus the decision which workflow is to be preferred. However, if only the quality of the result is of interest, that is, it does not matter what duration is expected for a workflow, TC is set to zero. Therefore, S final,k equals S pre,k, and thus only the rating of the cooperation aspects (and not the time) is included in the score.
3.5. Meta model of BPMN++
To avoid ambiguities of the proposed BPMN++, a formal definition of the notation is provided as a meta model (Figure 4) according to da Silva (Reference da Silva2015). The meta model is used to describe the concrete syntax in accordance to Sections 3.1–3.4 as UML class diagram [Object Management Group (OMG3) 2017].
Four abstract classes, which are Container, Node, Connector and Team/Actor represent all elements of the presented views. Using compositions, the concretely derived elements are assigned to each diagram, network of actors (Figure 4, right-hand side) and cooperation diagram (Figure 4, left-hand side), respectively. Containers couple nodes and teams/actors, connectors can connect teams/actors. The shaded fields show elements that are similar to elements defined in the BPMN Collaboration Diagram specification and the BPMN Choreography Diagram specification. It should be noted that only selected cardinalities are given in this meta model that are of particular interest for the description.
4. Application of integrated graphical BPMN++ to support decision-making of the site manager during plant start-up
The decision-making by a site manager during start-up demonstrates the complexity of the planning task and it is required to include all three aspects: engineering, multiteam systems and organisation. These aspects help to find the best solution in a critical stage of the start-up shortly before or even during acceptance test with a guaranteed date given in the contract, limited personnel resources and additional expertise from the design offices often on different continents. The selected use case belongs to the category ‘on-site change’ [‘VI’ by the classification scheme of the priority program PP 1593 (Vogel-Heuser et al. Reference Vogel-Heuser, Fay, Schäfer and Tichy2015)], which results from changes in physical components of the plant and affects the software. Thereby, it is distinguished whether changes are caused by electrical parts (‘VIa’), mechanical parts (‘VIb’) or both (‘VIc’). This original scenario has been enriched by introducing different teams and organisational aspects (Vogel-Heuser et al. Reference Vogel-Heuser, Brodbeck, Kugler, Passoth, Maasen and Reif2020b) during the start-up procedure and will be referred to as an on-site software change in the following.
The chosen use case describes a frequently occurring situation in the start-up of a new plant type or new machine type because of customer-specific requirements or specific environmental situations on site. The number of actors is based on more than five different real industrial cases but of course described in an abstracted and generalised way.
4.1. Introduction of industrial use case: software change during start-up
The use case scenario starts with the identification of a technical problem in the mechanical unit 1 (ANSI/ISA-88.01-2010 2010) during the commissioning of a production plant on a customers site.
According to scenario ‘VIb’, that is, a mechanical part change, the mechanical commissioning engineer (team ‘Machine Optimization’, company G) cannot solve the problem mechanically and, therefore, proposes as a workaround a software change to the start-up electrician for area 1/2 (team ‘Startup Area 1/2’, company B), who then presents the potential change to the site manager (team ‘Site Supervision’, company G). Unfortunately, the start-up electrician of company B realised that due to this software change, a new issue is created in the interface between the software of company B and company U2. The start-up electrician of company U2 (team ‘Startup Area 3’) would need to change the software by altering the acceleration procedure. Since company U2 is only indirectly affected, the start-up electrician would be forced to make changes that are not included in the initial contract of U2.
There are two possible solutions to address this scenario. On-site troubleshooting (Figure 5, workflow  $ \alpha $, left-hand side) is the most time-efficient when time constraints require a quick solution. However, according to the ISO 9000 procedure (ISO 9000:2015 n.d.), changes should be made by the design team (Figure 5, workflow $ \beta $, right-hand side) to ensure appropriate bug and change management, that is, to ensure structured and consistent application of required engineering changes. In workflow $ \beta $, the commissioning mechanic (team ‘Machine Optimization’, company G) contacts his design office, and the designer (team ‘Detailed Mechanical Design’, company G) contacts the software design of company B and also contacts the software developer of company U2. The design departments work jointly on a solution and send it to the construction site as soon as it is ready. The start-up personnel updates and tests the software on the controllers concerned. In the case of an overseas start-up site, the time delay is potentially aggravated by a closed design office during the night or even weekend that may not be acceptable for the customer and consequently for the site manager. With our approach, we aim to support the site manager in his/her decision-making to select one of two solution workflows together with the on-site team. In the following, the two alternative workflows will be introduced using BPMN++.
4.2. Modelling the use case using the integrated graphical concept of BPMN++
The BPMN+I diagram of the industrial use case forms the basis for modelling the submodels of the BPMN++ notation. Figure 5 depicts an excerpt from the entire BPMN+I diagram (Vogel-Heuser et al. Reference Vogel-Heuser, Brodbeck, Kugler, Passoth, Maasen and Reif2020b, Figure 5), which illustrates the design process and the commissioning and start-up of the production plant.
The excerpt contains all relevant information for BPMN++ modelling of the two alternative workflows  $ \alpha $ and $ \beta $ for software change. For better comprehensibility, locations are indicated at the top. In the following, the two alternative solutions will be modelled in BMPN++ in order to estimate the benefit of BPMN++ modelling when comparing the two variants.
When evaluating the cooperation reasonably, references to empirical and historical data are to be included to reduce subjective ratings as much as possible, but the necessity for expert ratings for some aspects will remain.
Software change on-site (workflow α)
In the following, workflow  $ \alpha $ is modelled (on-site software change). The mechanical start-up engineer (team ‘Machine Optimization Unit 1’) detects the error and initiates the process error report (initiating teams/actors can be recognised by the highlighting of the endpoints of the vertical dotted lines). In the process of finding a solution, the ‘Site Supervision’ acts first as a moderator between the start-up personnel of company B and U2. Therefore, the ‘solution finding’ (Figure 5, A2 and A3) is understood as a single cooperation process involving three teams/actors: ‘Site Supervision’ (company G), ‘Startup Area 1/2’ (company B) and ‘Startup Area 3’ (company U2).
The ‘Site Supervision’ team has a team structure (TEA) that is characterised by less hierarchy and more flexibility, reinforcing problem-solving, decision-making and teamwork. Within this team structure, the mechanical start-up engineer is able to decide quickly and flexibly and initiate processes on his/her own responsibility. Due to the higher level of personal responsibility, the team structure is assumed to have a positive effect on problem-solving behaviour. Accordingly, the team aspects for the ‘Site Supervision’ in the ‘solution-finding’ process are rated well (Figure 6, III).
Since all cooperation processes take place at the same location with teams/actors of several companies, the evaluation of their organisational aspects is plotted in the Network of Actors inside the ‘on-site’-location circle (Figure 6, right-hand side). Good evaluation ratings are given in the Network of Actors because legal regulations are in place, and the personnel already knows each other through cooperation during the start-up (personal relationships built). Trust was established (cp. Section 2.1), and accordingly, the MTS criterion is well-rated in the ITA (Figure 6, left-hand side). However, since the teams from company B and U2 have not worked together in previous projects, no underpinning with historical data is marked. In contrast, the teams of ‘Machine Optimization’ of unit 1 and ‘Site Supervision’ have already worked together successfully in projects. A relatively reliable evaluation for the ITA can be derived from postcalculation of an earlier project for this cooperation data (Section 2.3). Therefore, the ITA are marked with a filled black triangle (Figure 6, I). The personal relationships and networks built up between the two teams in previous projects are also indexed accordingly in the Network of Actors as an evaluation criterion backed up by historical data (Figure 6, IV).
The ‘bug report’ represents a one-off transfer of information and the time duration is roughly estimated as 1 hour. The following process, the ‘solution finding’, requires an intensive exchange of information. Based on historical data from start-up procedures of other projects with similar problems, a controlling team (which reviews the overall project execution and conducts postcalculation of the project) of company G could provide relationships (cp. Section 2.3) between the category of the problem and the time to solve it. Since the solutions in former projects were also found on-site, the empirical correlation for the time can be applied in this case and is therefore indicated by an empty triangle (Figure 6, II).
The on-site start-up personnel lacks competences and experience in re-designing engineering documents, including its consistency check and therefore receives worse team aspect evaluations (e.g., qualification); however, the evaluation is not backed by historical data because the partners differ in this project.
Applying the presented weighting and calculation scheme, we obtain a preliminary score of S pre,α = 3.4 for an on-site change. To interpret this value, we perform in the following the same procedure for a change in the design office.
Software change in the design office (workflow β)
The software change workflow in the design office would consist of three cooperation processes since the solution finding is worked out only between the design offices of companies G and B (‘bug report’ and ‘solution finding’). In this scenario, a subsequent alignment of interfaces with the software design (involving company U2) is necessary.
The Network of Actors shows that team ‘Machine Optimization Unit 1’, which detects the error, partly consists of the same personnel from team ‘Detailed Mechanical Design’ (Figure 7, top right, dotted circle). This allows for a better solution finding process since personnel from team ‘Detailed Mechanical Design’ who know the plant and the bug from their own experience are involved. As the two teams were involved in the planning of the plant, they are able to find a sustainable solution to the problem. For this use case, we assume empirical evidence shows that in general the teams in the design office are better at finding solutions than the on-site teams. Accordingly, the team aspects are well evaluated and marked with underpinning by empirical data (Figure 7, I).
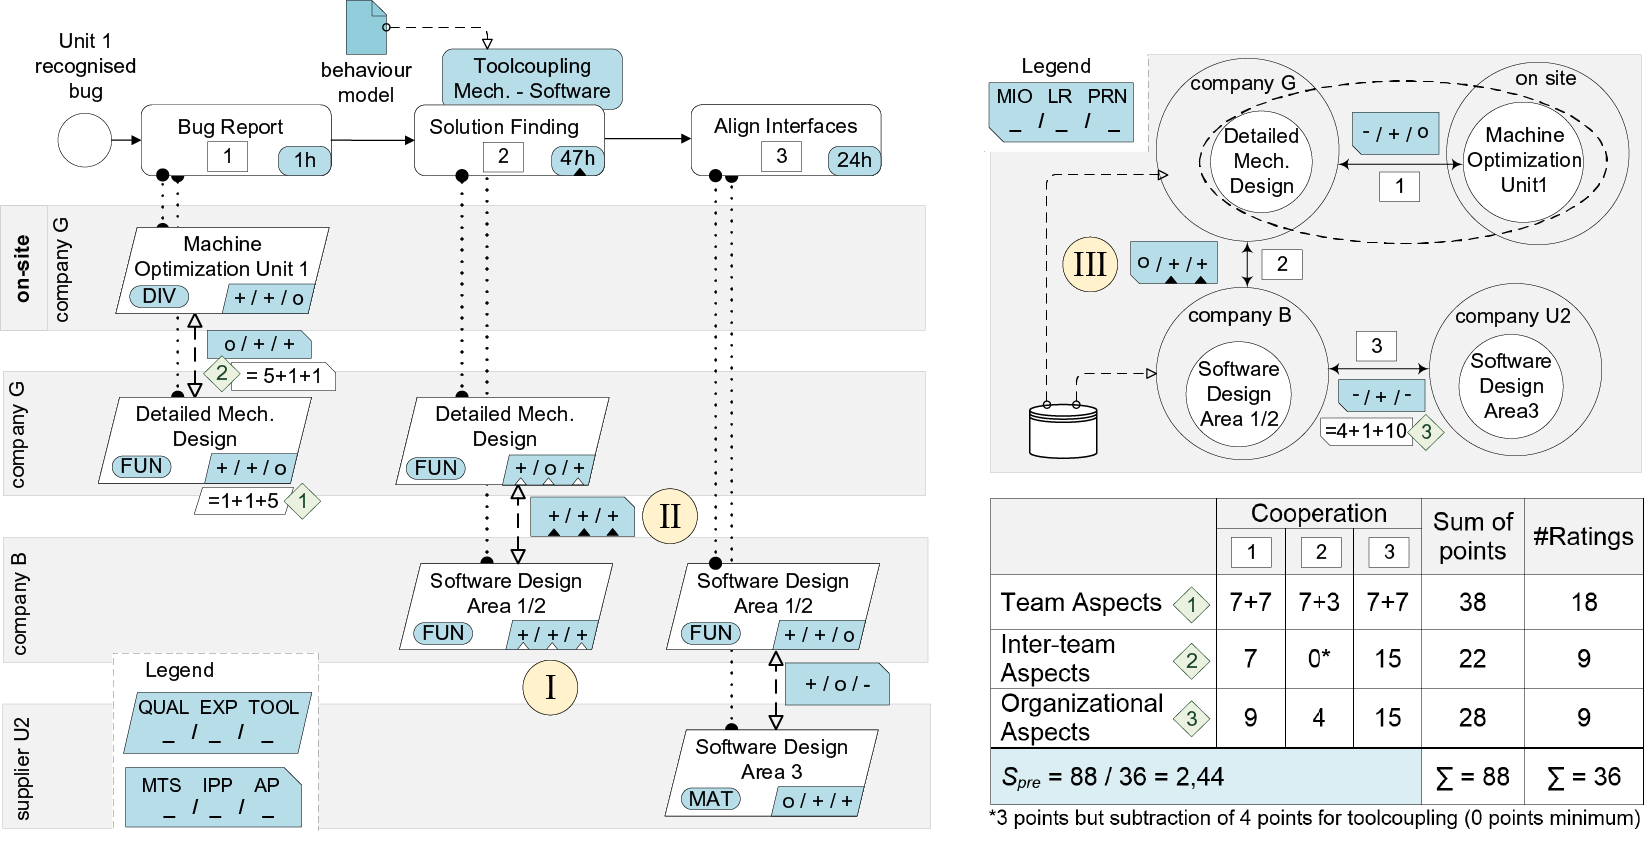
Figure 7. Software change in the design office (workflow  $ \beta $): cooperation diagram (left), network of actors (right, top) and an overview of the calculation of the preliminary score (right, bottom).
The design offices of companies G and B have already worked together successfully on a number of occasions and an appropriate infrastructure for tool-coupling and data exchange has been established. Accordingly, the ITA of this cooperation are also well evaluated, and the filled triangles indicate their underpinning by historical project data (Figure 7, II). Since the ‘solution finding’ (Figure 5, B2) is enhanced by tool-coupling and a common data backbone facilitating data exchange, four points are subtracted from the ITA of this cooperation.
Here, the personal relationships and networks already established between G and B are indexed in the Network of Actors as an evaluation criterion backed up by historical project data (Figure 7, top right, III).
After the solution has been found, necessary interface adjustments (as a consequence of the solution workflow) between Company B and U2 are determined (Figure 5, B3). Neither tool-coupling nor a common data backbone is available here. Since the two companies have never cooperated before, openness and communication are rated worse for the ITA (Luciano, DeChurch & Mathieu Reference Luciano, DeChurch and Mathieu2018). In contrast to the software change on-site, the teams in the design offices are better suited for finding a solution for engineering changes, and thus receive a proper evaluation for their team aspects. The estimation of the times needed for the ‘bug report’ and the ‘solution finding’ is done in analogy to the first scenario. Based on the previous projects between G and B, historical data on the time required for ‘solution finding’ is available. The time for the third cooperation process, that is, ‘align interfaces’, must be estimated because there are no data available. All cooperation partners operate at varying locations. Thus, the organisational aspects are modelled between different location circles (Figure 7, top right). In this scenario, too, contracts between the companies and, in some cases, personal networks exist, which is reflected in a good overall assessment of the organisational aspects.
We obtain a preliminary score of S pre,β = 2.44 for a change in the design office. In comparison to an on-site change, the value is lower, and thus, means a better rating. A detailed evaluation as well as the consideration of workflow duration to determine the final scores are conducted in Section 5.1.
5. Evaluation results for the industrial use case: decision-making of the site manager during plant start-up
The evaluation was conducted using a real-world decision-making case from the start-up of a plant, as introduced above. Four experts from different domains, that is, managers from systems engineering, organisation and psychology researchers were asked to provide their feedback based on the different models and additional notational elements. All experts rated the integrated BPMN++ notation as beneficial and appropriate for the given task (cp. Section 5.1). In Section 5.2, the integrated graphical BPMN++ approach is compared with the existing hybrid BPMN+I approach with respect to its weaknesses and strengths. Next, in Section 5.3, constraints for the beneficial application of the integrated BPMN++ approach are introduced, like the identification of similar scenarios and the feasibility of including existing workflow documents or models.
5.1. Application of the integrated notation BPMN++ to evaluate the industrial use cases scenarios
In the following, the modelling (Figures 6 and 7) of the two alternative workflows in the introduced use case will be used to determine the extent to which the proposed integrated graphical BPMN++ modelling adds value in the assessment of cooperation processes.
In contrast to the BPMN+I diagram, the cooperation diagram shows the number of effective cooperation processes. For both workflows, three cooperation arrows were modelled (Figure 5), but a different number of cooperation processes were found due to cooperation with more than two participants. This allows a more precise display, which leads to a better estimation of the complexity of cooperation processes.
Eight experts from three disciplines (system engineering, psychology in the field of team work, sociologist expert in company assessment and training as well as engineering in machine and plant automation) confirmed in a workshop that the Cooperation Diagram allows a quick overview of the involved teams/actors or companies in comparison to BPMN+I. Furthermore, it can be used to check the modelled workflows. Typically, a team/actor from the previous cooperation process should be the initiator of the next cooperation process. If this is not the case, this can be an indication of poor planning or incorrect modelling.
Data or documents resulting from a cooperation process cannot be modelled in BPMN+I in a meaningful way, as they always need to be assigned to a cooperation partner. In the Cooperation Diagram, documents can be modelled to enable a better understanding.
The modelling of the process with respect to team- and ITA (Figures 6 and 7, left-hand side), and organisational aspects (Figures 6 and 7, right-hand side) allows a quick and rough estimation of the feasibility, respectively obstacles when comparing the scenarios. For example, the Cooperation Diagram shows that the software change in the design office (i.e., workflow  $ \beta $) requires 1 day longer in total because it needs one more cooperation process than the on-site change (i.e., workflow $ \alpha $). However, the team aspects are very well-rated for the change in the design office, and tool-coupling and a data backbone enhance the cooperation process during the solution finding process. In contrast, the on-site workflow ( $ \alpha $) is faster, but the team aspects are rated poorly. On the other hand, the inter-team and organisational aspects of the on-site teams are excellent since all teams/actors are working at the same location and know each other.
In this case, a qualitative decision on which of both alternative workflows (i.e., change on-site ( $ \alpha $) or in design office ( $ \beta $)) is to be preferred is difficult. That is because both sides are balanced, with each having pro and contra points.
Therefore, we conduct a quantitative analysis according to the calculation procedure proposed in Section 3.4. For the assessment, we use the weights shown in Table 4. The calculation of the preliminary score is performed for the two alternative workflows based on the determined ratings depicted in Figures 6 and 7. For workflow  $ \beta $, the calculation is thoroughly outlined in Figure 7 (right-hand side, bottom). First, we calculate the preliminary scores (without consideration of time) for both workflows. We obtain S pre,α = 3.4 for an on-site change compared to S pre,β = 2.44 for the design office. That means the change in the design office (workflow $ \beta $) is to be preferred (since smaller values indicate a better rating).
However, the consideration of time can change the result since the duration of both alternatives varies significantly. Applying Eq. (1) (Section 3.4), we obtain the total duration of the workflows with tα = 4 hours while tβ = 3 days. To illustrate the influence of the time consideration, we assume a high-time criticality induced by the customer and potential back charges (contract guarantees). Therefore, the maximum allowed time is limited to 3 days (t max = 72 hours), and the highest possible time criticality factor is chosen with TC = 0.5. To calculate the time ratios according to Eq. (2) (Section 3.4), the times of both workflows tα and tβ are divided by the allowed time t max = 72 hours and we obtain rtα = 4/72 = 0.06 and rtβ = 72/72 = 1. Inserted in Eq. (3) (Section 3.4), we obtain final scores of S final,α = 3.59 for on-site change and S final,β = 3.66 for the change in the engineering office. In contrast to the result based on the preliminary score, the on-site change is to be preferred when considering the duration of the workflows.
The obtained scores correspond to the result of the previous work in the BPMN+I approach (Vogel-Heuser et al. Reference Vogel-Heuser, Brodbeck, Kugler, Passoth, Maasen and Reif2020b). Since time was not considered in this approach, we compare the results using the preliminary score. For the same use case, a ratio of 140–120 (about 17%) on-site ( $ \alpha $)/design office ( $ \beta $) was determined in the BPMN+I approach. The obtained S pre ratio in the BPMN++ approach of 3.4 to 2.44 (on-site ( $ \alpha $)/design office ( $ \beta $)) is more significant (about 39%) due to the nonlinear weighting, and the consideration of additional aspects such as tool-coupling and data backbone. This result shows for the presented use case that a more significant result can be obtained with the BPMN++ approach by covering more aspects in comparison to the BPMN+I approach.
For this use case, the total score was not affected by the origin of the data: whether they are just estimated by experts, proven by empirical studies or project controlling history. However, in future work, an uncertainty value would be considered to describe the relation between historical and empirical data on the one hand and experts estimation on the other.
In summary, BPMN++ modelling can be used to make a qualitative evaluation of a workflow. In cases where qualitative evaluation cannot be done easily, a quantitative evaluation system can be executed based on BPMN++, whose basis is an existing BPMN model, which is enriched with identified cooperation processes (BPMN+I model). Furthermore, the BPMN++ diagram provides a better overview of the cooperation processes and can be used to check the workflow.
5.2. Threshold analysis of BPMN++
In the following, the thresholds of the ratings are discussed for two teams to ease understanding. The evaluation of the cooperation aspects is based on the ratings, which are converted to points using the proposed weighting system (Table 4). According to Section 3.4, the points for the respective ratings of team-, inter-team- and organisational aspects are added and the sum is divided by the number of ratings. Consequently, the preliminary score is dependent on the assessed quality of teams and cooperations but not on the number of them. Therefore, this evaluation scheme is scalable and allows for a comparison of workflows with different numbers of cooperations. In case, the numbers of cooperation processes and teams increase a lot it implies that the teams never worked together and, thus, have a lower inter-team rating according to our approach. The risk to fail is included by the rating of the ITA.
In the following, the calculations of the highest and lowest obtainable scores are introduced. Corresponding BPMN++ models are attached (cf. Figure A1). For an ideal cooperation process involving two teams with best ratings for all team-, inter-team- and organisational aspects as well as tool-coupling and data backbone, a minimum preliminary score of 0.75 can be obtained [1 point for each of the 12 ratings (6 ratings for team aspects of two teams, 3 ratings for ITA and 3 ratings for organisational aspects), subtraction of 3 points for ITA: therefore 9 points divided by 12 (ratings)]. This is the lowest (best) possible score.
In contrast to that, for a cooperation process involving two teams with the worst possible rating of all aspects and incompatible team structures, a maximum preliminary score of approximately 11.17 can be obtained (132 points from 12 ratings, 2 points added for incompatible team structures). It should be noted that an even higher (worse) score can be obtained for cooperation processes with a higher number of teams. Since all three team aspects have the highest weighting (13 points for poorly rated team aspects, cp. Table 4), the preliminary score for a cooperation process approaches 13 asymptotically as the number of poorly rated involved teams increases up to infinite. Depending on the chosen time criticality factor, a higher final score can be obtained when time is considered according to Section 3.4.
If a cooperation aspect cannot be rated due to lack of information, it can be disregarded in the evaluation, since the sum of the points from the ratings is divided by the number of effectively applied ratings. However, the influence of the other ratings on the obtained score grows and the balance between team-, ITA and organisational aspects may be affected. Therefore, it should be considered to rate such cooperation aspects as medium (‘o’ out of ‘+/o/−’), especially if there is a lack of information regarding several aspects. In the case that all aspects are rated as medium for a cooperation process with two teams, a preliminary score of 4.33 is obtained.
5.3. Comparing the proposed integrated graphical BPMN++ with BPMN+I
The BPMN+I approach proposed a table to evaluate aspects of the identified cooperation, which is then used to calculate the score. In contrast, in the BPMN++ approach, we use a graphical representation included in the proposed submodels. The advantages of the BPMN++ approach are discussed in the following.
The division into the two submodels Cooperation Diagram and Network of Actors in BPMN++ enables a meaningful separation of cooperation aspects that are team/process-dependent and team/process-independent. The psychological aspects of a team, such as MTS-mindset and communication, differ, that is, they depend on the type of the task as well as cooperation partners. In comparison, most organisational aspects can be applied to all teams of a company – regardless of the task types or cooperation partners – and remain largely unchanged at the relevant time of decision support (e.g., degree of formal organisation). Hence, the cooperation diagram has the ideal structure to be enriched with technical/psychological aspects and the Network of Actors with organisational aspects.
In the cooperation diagram, teams are assigned to the companies, whereas in the network of actors, they are assigned to the locations at which they operate. Thus, two different perspectives are provided, which can prove to be an advantage, especially in larger projects with many participants. For instance, if material flows play an essential role, the Network of Actors can quickly provide an overview of the locations between which material transport needs to be established.
The scalability is given with both BPMN++ and BPMN+I approaches. However, the overview in the table can become problematic for more complex workflows, as evaluated aspects are not directly visible in the diagram though the aspects have to be traced in the checklist. In contrast, the evaluation aspects are visually linked to the corresponding cooperation and teams in the diagram in the BPMN++ approach, and thus, are immediately identifiable.
The graphical representation in BPMN++ allows easy extensibility of the evaluation aspects. The newly introduced elements in BPMN++ allow to insert additional criteria to be considered: for example, time expenditure could be used as an indicator of the complexity and importance of a cooperation process. Tool-coupling and common data backbones can significantly increase the effectiveness and quality of the cooperation process. Also, the introduction of further aspects in future projects is conceivable, for example, distances between relevant locations in the network of actors. Another important point is the quantitative evaluation system. The table in the BPMN+I approach already limits the flexibility in the evaluation. The weighting of the evaluation aspects is the only available medium to adjust the evaluation system. In comparison, in the BPMN++ approach, the two subdiagrams are independent from the evaluation system. For the evaluation of the use case, we use a BPMN+I-based approach with non-linear weightings (cf. Section 3.4), but any other kind of calculation method using an according algorithm is possible. Furthermore, paradigm neutrality is ensured by the possibility of adopting new evaluation systems while the BPMN++ model remains the same. This ensures the transferability of new empirical models and, thus, the applicability of the BPMN++ approach in a dynamic, fast-changing business environment. The development of a suitable ‘basic framework’ for adaptable and evolvable evaluation systems and the automatic import of the evaluated models will be tasks in future work.
The apparent disadvantage of the integrated graphical BPMN++ approach is the more elaborated approach via the intermediate step of the submodels, while the table is directly derived from the BPMN+I (BPMN enriched with cooperation arrows) diagram. However, this disadvantage could be reduced in the future work: based on annotated BPMN cooperation representations, an evaluation support will be developed that automatically parses the BPMN diagrams and identifies the cooperation criteria based on its meta model.
5.4. Constraints for a successful application: comparability of similar scenarios (and individual processes in context) and integration of existing partial models
To obtain a meaningful result from the BPMN++ evaluation approach, the proposed cooperation aspects need to be best rated objectively. However, we aim to support the comparability of the subjective assessments and their validity by a clear definition of assessment aspects. In future work, guidelines and checklists may be used to allow for a more precise and more balanced rating of psychological and sociological aspects.
In order to establish the BPMN++ evaluation method, the comparability of similar projects is required to allow feedback loop and sensitivity analysis. In order to optimise evaluation and decision-making for new projects based on postcalculation of finished project data, it would be useful to issue a guideline that defines, for example, the separation between communication and cooperation or the level of detail in BPMN/BPMN++ modelling. This way, it could be ensured that the modelling (as the basis for the evaluation) is done in a uniform style.
The comparison of individual cooperation processes from similar workflows can also offer a great advantage. Here as well, a uniform modelling style satisfies essential requirements for comparability. The question as to what extent the context of the cooperation processes can be compared (e.g., previous and subsequent processes) makes the comparison difficult. This should be addressed in the future work.
Using the BPMN++ model requires an existing BPMN model in which the goal of a project is clearly defined, and the workflow is roughly planned. BPMN++ modelling can support decisions during the planning phase of a project or in case of unforeseen events that force a change in the planned workflow, as shown in the use case software change during start-up. In the latter case, an already existing BPMN-Diagram from internal company process descriptions like ISO 9000 can be used.
6. Conclusion and outlook
Industrial companies are working on the model-coupling in mechatronics and selected other areas using Product Lifecycle Management or Enterprise Resource Planning systems. Nevertheless, many decisions are still based on different single documents and/or information. The presented BPMN++ approach was introduced to ease the comparison of two or more decision alternatives considering team and ITA, time needed, tool-coupling as well as inter-company aspects in cooperation. By including these aspects of the cooperation processes in the BPMN workflow (Table 3), the user is given a comprehensive overview of all relevant aspects in order to support decisions in a transparent manner. Furthermore, BPMN++ clarifies the source of the rating, whether it is a subjective estimation by humans or based on historical or empirical data. The use case within this article is derived from surveys in plant manufacturing concerning the decision support during the start-up phase on-site and represents a critical and complex phase in which problems and delays may cause a high economic impact. Especially for European companies acting as main contractor in plant manufacturing in a global market, the outcome of the commissioning and start-up phase may affect the result of the entire project. Our approach supports the site manager in his/her short-term decision-making process whether to fix a bug at site or systematically include the design offices.
To reduce the effort for creating the subdiagrams of the BPMN++ approach, existing BPMN diagrams, for example from ISO 9000 certification of the respective company, shall be semi-automatically analysed, imported and used for further enrichment regarding MTS and organisational, tool and data-based evaluation as introduced above. A wizard function should support the usage of all available workflow models from a management team, a team for organisational development, and quality control to derive the BPMN++ diagrams from it quickly and, if more than one is available, to validate the included model elements and their connections. Once in use, BPMN++ diagrams derived by different teams in an organisation using diverging parameters can also be used for internal revision, audit or quality control purposes to evaluate both assumptions and outcomes.
The quantitative assessment scheme serves to compare the different project designs based on the introduced weights. Different priorities (e.g., time-criticality) can be selected, which would be taken into account in the algorithm using different weighting factors of the evaluation criteria. These scores will support the final decision-making process, besides other aspects not represented in the BPMN++ models like the preservation of expertise.
After the practical implementation of a project evaluated with BPMN++, it can be assessed to what extent specific cooperation processes have been essential for the success of the project and which problems have occurred during the project implementation with which level of the impact to which processes or actors. The weighting for the evaluation criteria can be adjusted according to the additional assessment for subsequent evaluations of projects. In doing so, project type and external circumstances like market situation would have to be taken into account, since these might also affect the significance of the individual evaluation criteria. The weighting of the evaluation criteria for a particular project type should, therefore, be optimised with the feedback from similar project types. To reduce subjectivity regarding the rating of evaluation criteria, guidelines and checklists will be used as mentioned in Section 5.4.
Experts suggested to include a more sophisticated analysis of sensitivity. Decisions that show the highest sensitivity to changes in either rating (weight) or workflow should be highlighted. Once highlighted, different ratings and or empirical data could be compared. Abstractions of the existing project design alternatives could be derived and used as a decision tree, so that the types of project designs could also be indicated with respect to the sensitivity information intuitively to the decision-makers. For example, the aspects, in which the project design alternatives differ, represent branches. Accordingly, each project design represents a combination of selected aspect options and is, therefore, to be represented by a path in the decision tree. In this way, critical decisions can be identified and qualitatively re-assessed to increase trust.
BPMN++ models would make it easier to decide which collaboration processes are suitable for semi-automated and/or automated decision-making approaches. These models can be used to check whether such approaches are firstly technically feasible and secondly economically reasonable, since they frequently occur in the workflow.
A. Appendix
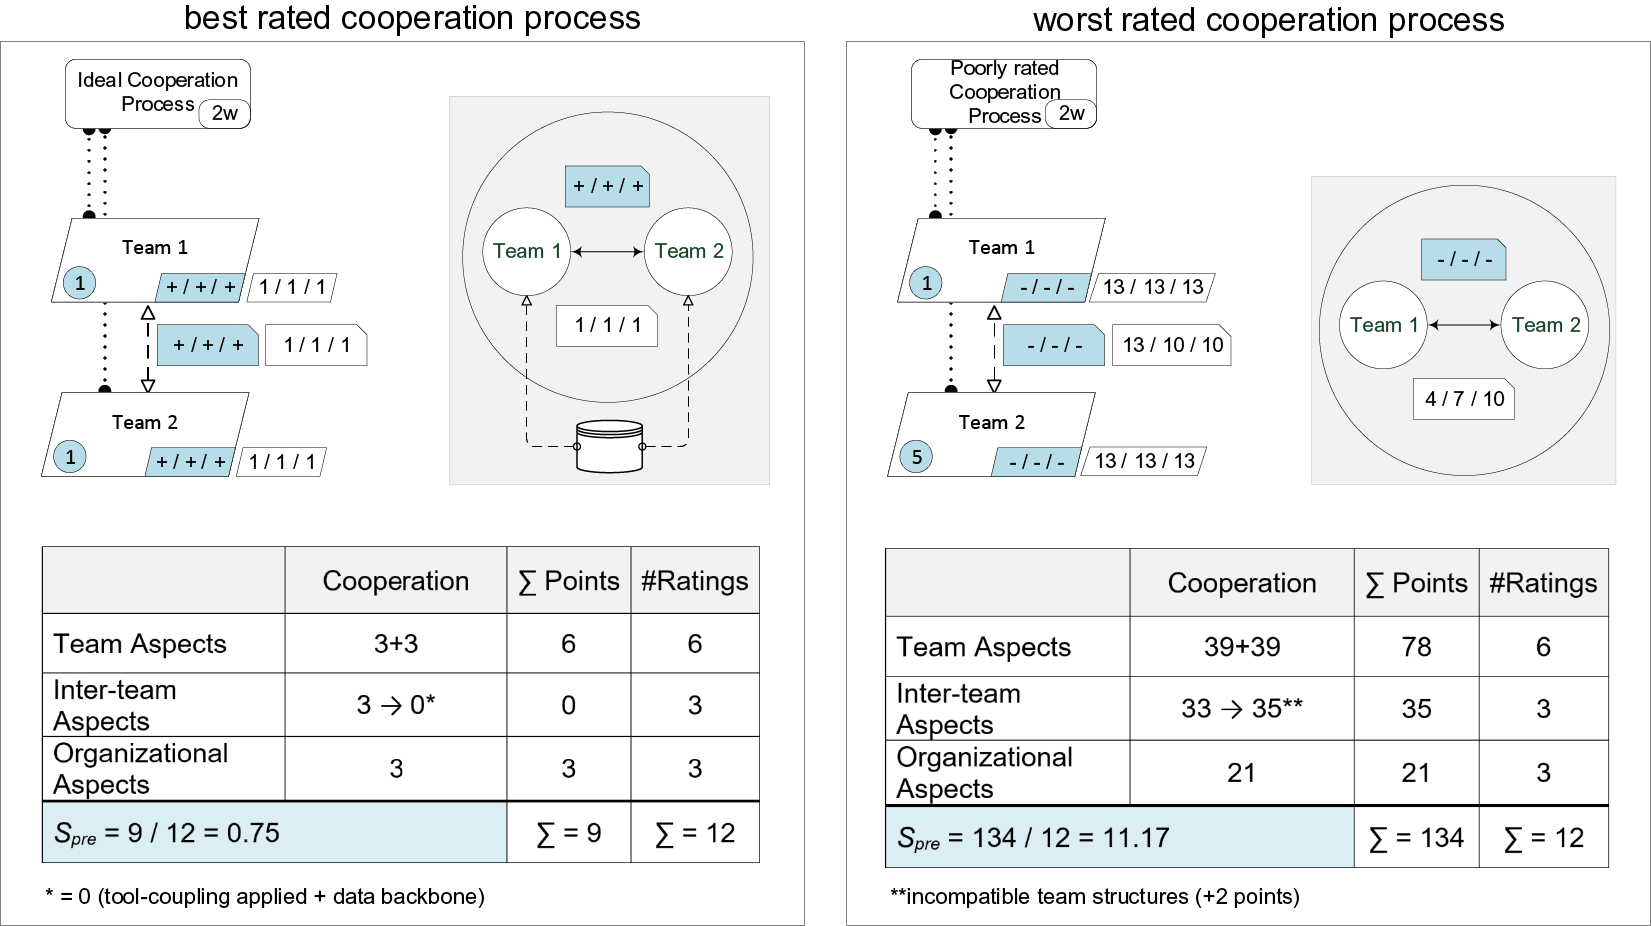
Figure A1. Sensitivity analysis by considering the score for highest and lowest rating for a cooperation process with two involved teams (without time consideration).


 Open access