


Introduction
International context
Governments throughout the world are challenged by population ageing during times of uncertain economic growth and significant events such as the 1997 Credit Crisis, the 2007–2009 recession in the United States of America (USA) and subsequent economic slowdown in many developed countries. Major questions are arising as to the sustainability of policies that have traditionally redistributed resources from those in younger and middle ages (relatively recent cohorts) to those in later life (earlier cohorts). The implicit assumption has been that older people are disadvantaged not only by the vulnerabilities and risks of later life, but also by their birth cohort; that is, the relatively reduced opportunities of having lived in earlier periods when standards of living were relatively lower. Over recent years, attitudes sympathetic to the needs of those now in later life have been confronted by increasing indications that the economic and fiscal outlook could be significantly worse for future cohorts (Hurley, Breheny and Tuffin Reference Hurley, Breheny and Tuffin2017).
Over the post-Second World War era of rising real incomes and expansion of the public sector, the growth of what Binstock (Reference Binstock2010) termed an era of ‘compassionate’ ageing recognised the intense and widespread needs of ‘the elderly’ and the case for expansion of programmes beneficial for them. The US system of voluntary voting, in which older people made up a disproportionate share of the electorate, reinforced their electoral strength. Walker (Reference Walker1990) presaged later policy debate by suggesting that issues of intergenerational equity, fuelled by the fiscal injunctions of the International Monetary Fund and other international agencies, had been driven largely by ideologies that raised the spectre of population ageing as an economic ‘burden’ to argue against welfare expenditure. More recently, the political context in the USA has changed along with economic stringencies and more conservative ideologies. In this context, political forces in the USA began to argue for reductions of Social Security and Medicare provisions in order to limit taxation or redistribute benefits to younger people in greater need (Hudson Reference Hudson, George and Ferraro2016).
In the welfare states in Europe, issues of intergenerational transfers also are heightened as younger people (more recent cohorts) have faced the spectre of modest economic prospects, while the public sector faces the rising costs of growing numbers of older people in an increasingly difficult fiscal climate. Drawing on Kohli's earlier work on intergenerational justice, Kohli and Arza Reference Kohli, Arza, Binstock and George2011: (260–262) argue for ‘political recognition of the full patterns of intergenerational exchange and of the whole life course’. Drawing on the United Kingdom (UK) experience, Higgs and Gilleard (Reference Higgs and Gilleard2010) posit that recent cohorts have been entering retirement with more of them maintaining levels of consumption from middle age, with wealth in home-ownership emerging as a major social divide along with income and social class. In New Zealand, universal state-funded superannuation can exacerbate inequalities between generations but ameliorate them within generations by protecting older tenants from poverty (Hurley, Breheny and Tuffin Reference Hurley, Breheny and Tuffin2017).
Australia and a changing social contract
Australia over the post-Second World War era has experienced enormous economic growth and considerable policy advances that have been particularly beneficial for the baby-boom cohort now entering later life. Most notable among these developments have been substantial increases in real incomes, rising home-ownership levels, and improved provision for income support and health services (Kendig Reference Kendig, O'Loughlin, Browning and Kendig2017a). Through the 1980s and into the 1990s, a reforming Labor government progressively raised the age pension, implemented national superannuation, and improved health and care programmes (Kendig Reference Kendig, O'Loughlin, Browning and Kendig2017a). In the early 1990s, however, a sharp, short recession led to the return in 1996 of a conservative Coalition government under the rallying cry of ‘reigning in Labor's debt’. There is substantial evidence that the advances made by older cohorts in earlier decades are not being achieved by those coming after them and, further, that substantial inequalities persist within the older as well as younger age groups (Daley and Wood Reference Daley and Wood2014; Kendig Reference Kendig, O'Loughlin, Browning and Kendig2017b).
A new era of avowed austerity was ushered in during the mid-1990s by the first of what eventuated as a series of Intergenerational Reports (IGRs). These reports, authored by Treasurers and Treasuries, made the argument that fiscal caution would need to be exercised with costly social and care programmes that might not be affordable into a future heavily influenced by demographic change (Commonwealth of Australia 2002, 2007, 2010, 2015). The political argument made by the Conservative government in 1996 was that social expenditure on older people (and other disadvantaged groups) would have to be restrained in order to spare future generations from onerous tax burdens and cutbacks on government programmes. The ‘intergenerational’ theme has been promulgated widely in the media, not only by Conservative political forces but also as an economic and fiscal necessity by powerful Treasuries and Finance departments. This dominant political narrative of fiscal restraint has continued notwithstanding changes of governments that have nonetheless maintained ongoing spending and deficits.
A range of comments on the IGRs have been raised in public policy debates. Commentators sympathetic to the interests of older people have ‘named’ the political and ideological imperatives behind the IGR reports and the risks of scapegoating older people for the consequence of population ageing (Kendig Reference Kendig2010; Woods and Kendig Reference Woods and Kendig2015). They have countered that the narrow fiscal issues could be addressed more constructively through positive actions such as enabling more labour force participation by older people and combatting ageism in the workforce (Australian Human Rights Commission 2015). Duckett (Reference Duckett2015) argues that the IGRs have missed the point on health spending and neglected further opportunities for constructive actions. Bessant, Emslie and Watts (Reference Bessant, Emslie and Watts2011) observe that the IGRs, with their focus on fiscal sustainability, have paid relatively little attention to fundamental matters of generational and distributive justice.
Australian policy debates on intergenerational equity have had similarities of rhetoric to those in the USA and UK but the policy context is very different, e.g. levels of national debt are far lower. Australia also has a more moderate trajectory of demographic ageing, attributable largely to continuing immigration, and largely uninterrupted economic growth since the 1991 recession. Indeed, the global Credit Crisis of 1997 raised concerns at the time that led to policy action to raise the pension and widen eligibility for those with private incomes and home-owners (Kendig et al. Reference Kendig, Wells, O'Loughlin and Heese2013). While older populations in Australia, the USA and other developed countries have comparable levels of income and health profiles (Kendig and Cannon Reference Kendig, Cannon, Kendig, McDonald and Piggott2016), important Australian differences are (compared to the USA) the less contentious racial, ethnic and social class divides; and (compared to European countries) fewer universal principles in taxation and services.
This paper investigates Australian population attitudes concerning intergenerational equity at two time-points: the period immediately following the international Credit Crisis (2009–2010) and five to six years later (2015–2017). Using similar questions at both time-points, the research was designed to detect the ways in which attitudes may have responded to the changing socio-economic and policy context outlined above. We report national survey data providing appraisals of the life-long economic prospects of several generations: the Baby-boom Cohort (born 1946–1964) relative to those born before 1946, Generation X (born 1965–1980) and Generation Y (born after 1980). The primary analytical focus is on attitudinal change by each of the birth cohorts which are posited to be sensitive to the particular lifespan transitions that they have been experiencing over this period. For example, the massive baby-boom cohort was moving into the 60+ age group at the time of the surveys and would have been exposed particularly to issues concerning retirement. Conversely, Generation Y, otherwise known as the ‘Millennials’, were entering adulthood and their life directions were being set by employment markets at the time. In addition to the age/cohort comparisons, we point to social differences in terms of gender, socio-economic resources, urban/rural areas and vulnerability in terms of health.
Methods
Study design and sample
The data for the present paper are drawn from the Australian Survey of Social Attitudes (AuSSA), a cross-sectional survey conducted biennially on a nationally represented sample of Australian adults aged 18 years or older; and is Australia's component of the International Social Survey Program (ISSP) (Australian Consortium for Social and Political Research Inc. 2015). The AuSSA contains several modules on various dimensions of social attitudes that are relevant to contemporary societal-level challenges. Earlier rounds of AuSSA also have examined Australian attitudes, e.g. Australian attitudes to inequality and redistribution (Saunders and Wong Reference Saunders and Wong2013). The data used for analyses for the present paper were extracted from the module on Attitudes to Ageing in Australia (AAA) designed by our research team and supported by the ARC-funded Centre of Excellence in Population Ageing Research (Kendig et al. Reference Kendig, O'Loughlin, Hussain, Heese and Cannon2015). Preliminary baseline findings were presented in Kendig et al. (Reference Kendig, O'Loughlin, Hussain and Cannon2017). The module was administered in the 2009–2010 survey (N = 1,525; response rate 33%) and the latest 2015–2017 survey rounds (N = 2,174; response rate 27%). The self-completion, mail-out collection explains why comparisons to the Census reveal some under-enumeration of non-English-speaking migrants and less-educated people in the surveys.
Measures
A range of socio-demographic questions are asked in AuSSA, ten of which are included in the analyses: age, gender, marital status, location of residence, education, employment status, occupational status, housing tenure, self-rated general health and self-rated societal status. Due to very small numbers of survey respondents identifying as Indigenous (i.e. of Aboriginal or Torres Strait Islander descent), no meaningful comparisons could have been drawn and therefore indigeneity was not used as a variable in the current analysis.
Outcome variables
Each of the two rounds of the AAA component of AuSSA contained several questions on perceptions of ageing ranging from intergenerational opportunities, discrimination in the workplace and other questions on perceptions of ageist attitudes. The first three outcome variables used in this paper were developed for the 2009–2010 survey and replicated in 2016–2017. The fourth on intergenerational conflict was replicated in both surveys from the ISSP Social Inequality Survey (ISSP Research Group 1989).
(1) Life-long opportunities for baby-boomers compared to younger people: ‘Each generation has different social and economic opportunities over their lives. How would you say the life-long opportunities for baby-boomers (aged 50 to 64 years [in 2009–2010]) compare to those for younger people today?’ (response categories: ‘better for baby-boomers’; ‘about the same’; ‘better for younger people’).
(2) Life-long opportunities for baby-boomers compared to those who had already retired: ‘How would you say the life-long opportunities for baby-boomers (aged 50 to 64 years [in 2009–2010]) compare to those for older people who have already retired?’ (response categories: ‘better for baby-boomers’; ‘about the same’; ‘better for the already-retired people’).
(3) Fair share of government benefits for older people: ‘Right now, do you think older people are getting more than their fair share, less than their fair share, or about their fair share of government benefits?’ (response categories: ‘more than their fair share’; ‘less than their fair share’; ‘about their fair share’; ‘don't know’).
(4) Intergenerational conflict: ‘In all countries, there are differences or even conflicts between different social groups. In your opinion, in Australia how much conflict is there between older people and younger people?’ (response categories: ‘strong conflicts’; ‘not very strong conflicts’; ‘no conflicts’; ‘can't choose’).
Analyses
The analyses comprised univariate and bivariate techniques; correlational matrices and multivariable logistic regression using the software SPSS version 24 (IBM Corp 2016). Ten socio-demographic characteristics were included in the current analysis to explore social variation: age, gender, marital status, location, education, employment status, occupational status, housing, self-reported general health and self-rated societal status (see Table 1).
Table 1. Sample characteristics in 2009–2010 and 2015–2017
Notes: Percentages that do not add up to 100 are due to rounding error. TAFE: technical and further education.
Before undertaking univariate analyses, we categorised and recoded some of the covariates. As per Table 1, age was categorised into four groups: young (born after 1980), middle (born 1965–1980), baby-boomer (born 1946–1964) and older (born before 1946). Marital status was categorised into two categories: ever been married and never been married. Education was categorised (based on years of formal schooling) into three categories: up to Year 12, technical and further (vocational) education (TAFE), and tertiary or higher education. Occupation, originally listed in categories as per standard definitions used by the Australian Bureau of Statistics, was compressed into three more manageable categories of managerial and professional, trades and clerical, and machinery operators and labourers. The variable ‘self-rated societal status’, originally applied in the 1987 ISSP survey, provided a basis for equivalency across people who were employed and those who were not in the labour force. It used a ten-point Likert ranking scale (1–10), with 1 being the lowest and 10 the highest. It was recoded into three broad categories of bottom (1–4), middle (5–7) and top (8–10).
To assess change across the two survey periods, a range of dummy variables were created, and statistical significance was tested using t-tests. To examine the variation in perceptions, outcome measures were recoded as dichotomous variables using a consensus-based approach of examining contrasting perceptions and opinions. For each of the four outcomes, the dichotomous variables were selected based on contrasts in opinions with more than 5 per cent change over time, and were as follows: (a) ‘better for baby-boomers’ and ‘better for younger people’; (b) ‘better for baby-boomers’ and ‘better for already-retired people’; (c) ‘about fair share’ and ‘less than their fair share’; (d) ‘no conflict’ and ‘strong conflict’. Only variables with values of less than 0.6 on a correlational analysis were included in the regression models. The logistic regression findings reported in the text were significant at p < 0.05. However, some statistically significant results were not included due to small cell sizes as this produces unstable estimates of odds ratios with very wide 95 per cent confidence intervals (CI) (Büttner and Muller Reference Büttner and Muller2011).
Results
Sample characteristics
The sample characteristics are summarised in Table 1. There were some differences in age and gender profile with a predominance of baby-boomers and older people in both survey rounds; and slightly more female respondents (57%) in the 2009–2010 survey, but no appreciable gender difference in 2015–2017. Approximately 75 per cent of respondents at both time periods were born in Australia (data not shown). Consistent with the residential pattern of the Australian population, the majority of survey respondents were in metropolitan areas. There were only minor occupational, employment and educational differences across the two survey periods, with a higher proportion of respondents having a tertiary education in the latest round compared to 2009–2010. Similarly, there were only small differences regarding housing tenure, with two-thirds of respondents being outright home-owners or purchasers at both times (see Table 1). The variable where major change was noticeable across the two survey periods was self-rated general health. In 2009–2010, about 28 per cent of respondents reported their health to be fair/poor compared to only 18 per cent in 2015–2017. Lastly, across both survey periods an important question in the AuSSA survey measured individuals’ self-rated societal status. At both survey periods almost two-thirds of the respondents ranked themselves in the ‘middle of society’ (72 and 66%, respectively). More noteworthy is that in 2009–2010 only 12 per cent ranked themselves in the top category of the scale compared to 22 per cent in 2015–2017 (see Table 1). Apart from sampling variation, it is also plausible that such a finding may have been influenced by the people who felt relatively less confident of their financial situation immediately after the international Credit Crisis.
Life-long socio-economic opportunities
There are two components to this domain which provide a general appraisal of life-long opportunities: baby-boomers compared to younger people, and baby-boomers compared to older retired people. Overall, more respondents perceived that life-long opportunities were better for baby-boomers than for either younger or already-retired people (see Figure 1). In 2009–2010, a similar proportion of people thought the opportunities were better for baby-boomers and for younger people (39 and 38%), while in 2015–2017 there were more people who thought the opportunities were better for baby-boomers (49%) than for younger people (27%). This change over time was greatest amongst the youngest cohort who were the least likely to think baby-boomers had better opportunities in 2009–2010 (34%) and were the most likely to think so in 2015–2017 (58%) (see Figure 1; Table 2). At both time periods, very few people thought retired people (13 and 17%, respectively) had better opportunities than baby-boomers (58 and 49%, respectively). Overall, there was a slight decline in the proportion of respondents who thought baby-boomers had it better, with the largest change found amongst the baby-boom cohort itself (from 61 to 46%) (see Figure 1; Table 3).
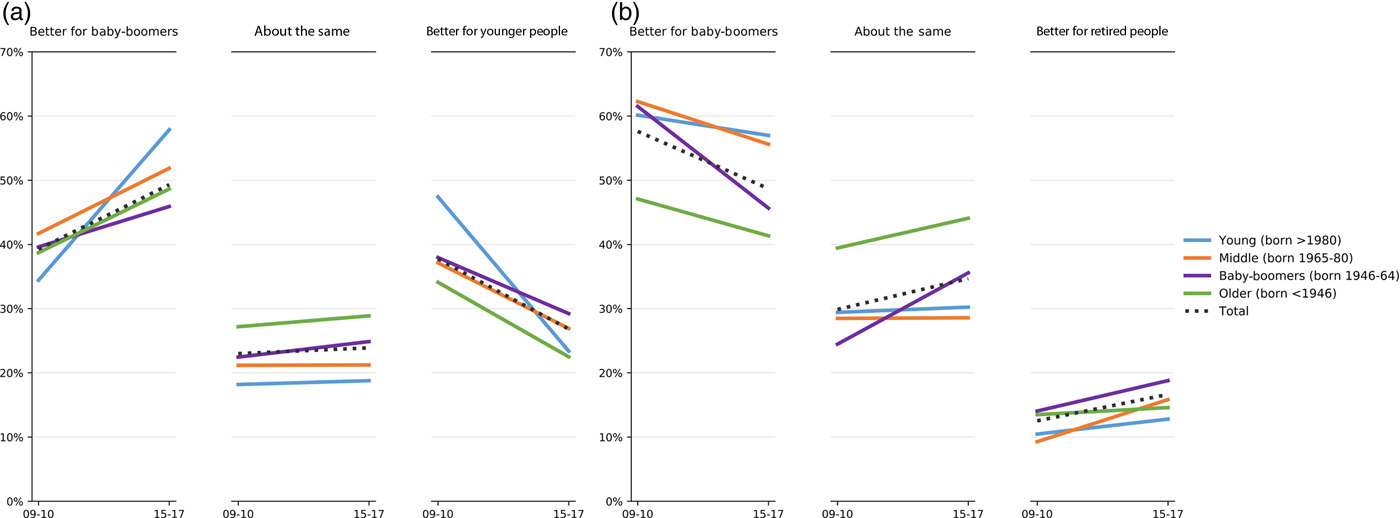
Figure 1. Life-long opportunities of baby-boomers compared to (a) young people or (b) already-retired people.
Table 2. Sub-group responses to the perceived life-long opportunities of baby-boomers compared to younger people and change between the two time periods (2009–2010 and 2015–2017)
Notes: Percentages that do not add up to 100 are due to rounding error. TAFE: technical and further education.
Significance level: * p < 0.05.
Table 3. Sub-group responses to the perceived life-long opportunities of baby-boomers compared to older already-retired people and change between the two time periods (2009–2010 and 2015–2017)
Notes: Percentages that do not add up to 100 are due to rounding error. TAFE: technical and further education.
Significance level: * p < 0.05.
Compared to their respective counterparts at both time periods, a higher portion of people with a tertiary education, and those who were managers and professionals, thought that the life-long opportunities were better for baby-boomers than for younger people or those who had already retired. A larger portion of those with self-reported excellent health and those who perceived their societal status to be the highest thought that the life-long opportunities were better for baby-boomers than for already-retired people; especially when compared to those with fair/poor health and those at the bottom-end of the societal scale (see Tables 2 and 3).
In the following section, we present results of the multivariable logistic regression for baby-boomers compared to younger people, and then in relation to those who had already retired.
In the multivariable analyses for the 2009–2010 survey round, the significant variables were education, home-ownership and self-rated societal status. Respondents with high school or vocational education compared to tertiary education reported a statistically significant higher adjusted odds ratio (AOR) of perceiving better life-long opportunities for younger people compared to baby-boomers (AOR = 1.8, 95% CI = 1.2–2.7 and AOR = 1.7, 95% CI = 1.2–2.4, respectively). Similarly, compared to home-owners (outright) those with a mortgage reported better life-long opportunities for younger people compared to baby-boomers (AOR = 1.7, 95% CI = 1.2–2.4 and AOR = 2.2, 95% CI = 1.2–4.1, respectively). In contrast, those who rated themselves at the bottom of the societal scale perceived the opportunities to be less for young people (AOR = 0.6, 95% CI = 0.4–0.8). The findings for 2015–2017 were in a similar direction but the statistically significant covariates were gender, with females having higher odds of perceiving better life-long opportunities for younger people (AOR = 1.5, 95% CI = 1.1–2.1), and housing tenure, with renters having higher odds of perceiving better life-long opportunities for younger people (AOR = 1.8, 95% CI = 1.1–3.1) compared to home-owners (outright).
In the regression model on life-long opportunities for baby-boomers compared to those who had retired, the statistically significant variables for the 2009–2010 survey period included age, gender and self-rated societal status. The oldest group, i.e. those aged 65 years or older, had higher odds of considering life-long opportunities to be better for those already retired compared to baby-boomers (AOR = 1.9, 95% CI = 1.1–3.4). Females were also likely to report similar results. Those who ranked themselves at the top of the societal status showed lower odds ratios (AOR = 0.3, 95% CI = 0.1–0.6), indicating that compared to baby-boomers those who had already retired were less likely to have perceived better life-long opportunities. For the 2015–2017 survey period, similar trends were observed but the statistically significant variables included age. Younger and middle-aged respondents both had lower odds of reporting better life-long opportunities for those already retired compared to baby-boomers (AOR = 0.4, 95% CI = 0.2–0.8 and AOR = 0.5, 95% CI = 0.3–0.9, respectively).
Fair share of government benefits for older people
At both time periods (2009–2010 and 2015–2017), a majority of respondents thought older people were getting less than their fair share of government benefits (60 and 53%, respectively). However, the proportion within each age cohort who thought older people were getting less than their fair share was lower in the 2015–2017 round. There was a noticeable difference between the older cohort and the other three cohorts at both time periods. Older people were the least likely cohort to think they were getting less than their fair share (48 and 43%, respectively) (see Figure 2). Men, those with tertiary education, managers and professionals, and/or those who were at the top-end of the self-rated societal status were less likely than their respective counterparts to perceive that older people were getting less than their fair share of government benefits (see Table 4).
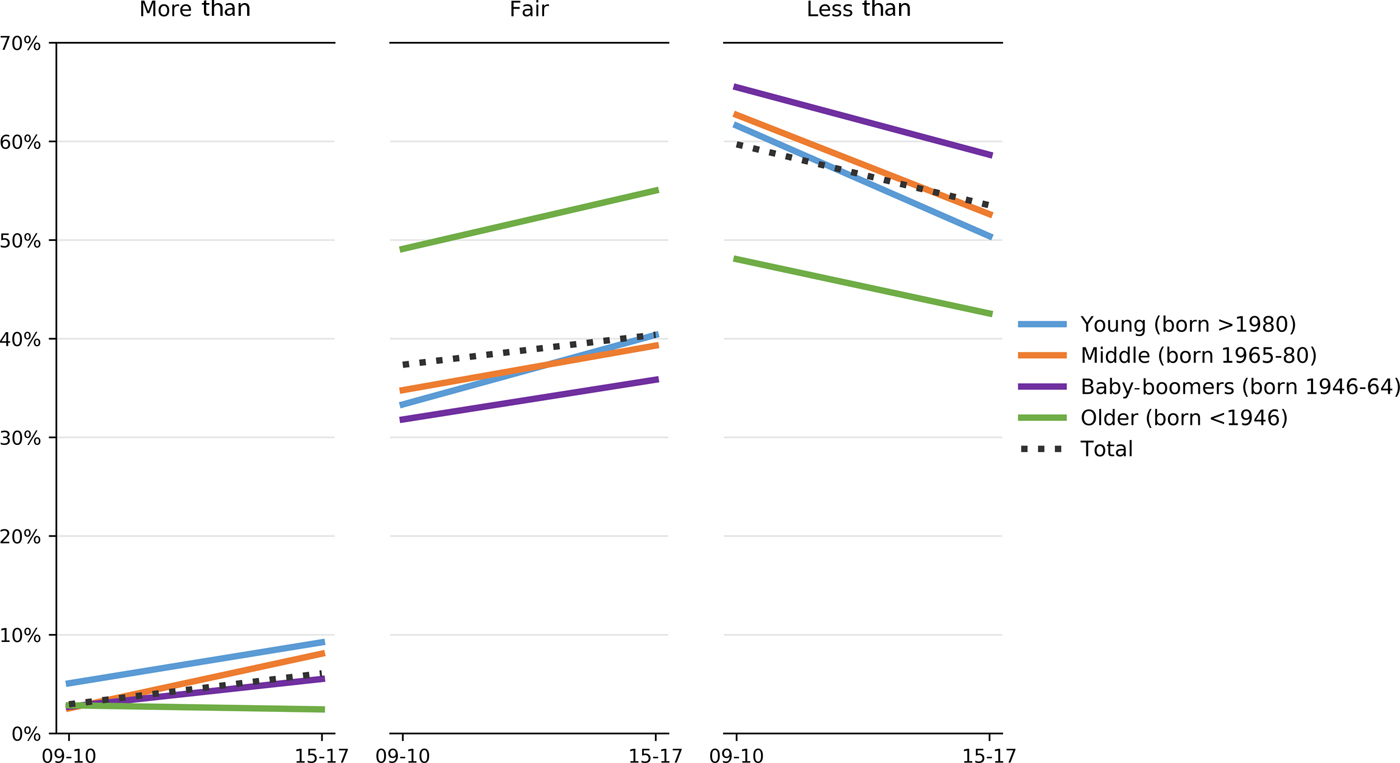
Figure 2. Older people's perceived share of government benefits.
Table 4. Sub-groups response to the perceived fairness of older people's level of government benefits and change between the two time periods (2009–2010 and 2015–2017)
Notes: Percentages that do not add up to 100 are due to rounding error. TAFE: technical and further education.
Significance level: * p < 0.05.
For the first survey period (2009–2010), the statistically significant variables in the multivariable analyses (‘about fair share’ versus ‘less than their fair share’) include age, education, housing tenure and self-rated societal status. Respondents who were middle-aged (AOR = 1.6, 95% CI = 1.0–2.7) or baby-boomers (AOR = 1.9, 95% CI = 1.3–2.8) perceived older people to be getting less than their fair share of government benefits. Similarly, those with Year 12 and vocational education also showed higher odds of considering older people to be getting less than their fair share compared to those with tertiary education (AOR = 2.2, 95% CI = 1.5–3.2 and AOR = 1.7, 95% CI = 1.2–2.4, respectively). Respondents who had a mortgage (AOR 1.6, 95% CI = 1.2–2.3) were also more likely to think so compared to those who owned their house (outright). On the other hand, those who perceived themselves at the top-end of societal status were less likely than those in the middle to consider that older people were getting less than their fair share (AOR = 0.6, 95% CI = 0.4–0.9). For the 2015–2017 survey data, similar results were observed for age (middle: AOR = 2.3, 95% CI = 1.2–4.5; baby-boomers: AOR = 2.1, 95% CI = 1.2–3.5), education (Year 12: AOR = 2.2, 95% CI = 1.4–3.4; vocational education: 1.6, 95% CI = 1.1–2.4) and housing tenure (mortgage: AOR = 1.5, 95% CI = 1.0–2.3).
Intergenerational conflict
At both time periods (2009–2010 and 2015–2017), a minority of respondents (26 and 20%, respectively) perceived strong conflict and a relatively larger proportion of respondents perceived not very strong conflict between older and younger people (55 and 61%, respectively). The proportion perceiving no conflict was relatively stable (16 and 12%, respectively) but these overall figures mask age and cohort effects. Younger people were the most likely to perceive strong conflict at both times (31 and 30%, respectively), while the baby-boomers had the largest decline in perceived strong conflict (from 27 to 18%) (see Figure 3). Respondents with self-reported fair/poor health and those who ranked themselves in the lowest societal status were more likely to perceive strong conflict than those with better health or higher societal standing (see Table 5). Statistically significant variation was seen in the difference by marital status for the two survey rounds. Respondents in the category ‘never married’ reported more perceived intergenerational conflict than those in the category ‘ever been married’ (Table 5).
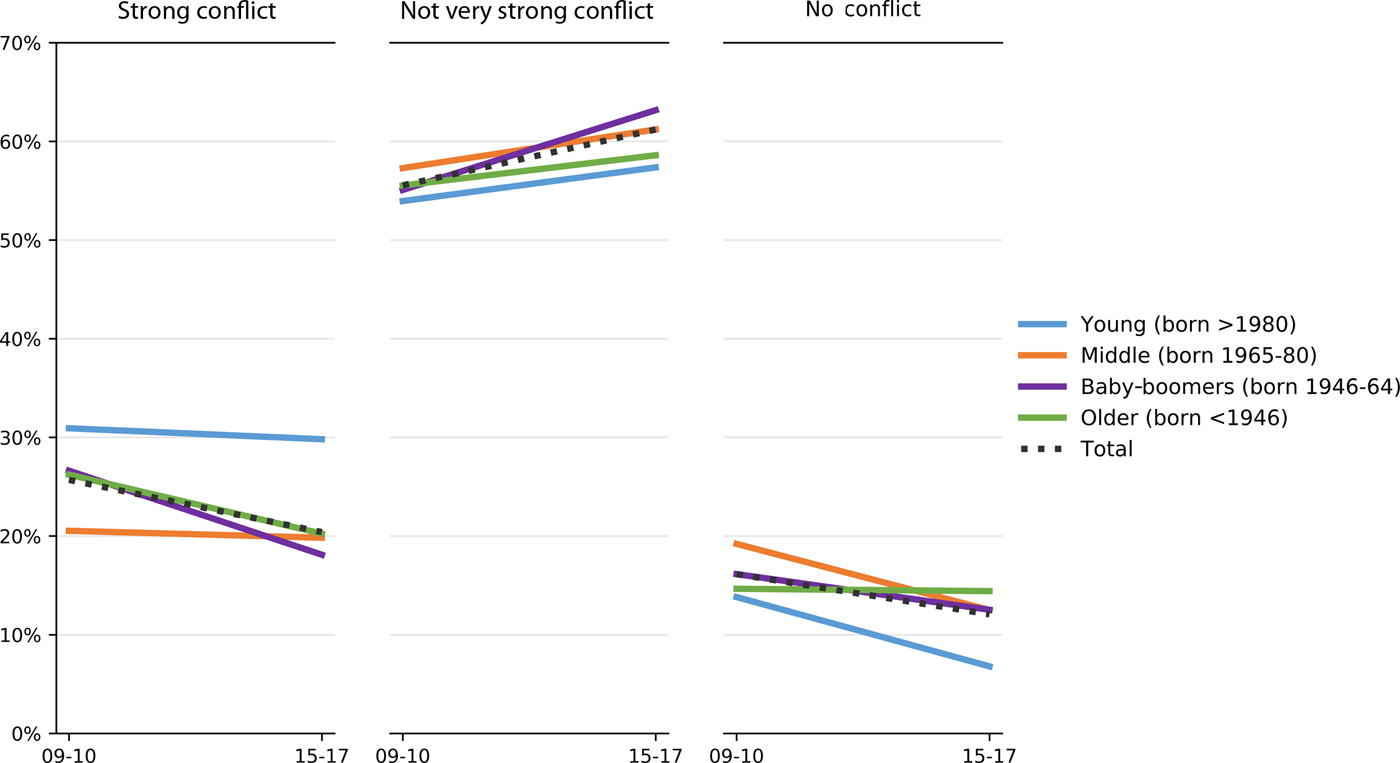
Figure 3. Perceived intergenerational conflict between older and younger people.
Table 5. Sub-groups responses to the perceived level of intergenerational conflict between older and younger people and change between the two time periods (2009–2010 and 2015–2017)
Notes: The percentage values for the outcome variable is less than 100 due to a very small number of respondents opting for a ‘don't know’ option (not shown). TAFE: technical and further education.
Significance level: * p < 0.05.
In the 2009–2010 survey round, the only statistically significant variables in the multivariable analyses (‘no conflict’ versus ‘strong conflict’) were marital status, self-rated health and self-rated societal status. Respondents who were never married reported the perception of more conflict (AOR = 1.9, 95% CI = 1.0–3.5). Those with fair/poor health reported higher odds of perceived conflict compared to those with good health (AOR = 1.7, 95% CI = 1.1–2.8), while respondents who perceived themselves to be in the top third of societal status were less likely to perceive conflict compared to those who reported being in the mid-range (AOR = 0.5, 95% CI = 0.3–0.9). In the 2015–2017 survey data, statistically significant AOR was observed for region of residence and self-rated societal status. Respondents in rural areas were less likely than those in regional areas to perceive strong conflict (AOR = 0.3, 95% CI = 0.1–0.9). The odds of perceived conflict for those in the top third of societal scale were lower than those in the mid-range (AOR = 0.4, 95% CI = 0.2–0.8).
Discussion
Our AAA survey was carried out nationally at times when intergenerational budget issues had high visibility in Australia: the first round was conducted in 2009–2010 after three years of policy responses to the international Credit Crisis in 2007; and then the second round in 2015–2017 during an economic slowdown. Over the last decade, the national media in Australia has had widespread coverage of ongoing policy responses to the 2007 Credit Crisis, further IGRs in 2010 and 2015, annual Budget announcements, and several election campaigns between 1998 and 2016. The Grattan Institute, an independent think-tank, has documented the economic disadvantages of recent cohorts relative to those now in later life (Daley and Wood Reference Daley and Wood2014), as well as the advantaged tax and policy treatment of older people (Daley et al. Reference Daley, Coates, Young and Parsonage2016). Further, unfunded expenditure and ongoing tax subsidies have had major benefits for the current cohort of people aged 65 years and over, especially so for those who had accumulated substantial wealth in owning their homes and superannuation, while the ongoing debt would fall on younger people. These basic facts have been well known in specialised policy circles (e.g. Productivity Commission 2013), but were not well publicised nor understood by the general public.
Our findings on intergenerational attitudes can be interpreted in the context of a range of policy issues and recent social change including the ageing of the baby-boom cohort into later life, with its substantial superannuation wealth among a minority and outright home-ownership among the majority. These advantages in the market for the baby-boom cohort earlier in their life were accentuated by policies including tax-free gains from massive house price inflation and minimally taxed superannuation accumulations. Conversely, younger people (more recent cohorts) have been entering employment and property markets that had become far less favourable for these new entrants in the Millennial cohort (Cannon and Kendig unpublished). With the growing intersection of social class and ageing, disadvantage is extending and deepening (Smith and Hetherington Reference Smith and Hetherington2016). There has not been much policy appreciation in Australia of lifespan influences on age-based inequalities, which can be set early in life with advantage or disadvantage accumulating over the lifespan (Dannefer Reference Dannefer2003; Kendig Reference Kendig, O'Loughlin, Browning and Kendig2017b).
Notable increases were evident from 2009–2010 to 2015–2017 in the proportions who felt that opportunities were better for baby-boomers than for younger people; this perception was especially strong among the youngest group. Interestingly, there was a decline over time in the proportions reporting better opportunities for the baby-boomers compared to those who had already retired (Figure 1b). These findings suggest increasing sensitivity and growing public questioning of the characterisation of ageing people as a uniform group in a position of comparative need. Nonetheless, a majority continued to believe that life-long opportunities have been better for baby-boomers than for either the older or younger cohorts at the time.
A majority of respondents persisted in their view that older people were receiving less than their fair share of government benefits; interestingly, these beliefs were strongest among the baby-boomers (perhaps aware of needs in their parents’ generation) and least among the older people themselves (who were basically satisfied with their lot). It would appear that the comparisons across age groups are made in the context of implicit assumptions of older people as a group being disadvantaged relative to the overall population. The findings clearly do not lend support for government propositions that benefits to older people should be cut in order to meet budget targets or to distribute more to younger groups. They do indicate the popular base behind parliamentary opposition to government proposals to limit expenditure on older people in order to meet budget targets (Daley and Wood Reference Daley and Wood2014).
A majority of respondents perceive that intergenerational conflict is not very strong (60%) or there is no intergenerational conflict (15%). Moreover, over the seven years between the surveys, the proportions reporting not very strong conflict has increased. This suggests that the government's strategy of invoking intergenerational equity arguments as a rationale for cutting social expenditure has had limited impact. However, the youngest age group had the highest proportion reporting strong conflict – approximately 30 per cent for both survey times. A strengthening of these views along with cohort succession could see a backlash, particularly against government support for those older people who have significant private means and pay little tax (Daley et al. Reference Daley, Coates, Young and Parsonage2016). Increasing recognition of the inequalities in inherited wealth would attract greater recognition to the social divides between advantaged and disadvantaged lineages but issues of inheritance taxation have largely been beyond the scope of current political debate.
Variations
As a general pattern across the research questions, one finds a more favourable view of older people among women and among people who themselves are vulnerable in terms of their income, health or other limitations; that is, there appear to be sympathetic rather than competitive views among vulnerable people across the generations. On the strength of bonds across the generations, these observations remind us that many core orientations towards generational relations are grounded deeply in attitudes and relationships that are resistant to change. For the population as whole, attitudes change slowly in association with changes of social position, personal interests, and prevailing policy and socio-economic change as people progress through their lifespans. Future rounds of the AuSSA survey could provide opportunities to investigate stability and change of cohorts’ attitudes as they grow older and experience new social and policy environments. Qualitative research could provide insights into the variations, strategies and meanings of these changes (O'Loughlin, Humpel and Kendig Reference O'Loughlin, Humpel and Kendig2010).
We might speculate as to the reasoning behind the overall sympathetic attitudes to older people relative to other age groups. In contrast with our social difference from other vulnerable groups (e.g. race, ethnicity), we can all identify with grandparents and other older relatives in our past as well as continuing lives and also anticipate our own vulnerability in the future. In light of these fundamental social bonds, it is understandable that governments would face major struggles to foster generational or cohort conflict related to age. Ironically, there is a substantial risk that older people's capacities will be underestimated by categorical sympathy with the consequence of ageism in the workforce and other spheres of life (Sargent-Cox Reference Sargent-Cox2017). Such perverse outcomes would be likely to limit the contributions of older people and unnecessarily aggravate the pressures of constructively adapting to the opportunities of an ageing society (Kendig Reference Kendig, O'Loughlin, Browning and Kendig2017b). With increasing diversity within as well as between age groups, there is every likelihood that action on ageing vulnerabilities and lifespan accumulations will need to be treated as different but related to social processes that are central considerations in assessing social change and consequent inequalities. In the interests of people at all ages, it is important to address the ‘cultural lag’ inherent when attitudes and social structures inaccurately equate age and need (Kendig Reference Kendig, O'Loughlin, Browning and Kendig2017a; Riley, Kahn and Foner Reference Riley, Kahn and Foner1994). Levy (Reference Levy2017) conceptualises an age stereotype paradox and the need for a range of social actions that promote positive age stereotypes in line with the increasing capacities of ascendant cohorts of older people.
Limitations
Although the present paper has strengths, including using similar questions from two nationally representative survey samples thus allowing for a meaningful comparison over time, it also has limitations. The relatively low response rate from the postal questionnaire, especially for the latest round, suggests that caution should be taken in inferring population estimates from the findings. Further, as with any survey using a self-completion format, it is possible that there could be differential non-response rates from people with less education, non-English-speakers and others with limited literacy. With regards to ethnicity, the majority of respondents were Australian born or came from English-speaking countries. Therefore, we have not analysed migration differences due to the small sample size of respondents who are non-English-speakers. Finally, views on the tax benefits of home-ownership and superannuation were not explored in the baseline questions because pilot testing for the 2009–2010 survey showed they were not widely understood by the general public. Furthermore, these issues cannot be adequately explored without including a raft of questions to allow respondents to provide both quantitative and qualitative responses. The ‘self-rated societal status’ variable proved to be particularly useful as a summary measure for making comparative appraisals across age cohorts and social groups at different stages of life.
Conclusion
The attitudinal findings reported here show the Australian public perceives the country is at an historic turning point in that recent and future generations are expected to have relatively worse economic prospects. The Millennial cohort is thought to be relatively disadvantaged, while the baby-boom cohort is recognised for the lifelong advantages accrued, particularly during the favourable employment and housing markets of recent decades. Nonetheless, the public largely retains a sympathetic view of older people as not having a fair share of government benefits, notwithstanding available evidence of the growing numbers of tax-advantaged home-owners and superannuants at older ages. In broad terms, more sympathetic views of older people as a whole continue among women and groups who themselves are rendered vulnerable in terms of their health and social resources. Overall, the government's arguments for expenditure restraint, as presented in the IGRs, do not appear to be very consistent with the attitudes reported here. While there has been limited public concern for intergenerational inequity or conflict, public discourse is beginning to shift in line with the declining life prospects of younger cohorts along with the increasing housing and superannuation wealth of advantaged older people.
Acknowledgements
We would like to acknowledge Betsy Blunsdon and Adam Zammit at ACSPRI for their support in the collection and provision of the Australian Survey of Social Attitudes (AuSSA) 2015–17 data. Lisa Cannon was affiliated with CEPAR and the Australian National University until recently.
Declaration of contribution of authors
H.K. conceived of the study and wrote drafts of the introduction and discussion; R.H. with L.C. led the statistical analyses and writing of the findings; and K.O'L. contributed in establishing the study and critically reviewing the draft paper.
Funding
Our Attitudes to Ageing in Australia (AAA) study is being conducted with the support of the ARC Centre of Excellence in Population Ageing (CEPAR; CE110001029). The current paper continues on from our CEPAR working paper (Kendig et al. Reference Kendig, O'Loughlin, Hussain, Heese and Cannon2015), which reviews the methodology and examines the 2009–2010 survey data.
Conflict of interest
The authors declare no conflicts of interest.


 Open access