


1. Introduction
Ice mass visco-plastic flow occurs in response to gravity and subsequent internal stresses, as formulated for isotropic ice by Nye (1957) and Glen (1958). The overall deformation state can generally be described as a combination, in varying degrees, of pure and simple shear (Reference Budd and JackaBudd and Jacka, 1989; Reference PatersonPaterson, 1994), depending on the region and depth considered (Reference AlleyAlley, 1992; Reference Gagliardini, Gillet-Chaulet, Montagnat and HondohGagliardini and others, 2009). The (grain) texture and (c-axis) fabric evolution associated with these mechanisms when strain develops is controlled, on the one hand, by the processes of plastic deformation, subgrain rotation and recrystallization and, on the other hand, by the flow and stress regime (Reference DuvalDuval, 1981; Reference Azuma and HigashiAzuma and Higashi, 1985; Reference Budd and JackaBudd and Jacka, 1989; Reference PatersonPaterson, 1994). As deformation proceeds, anisotropy strengthens owing to the favored motion of dislocations along crystal basal planes, displaying a series of symmetry stages well described in the literature (Reference ShumskyShumsky, 1958; Reference DuvalDuval, 1981; Reference Azuma and HigashiAzuma and Higashi, 1985; Reference Budd and JackaBudd and Jacka, 1989; Reference AlleyAlley, 1992; Reference Thorsteinsson, Kipfstuhl and MillerThorsteinsson and others, 1997). This flow-induced anisotropy renders Nye– Glen’s ice flow relation inadequate for predicting accurately the dynamics of ice masses, as it does not account for the effects of microstructure on creating a differential visco-plastic response to shear stress in the ice body (Reference Castelnau, Duval, Lebensohn and CanovaCastelnau and others, 1996; Reference Gagliardini, Gillet-Chaulet, Montagnat and HondohGagliardini and others, 2009). Past a certain amount of shear stress (typically of the order of 0.1 MPa), the multiplication of subgrain boundaries (‘polygonization’ regime) starts to counteract the, until then, predominant effect of grain growth on texture and fabric evolution (traditionally called ‘normal grain growth’ regime) (Reference Gow and WilliamsonGow and Williamson, 1976; Reference Herron and LangwayHerron and Langway, 1982; Reference Budd and JackaBudd and Jacka, 1989; Reference Thorsteinsson, Kipfstuhl and MillerThorsteinsson and others, 1997). For ice that has not been subject to major phases of annealing (which is typically the case in the uppermost regions of polar ice masses), polygonization leads to a grain-size reduction owing to an enhanced splitting rate of older grains. In terms of fabrics, either a single-pole or a small girdle fabric develops depending on the flow pattern, following a general trend of c-axis rotation towards the compression axis (Reference DuvalDuval, 1981; Reference Azuma and HigashiAzuma and Higashi, 1985; Reference Budd and JackaBudd and Jacka, 1989). With increasing stress, i.e. getting deeper in the ice body or in the bedrock vicinity, temperature, grain-boundary energy or stress gradients generally intensify. Grain size can then coarsen abruptly, revealing the importance of recrystallization and softening processes, and an interlocking texture associated with a dispersed or multiple-maxima fabric is often formed in this case (Reference KambKamb, 1959; Reference Gow and WilliamsonGow and Williamson, 1976; Reference Herron and LangwayHerron and Langway, 1982; Reference Budd and JackaBudd and Jacka, 1989; Reference Thorsteinsson, Kipfstuhl and MillerThorsteinsson and others, 1997; Reference Durand, Perrson, Samyn and SvenssonSamyn and others, 2008). Discontinuous recrystallization (DR) is active in this regime and is characterized by a selective growth of favorably oriented grains, to the detriment of the remainder of the matrix (as opposed to continuous recrystallization (CR), where the deformed texture is preserved) (Reference Cahn, Cahn and HaasenCahn, 1983; Reference Humphreys and HatherlyHumphreys and Hatherly, 1995; Reference Stöckhert and DuysterStöckhert and Duyster, 1999). The DR temperature domain is typically above –108C, which corresponds to the transition between ‘temperate’ and ‘cold’ ice. Above this temperature, an increase in both creep activation energy and liquid water content is observed (Reference DuvalDuval, 1977; Reference WeertmanWeertman, 1983; Reference PatersonPaterson, 1994), causing a change in the grain boundary structure (Reference HookeHooke, 2005).
Recrystallization and strain localization processes have important implications for the modelling of ice mass flow and for the interpretation of paleoclimate, as stratigraphical correlations in the ice body may be affected (Reference Budd and JackaBudd and Jacka, 1989; Reference CastelnauCastelnau and others, 1998; Reference Durand, Perrson, Samyn and SvenssonDurand and others, 2008). However, no unequivocal indicator has been found yet to clearly distinguish between the separate effects of CR and DR regimes on fabric and textural patterns. Moreover, there is no clear understanding of the c-axis orientation of newly nucleated or recrystallized grains under deformation. The common view about strain-induced recrystallization is that grain nuclei grow in the early formation stages with their basal planes parallel to the plane of maximum shear deformation (e.g. Reference SeligmanSeligman, 1941; Reference PatersonPaterson, 1994; Reference HookeHooke, 2005). However, this view is based on limited theoretical and experimental considerations (e.g. Reference KambKamb, 1959), and physical description and validation of the process are still lacking. A larger role of grain boundary nucleation and rotation processes is to be expected owing to the high plastic anisotropy of ice (e.g. Reference Humphreys and HatherlyHumphreys and Hatherly, 1995). In order to contribute to this body of research, we present here three newly developed shearing techniques in different confined geometries. Two of these methods are specifically intended to provide constant strain rate. A series of shear tests on mono-and polycrystalline ice aggregates is discussed to illustrate the performance and advantages of the methods.
2. Methods
2.1. Sample preparation and analysis
It is important to adapt the shape of the samples to the type of experiment carried out. As noted by Budd and others (2013), the most suitable sample shapes for shear tests confined in transverse directions are long rectangular prisms with the elongation in the direction of shear. Such sample shapes were produced here using a bandsaw and a microtome, this last step being completed to smooth the sample faces. Artificial, bubbly ice was grown from a mixture of ice powder and ultrapure water to produce our polycrystalline specimens, following the suction/compression method described by Azuma and others (2012). The monocrystalline specimens were made using a modified version of Czochralski’s crystal growth method (Reference Higashi and OguroHigashi and Oguro, 1967). A chamber temperature of –5°C was selected for all our experiments to favor the conditions generally observed when DR occurs.
For each sample, textures and fabrics were examined directly on completion of the experiment, from the surface of a 5 mm-thick section cut parallel to the long axis of the sample, along its front face. A differential interference microscope (Olympus Bx51; 10× lens), controlled by a manual X-Y stage, was used to archive and map the microstructures. Several dozen images were taken of each sample in order to obtain a representative overview of the grain fabric and texture. The grain boundary networks were revealed from an assemblage of cross-polarized images using an edge detection filter, and parameters such as grain size, aspect ratio and elongation direction were analyzed with image-processing software (Image-Pro Plus; Media Cybernetics). Grain size was determined by converting the measured grain cross-sectional area to the diameter of an equal-area circle. Crystal orientation measurements were performed using the ‘etch pit method’ described by Higuchi (1958) and Matsuda (1979), i.e. by measuring the angles and dimensions, under the differential interference microscope, of characteristic grooves derived from the hexagonal geometry and generated by the application and evaporation of a polyvinyl formal solution on smoothed ice surfaces. In this method, only the orientation of grains at the surface of the section is determined. The c-axis angle resolution is of the order of 5°.
2.2. Deformation apparatuses
In order to minimize heat loss and help maintain a constant target temperature during the freezing process, the three environmental chambers of the deformation apparatuses were arranged inside individual chest freezers and further insulated with Styrofoam. At least two separate thermistors were placed inside each individual chest freezer to continuously monitor and control the temperature inside the deformation cells and around the ice specimen. The cooling efficiency in the environmental chambers was increased using small electronic fans and heating bulbs, ensuring temperature fluctuations of no more than ±0.1°C. The sample displacements and the loads applied were measured using high-precision linear variable differential transformers and load cells, respectively.
As will be seen later, one of the major benefits of the three following techniques, when compared to classical methods, is that as the sample is compressed and accumulates strain during its deformation, a continuous overview of the c-axis and texture evolution along the sample is made possible from one single experiment, without the need to stop the experiment, or to remove or manipulate the sample. Another major benefit of these techniques is that the flow geometry imposed on the specimen is governed directly by the shape of the mold and does not imply the action of separate moving elements. This ensures a better control on the flow pattern and, therefore, a better experimental reproducibility.
2.2.1. U-shaped simple shear apparatus
A U-shaped deformation apparatus (Fig. 1) was designed for applying simple shear strain up to >100% and for deforming ice at a constant extrusion speed. For ease of shaping, manipulation and maintenance, the mold is made of an aluminum alloy and of acrylic glass, a transparent, lightweight and shatter-resistant thermoplastic. The mold dimensions are 300 mm × 200 mm × 68 mm, the channel cross section is 20 mm × 20 mm, the radius along the center line is 40 mm and the deformation path is ~500 mm long. The apparatus can host samples of up to several tens of cm length and of 20 mm × 20 mm cross-sectional area.
At the start of the experiment, the ice sample is pushed, at a constant rate, by a platen through the straight part of the mold (Fig. 1a). Motion in the extrusion channel is provided by a variable-speed motor coupled to a linear head (Fig. 1b). Once forced into the curved section of the mold, and under the action of a toothed wheel rotating at a constant speed (Fig. 1c), the ice sample undergoes a rigid-body rotation until the whole sample leaves the curved chamber. The toothed wheel augments this rotation at the inner radius, thereby creating a velocity gradient within the sample responsible for the simple shear. The rotation speeds of the head and of the wheel must be the same to ensure steady shearing. Whereas friction is required between the ice and both the wheel and the outer channel wall for shearing, lubrication at the contact zones between the ice and the upper and lower mold surfaces is required, which is done with silicone oil.

Fig. 1. U-shaped simple shear apparatus. (a) Schematic drawing of the mold. (b) Picture of the toothed wheel and ice specimen. The rotation direction of the drive wheel is clockwise. The horizontal stripe in the upper part of the ice sample is a shear deformation marker within an undeformed region of the specimen. (c) Schematic drawing of the whole system, including the motor and pulleys. (d) Wheel configuration (C is the center of rotation).
The displacement through time of the ice sample across the channel is given by
where V is the wheel speed, which is equal to the extrusion speed, dt is time increment, R 1 is the inner curvature radius, R 2 is the outer curvature radius, and d1 and d2 are the angle increments of rotation of R 1 and R 2 for dt, respectively (Fig. 1d). Hence
where dγ is a small increment of shear strain.
Therefore, the shear strain and the shear strain rate can be obtained, respectively, by
where R is the distance of a given position from the center of rotation, and
2.2.2. Spiral-shaped bending apparatus
Constructed of the same materials as above, the spiral-shaped bending apparatus (Fig. 2) consists of a mold with dimensions 600 mm × 340 mm × 60 mm. The deformation path is ~500 mm long. The apparatus can host samples of up to several tens of cm length. The sample cross-sectional area is 20 mm ×20 mm. The spiral shape of the apparatus is designed to maintain a monotonic compression/extension strain pattern at a constant extrusion rate in the course of flow through the chamber. For this purpose, the shape of the curved portion of the spiral (Fig. 2a) was chosen to be logarithmic (‘Bernouilli spiral’). The decreasing radius of the spiral causes bending to the initially straight sample as it is pushed through the channel. The bending induces an increasing amount of tension in the sample from half-width to the outside radius, with the tension axis being tangent to the instantaneous motion direction. Similarly, from half-width towards the inner radius, the sample is subject to an increasing amount of compression. Sample motion through the extrusion channel is provided by the same linear electric motor as in the method above (Fig. 2b). Silicone oil is used as lubricant between the ice and the upper and lower mold surfaces.
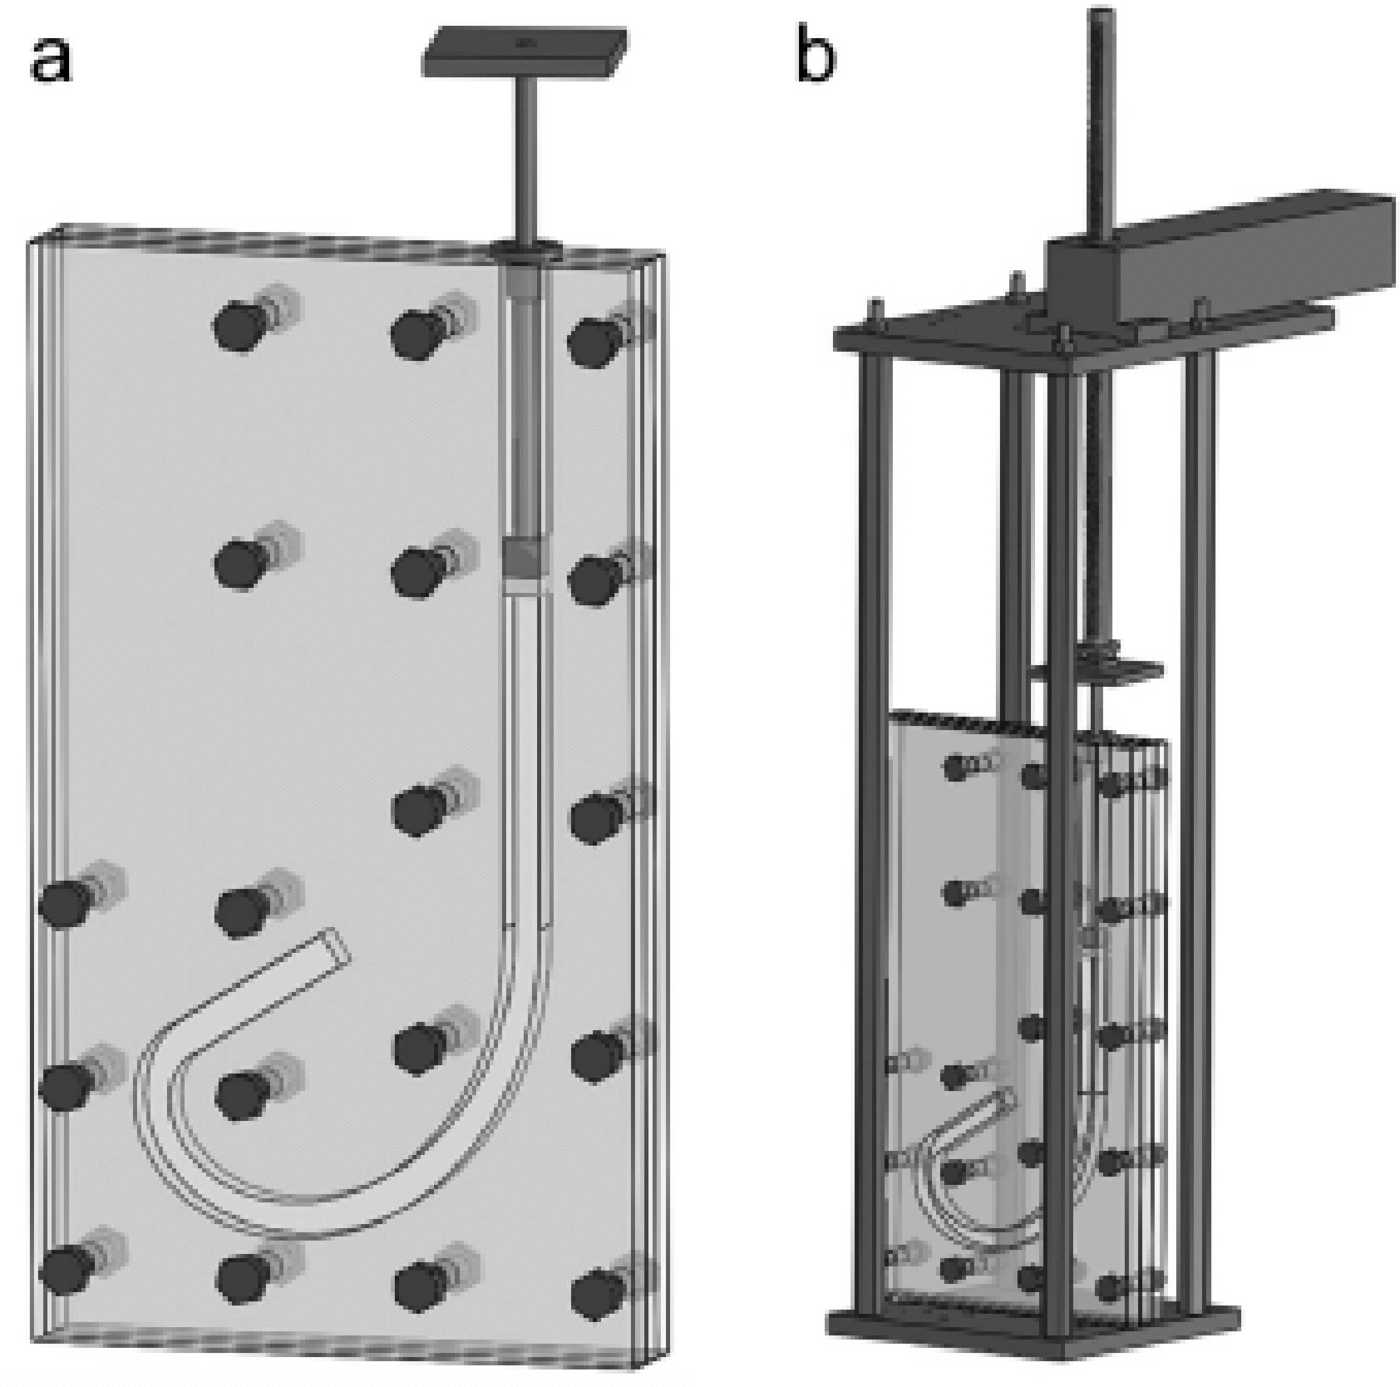
Fig. 2. Spiral-shaped bending apparatus. (a) Schematic drawing of the mold. (b) Schematic drawing of the whole system, including the motor.
The curvature radius R of the spiral is given, in polar coordinates, by (Fig. 3)
where B is a constant (here >1) and θ is the rotation angle.
Due to mass and volume conservation during plastic deformation, the length of the center line (dl) does not change after bending:
whereas the lengths dl 1 and dl2 of the inner and outler curve become, respectively,
where R 1 and R 2 are the inner and other radii, and δ is half the channel width.

Fig. 3. Schematics of the spiral configuration. The spiral-shaped channel is displayed in bold in the upper panel. The lower panel is a blow-up across the channel width.

Fig. 4. Pure shear apparatus. (a) Schematic drawing of the mold and the ice specimen at mid-deformation course. (b) Mold configuration. The dashed straight lines along the long axis of the mold interior represent the outer limits for idealized flow conditions. Square insets represent the stress patterns (given by the arrows) and shear planes (given by the dashed lines) in the mold.
Therefore, the shear strain ε, in tensile or compressive form, is related to the curvature radius and to the channel width by the relation
From Eqns (5) and (8), the strain rate ![]() is derived:
is derived:
where the extrusion velocity is
and the displacement is
One should note that in our current setting, since the initial extrusion velocity V 0 is kept constant, strain rate along the channel cannot be constant owing to the channel logarithmic curvature. Strain rate changes at each point along the trajectory in this case. However, in the future an improved way of achieving a constant strain rate could be by varying (exponentially) the speed of the actuator V 0 in accordance with the changing path angle. The major benefits with this arrangement would be twofold: not only would every part of the deforming sample experience a constant strain rate along the channel path, but also every part of the sample would experience a different strain rate compared to any other part of the sample.
2.2.3. Double-flare pure shear apparatus
For the double-flare pure shear apparatus, the mold is made up of an aluminum alloy. Its dimensions are 700 mm × 100 mm × 60 mm and its deformation path is 210 mm long. Samples can be up to several tens of cm long and their cross-sectional area is 20 mm x 20 mm. The shape of the channel (Fig. 4) is designed to provide, in the first half of the path, a compression and extension pattern in the main and transverse flow directions respectively, and the opposite pattern in the second half of the path. For this purpose, the concave sides of the deformation chamber are shaped with a flaring profile from the start of the path to halfway, and then with a symmetrical, tapering profile towards the end of the path (Fig. 4a). A slight change in principal stress directions is to be expected along the mold walls due to the changing surface directions, a situation that we take care of by systematically removing the side edges of the sample before micromorphological analysis. The initial (unflared) and flared dimensions of the channel cross section are 15 and 37.5 mm, respectively. The same linear electric motor as in the two methods above is used to extrude the specimen throughout the deformation channel. Teflon tape is used to reduce friction between the ice and the upper and lower mold surfaces.

Fig. 5. Sample layout after deformation. (a) Rotation and deformation partitions. (b) Example of grain outlines (from part 2) obtained by optical microscopy (polycrystalline ice sample). The stress pattern (given by the arrows) and the shear planes (given by the dashed lines) in the mold are represented by the square inset.
Assuming ice is incompressible
where L
0 and V
0 are the initial sample width and extrusion speed, respectively, and L and V the channel width and extrusion speed, respectively, at a given position x during deformation (Fig. 4b). Hence, the transversal strain rate ![]() y is
y is
where
By substituting Eqns (12) and (14) into Eqn (13), we obtain
In order to obtain a constant strain rate ![]() at any x position during deformation, we designed the shape L (x) of the channel of the mold to be
at any x position during deformation, we designed the shape L (x) of the channel of the mold to be
In this case,
3. Results And Discussion
3.1. Simple shear
Progression of the ice through the apparatus channels induces rigid-body rotation of the specimen, combined with bending. Entrainment by the wheel has the effect of augmenting the rotation, creating a velocity gradient across the sample, leading to simple shear.
We applied a constant strain rate of 4.54 × 10⁻⁷ s–1 on a sample measuring 60 mm × 20 mm × 20 mm. In Figure 5a, rotation and deformation undergone by the polycrystalline ice specimen is as follows:
-
Part 1: non-rotated; undeformed;
-
Part 2: 0–45° of rotation; 0–36% strain at the center of the channel section (R = 40 mm);
-
Part 3: 45–90° of rotation; 36–72% strain at the center of the channel section (R = 40 mm).
3.1.1. Texture measurements
We focus here on the part 2 deformation zone, i.e. on the sample portion that has undergone 0–36% of strain (Fig. 5b). As can be seen from Figure 6, there was no clear change in either crystal size (median 0.41 mm) or aspect ratio (median 1.77) in the course of the experiment. Since steady-state crystal size is determined by stress (Reference Jacka and LiJacka and Li, 1994), and since strain rate is kept constant during the experiment, this suggests that equilibrium flow conditions applied. One should note that it is uncommon in flowing ice bodies to find crystals with an average aspect ratio larger than 2 (Reference Gow and WilliamsonGow and Williamson, 1976; Reference Thorsteinsson, Kipfstuhl and MillerThorsteinsson and others, 1997; Reference Azuma and HondohAzuma and others, 2000; Reference Durand, Perrson, Samyn and SvenssonSamyn and others, 2008). Grain segmentation as a result of dislocation pile-up and polygonization provides a possible mechanism for this observation. In our experiment, the longest axis of crystals became progressively aligned, although in a limited way, with the finite shear direction (i.e. perpendicular to the radial direction) (Fig. 6). This process is often found in association with the progressive development of a softening mechanical anisotropy (Reference Gow and WilliamsonGow and Williamson, 1976; Reference Samyn, Svensson and FitzsimonsSamyn and others, 2008).
At each stage of strain, grain-size profiles were log-normally distributed (Fig. 6), whereas aspect ratios and elongation directions showed a typical generalized extreme value (GEV) probability distribution (Fig. 6), often used to model extreme or rare events. Both types of distribution arise from a collection of independent and identically distributed random variables, but they differ in the way they are generally determined (i.e. by their mean in the case of the log-normal distribution, and by their maxima in the case of GEV). The log-normal distribution has a large skewness towards small values, with a fatter tail towards large values, than GEV. Although both distributions result when the variables considered are the product of a large number of random variables, they have different implications, which extend far beyond the context of this paper. We can, however, hypothesize that grain size would reflect the average of a finite sequence of random variables, whereas aspect ratio and elongation direction would reflect the maxima of such variables. A challenging question arises as to whether or not these distributions describe the same random variables in our experiments. Part of the answer supporting the latter hypothesis might reside in the fact that areal and directional parameters do not necessarily evolve collinearly during deformation and often reflect processes occurring at different scales.

Fig. 6. Grain size, aspect ratio and elongation direction profiles at the end of various simple shear increments. Red and blue curves represent the log-normal and GEV best-fit probability distributions, respectively.
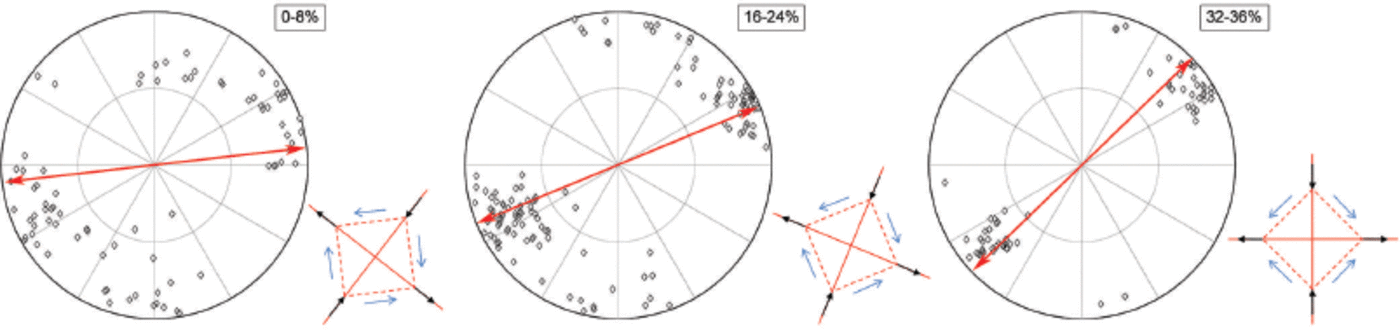
Fig. 7. Fabric Schmidt plots at various shear strain increments (polar equal-area projection). The number of grains analyzed is >80 for each increment. Arrows represent the radial direction at the end of the indicated strain interval, normal to the mean instantaneous flow direction. The reference frame to present the data and that of the corresponding thin sections is identical. The inner circle represents the 458 dip delineation. Square insets represent the stress patterns (given by the arrows) and shear planes (given by the dashed lines) in the mold.
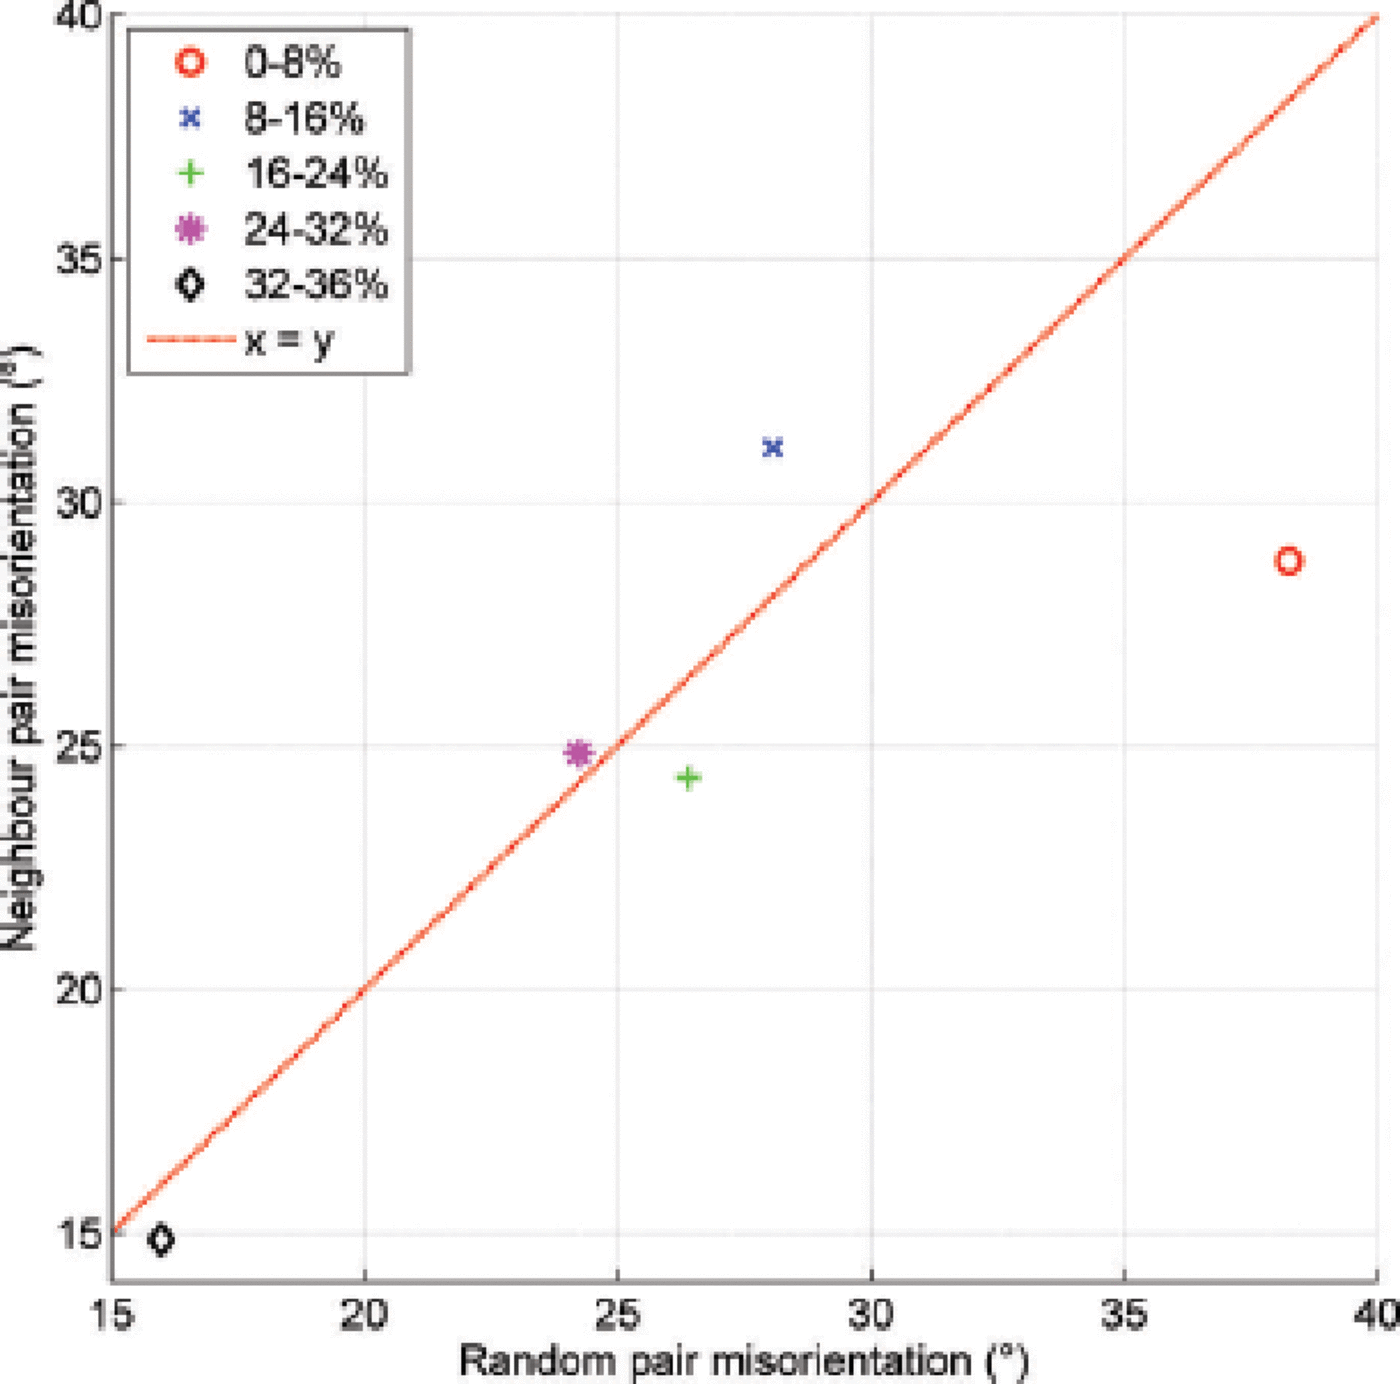
Fig. 8. The c-axis misorientation between neighboring and random pairs of grains.
3.1.2. Fabric measurements
Fabric patterns (Fig. 7) indicate a progressive c-axis rotation from an isotropic distribution towards the radial direction. In Figure 7, the initial radial direction was parallel to the west– east axis of the Schmidt net, whereas the radial direction at the end of the experiment was at 45° anticlockwise from that axis. After a rotation of 45° through the deformation channel, i.e. 36% strain along the center line, c –axes became aligned with the radial direction, which was at 45° to the axis of finite compression. Stress was maximized along basal planes in this case. It is also worth noting the secondary fabric that was clustering around the north–south axis at strain increments of 16–24%, which then vanished upon further deformation. This secondary maximum reveals the existence of a group of c-axes oriented parallel to the plane on which the forces generating simple shear act, i.e. parallel to the instantaneous flow direction. Occurrences of both such fabrics in nature are found, for instance, in the bottom part of various glaciers and ice sheets (e.g. Reference HookeHooke, 1973; Reference AndertonAnderton, 1974; Reference Gow and WilliamsonGow and Williamson, 1976; Reference Herron and LangwayHerron and Langway, 1982; Reference Azuma and HigashiAzuma and Higashi, 1985; Reference Thorsteinsson, Kipfstuhl and MillerThorsteinsson and others, 1997; Reference Cuffey, Conway, Gades, Hallet, Raymond and WhitlowCuffey and others, 2000; Reference Samyn, Svensson, Fitzsimons and LorrainSamyn and others, 2005).
An estimate of the grain-splitting efficiency resulting from subgrain rotation (or polygonization) can be made by studying the evolution of the misorientation angle between neighboring pairs of grains. If the splitting rate increases during deformation, an increasing number of low-angle pair boundaries is expected in the course of deformation (Reference Alley, Gow and MeeseAlley and others, 1995; Reference Wheeler, Prior, Jiang, Spiess and TrimbyWheeler and others, 2001). Besides, fabric clustering owing to c-axis mechanical rotation can be assessed through the evolution of the misorientation angle between random pairs of grains. This angle should also trend towards lower values as shearing proceeds.
After the first stage of deformation (0–8%), the average misorientation angle between random pairs of grains θM-r was significantly larger (~38°) than the average misorientation angle between neighboring pairs of grains θM-n (~29°) (Fig. 8). This indicates that at the temperature and strain rate considered, polygonization initiated before fabric clustering. During the next stages of deformation, however, both θM-r and θM-n decreased linearly and aligned on a slope of 1. This suggests that DR occurred at a steady pace, as illustrated by a near-constant grain size in the course of deformation (Fig. 6). More insights into DR dynamics can be gained from the misorientation probability diagrams in Figure 9a and b. First, distribution functions for random and neighboring pairs of grains were clearly offset after the first strain increment (0– 8%), with a maximum difference of 0.21 between the distributions for random pairs (smaller values) and for neighboring pairs (larger values). This offset became gradually negligible towards the end of the experiment. This pattern reinforces the idea above that polygonization initiated before fabric clustering, and that both processes occurred at a similar pace afterwards. Second, a break in trend slope can be observed on most probability curves throughout the experiment (except for the random pairs of grains at 8% strain). This break occurred gradually, shifted from a value of ~35° after 8% strain to a value of ~20° after 36% strain (Fig. 9a). In addition, the probability density where the break in slope occurred increased after each strain increment, from 0.65 at early strain stages to ~0.8 at 36% strain (Fig. 9a). These combined patterns indicate that low-angle boundaries, chosen here arbitrarily as <15° because of the final break in trend at ~20° of misorientation, developed progressively as strain proceeded, leading potentially to subgrains and therefore to new grains towards the end of the experiment. This is even clearer in Figure 9b, which shows a twofold increase, from the start to the end of the experiment, of the probability of finding grain boundaries with an angle less than 15°. A discussion on related processes in nature is available from a study of the first 100 m of the North Greenland Ice Core Project (NorthGRIP) ice core (Reference Durand, Perrson, Samyn and SvenssonDurand and others, 2008).

Fig. 9. Misorientations between neighboring pairs of grains (θ M-n) and between random pairs of grains (θ M-r), from 0 to 36% strain. (a) Continuous distribution functions for all misorientation values; (b) mean probability densities for misorientations less than 15°.

Fig. 10. Cross-polarized images of monocrystals at various stages of their path through the spiral bending apparatus. (a) Experiment I; (b) experiment II. Scale is given by the ice specimen width (20 mm). The front sample parts in both experiments are made up of isotropic granular ice and therefore do not reflect the strain undergone by the monocrystals.
3.2. Spiral-shaped bending
Because of the close interplay between flow constriction, shearing and bending during folding, this method was designed to investigate the development of microscale inhomogeneous flow of internal ice-sheet layers, i.e. the type of layer disturbance that might be observed across a single ice-core section.
Two experiments were conducted on monocrystals of different orientations. The specimens in experiments I and II were deformed, at the beginning of the channel, at a constant strain rate of 7.02 × 10⁻⁶ s–1. Sample dimensions were 150 mm × 20 mm × 20 mm, and 200 mm × 20 mm × 20 mm, respectively. In experiment I (Fig. 10a), the preexisting c-axis orientation was parallel to the radial direction, i.e. normal to the flow direction. This orientation is referred to as a hard glide orientation for bending and an easy glide configuration for shearing. Figure 10a shows the leading and trailing edges of originally rectangular samples becoming increasingly inclined relative to the radial direction as they progress along the channel, illustrating the occurrence of simple shear deformation in this case (in addition to bending, as there is a gradient from tension to compression in the radial direction). This is an unexpected result, since the stress pattern here only yields a combination of compression/extension and bending deformation. Basal glide cannot be invoked to explain this phenomenon, despite the easy glide configuration for shearing, as there is no shear stress component in the flow direction, like the one provided by the toothed wheel in the U-shaped apparatus above. Slip on the pyramidal plane is required to enable this significant change observed in sample shape. In experiment II, the specimen was made up of two parts, welded together, and with an initial c-axis misorientation of 90° (Fig. 10b). In other words, the two ice segments had a 45° and 135° misorientation, respectively, with the radial direction. In this experiment, the leading and trailing edges of the sample remained approximately parallel to the radial direction during deformation: they did not become inclined as a result of a bulk simple shear deformation. The welded segments were thus in a harder glide orientation for shearing compared to experiment I, whereas bending deformation was eased. In fact, the deformation regime was reduced in this particular case to a rigid-body rotation, associated with bending.
3.2.1. Fabric measurements
No splitting of the monocrystals occurred during either experiment (Fig. 10a and b). We surmise that the imposed strain rate was too low for dislocations to pile up along non-basal planes and for recrystallization to occur. Applying a strain rate at least one order of magnitude larger will most likely hinder strain recovery and produce dislocation jogs, a prerequisite for nucleation and grain boundary migration. We expect recrystallization to be favored mostly at the interface between the two misoriented parts of the specimen in experiment II, where the 908 orientation kink will act as a grain boundary by piling up dislocations.
Peculiar signs of intragranular slip deformation were noted in experiments I and II, such as undulose extinction, where the extinction direction across the crystal varies in a wavy manner. In experiment I (Fig. 10a), this phenomenon occurred gradually from the initial stages of deformation until the end. In experiment II (Fig. 10b), this process initiated in the same manner, but was soon superimposed by incremental twinning (manifesting itself in the form of parallel-sided zones of slightly varying orientations sweeping across the crystal) from about mid-course and on along the deformation path. This set of experiments illustrates the complexity underlying the hierarchy of slip systems activated in constricted, inhomogeneous flow. In view of the fabric results, however, it seems clear that the pre-existing c- axis orientation played an important role in determining intracrystalline slip dynamics and led to considerably contrasting mechanical behaviors. More work is underway to assess feedback processes between slip system and stress configurations and the sample mechanical response, in both monocrystalline and polycrystalline aggregates, within a particular deformation regime.
It is worth noting that throughout both experiments, c-axis departure from the radial direction was <5° on average (Fig. 11), thereby accounting for the consistent functioning of the method in providing a constant, uniform bending rate, despite, as noted above, potentially very different bulk deformation rates across the whole sample.
3.3. Pure shear
In the upper half of the mold, the specimen is mostly subjected to longitudinal compression and lateral extension, whereas the opposite applies in the lower half. Our apparatus should thus be useful for simulating, for instance, fabric evolution at an ice divide that is, or has been, migrating.
In the experiment presented here, a sample measuring approximately 120 mm × 20 mm × 15 mm was deformed at a constant strain rate of 6.47 × 10⁻⁷ s–1.
3.3.1. Texture measurements
Significant changes in grain size and elongation direction occurred during the first stage of deformation (Fig. 12). Within 20% of deformation in the upper half of the mold (εx(U)= 0–20%), grain size was reduced from a median of 0.95 mm to 0.59 mm (i.e. by ~35%). A steady grain size was then observed until ~50% strain in the lower mold (εx(U) = 90%). plus εx(L) = 50%). Grain size was reduced by another 20% (moving from a median of 0.53 mm to 0.43 mm) between 50% and 90% strain (εx(U)= 90% plus (εx(L)= 50–90%). As suggested for the case of the simple shear experiment above, the existence of a steady-state crystal size between the first (εx(U)= 0%) and last (εx(U)= 90% plus εx(L) = 90%) stages of deformation suggests that equilibrium flow conditions applied. Evidence for a rapid flow equilibrium being reached is supported by the evolution of grain aspect ratio and elongation direction. Aspect ratio increased from a median of 1.51 to 1.68 (i.e. by ~10%) during the first stage of deformation in the upper mold (εx(U) = 0–20%), suggesting either a brief occurrence of annealing, although a corresponding increase in grain size was not observed (but rather the opposite), or the start of accommodating/softening processes. Thereafter, aspect ratio did not vary significantly throughout the experiment. At the same time, the grain elongation direction evolved from a near-random pattern towards a clear maximum oriented sub-parallel to the longitudinal mold axis, supporting the idea that softening mechanical processes were at work.
As discussed for the case of the simple shear experiment described above, most grain-size profiles were log-normally distributed after deformation started, whereas aspect ratios and elongation directions generally displayed a GEV distribution (Fig. 12), allowing the further assumption either that these distributions reflect different sets of random variables, or that these variables express themselves differently, during strain localization.
3.3.2. Fabric measurements
Unlike texture parameters, fabrics evolved gradually into various sets of patterns. At the conclusion of the first stage of deformation (i.e. at (εx(U) = 20%), c-axes showed early signs of departure from an isotropic distribution (Fig. 13a), which became clear after 40% strain (εx(U) = 40%) (Fig. 13b). From then, fabric patterns revealed a progressive c-axis rotation and clustering towards the vertical. Between 70% and 90% strain in the upper mold section (εx(U) = 70–90%), a broad single maximum was formed within the 45° dip domain (Fig. 13c), in accordance with various studies of glaciers and ice sheets in compression regime (Reference DuvalDuval, 1981; Reference Azuma and HigashiAzuma and Higashi, 1985; Reference Budd and JackaBudd and Jacka, 1989; Reference AlleyAlley, 1992; Reference Thorsteinsson, Kipfstuhl and MillerThorsteinsson and others, 1997). One can note, during that stage, the circular c-axis arrangement in the vicinity of the outer rim of the Schmidt plot, representing sub-horizontal c –axes. This arrangement reflects deviations from the idealized strain pattern for which the apparatus was designed, as a result of excess friction along the mold walls, and can be circumvented by measuring fabrics only along the trace of the initial channel section of the mold (Fig. 4). After 10% strain in the lower mold section (εx(U) = 90% plus (εx(L)= 10%) (Fig. 13d), c –axes started to reorganize in response to the new extension pattern imposed. Between 30% and 50% strain (εx(U) = 90% plus (εx(L) = 30–50%), a preferred orientation towards the trans-verse flow directions (corresponding here to the west–east axis of the Schmidt nets) was observed (Fig. 13e). The latter pattern strengthened during the last stage of deformation (εx(U) = 90% plus (εx(L) = 90%), with the majority of c –axes concentrating around the east and west sectors of the diagram, outside the 45° dip domain (Fig. 13f). Examples of such divergent/convergent flow pattern can be compared to field observations by, for example, Budd (1972), Azuma and others (1985) and Matsuoka and others (2003) in the vicinity of an ice shelf, a confined blue-ice field and an ice divide, respectively.
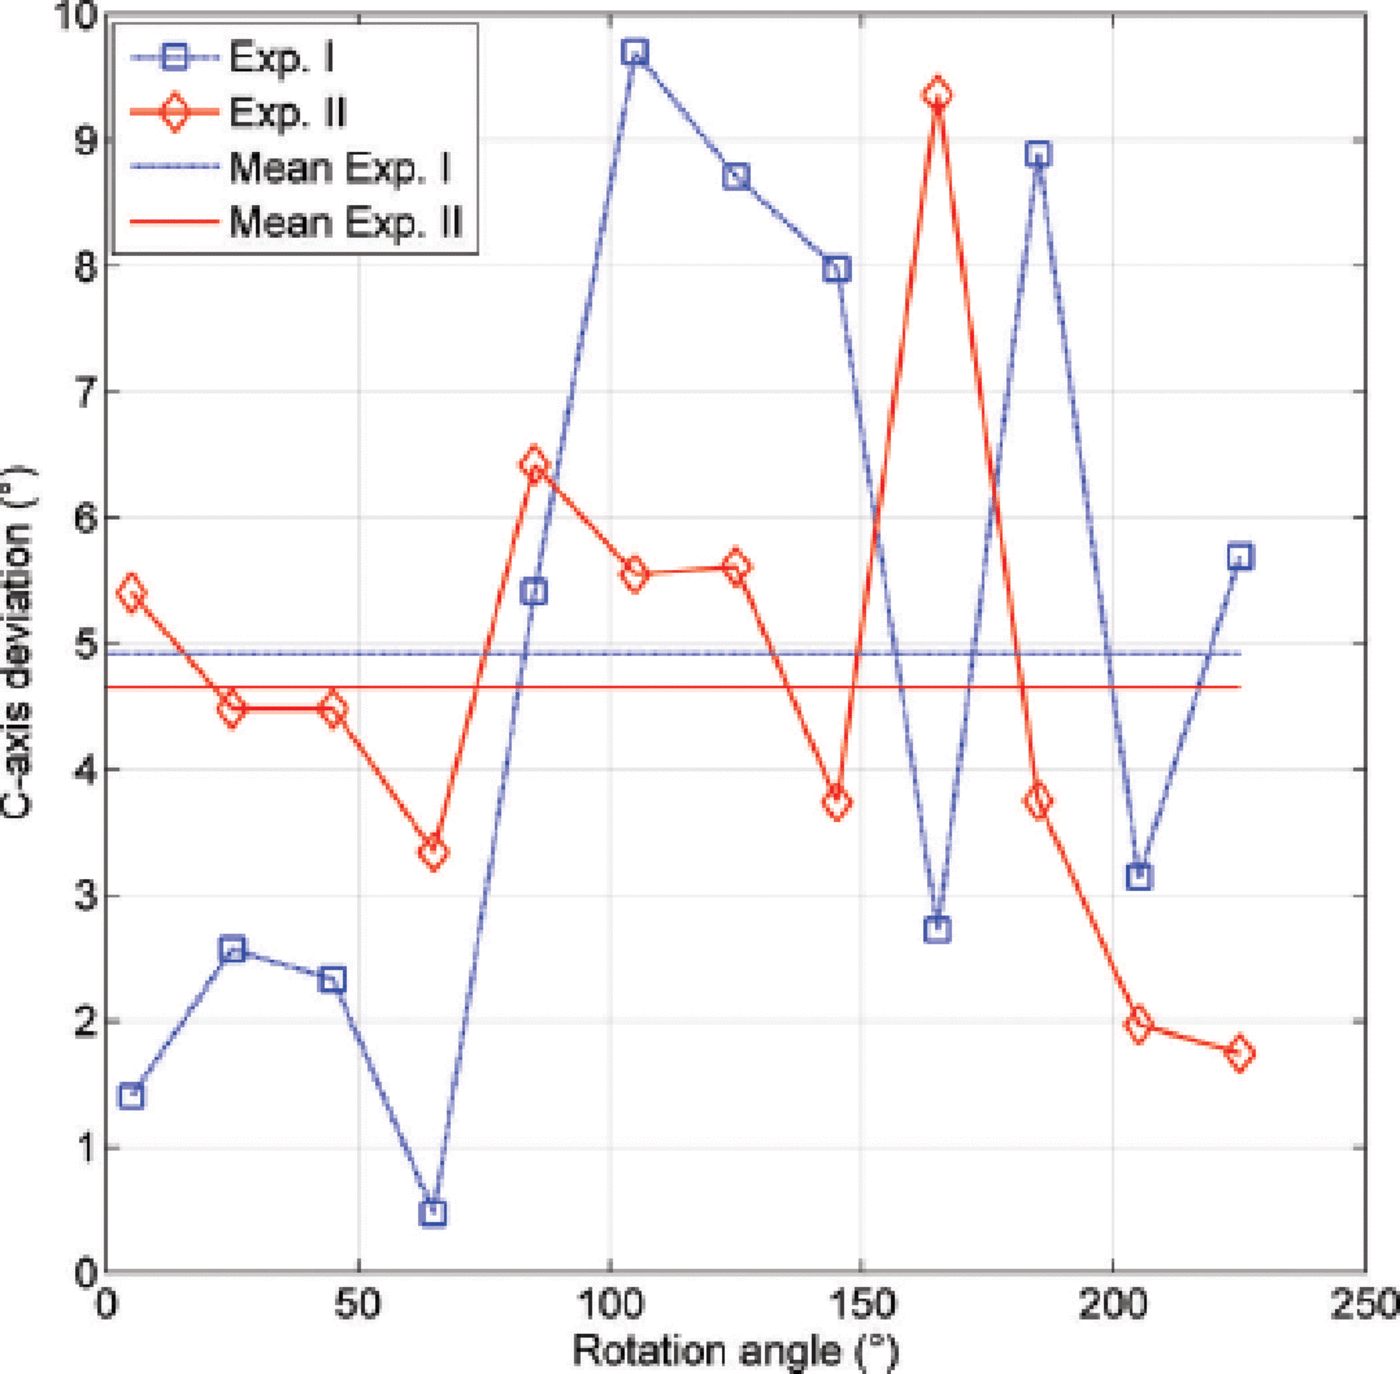
Fig. 11. Deviation of the monocrystal c-axis orientations from the radial direction, measured from 0 to 225° of rotation.
4. Conclusion
Shear deformation is prevalent in glaciers and ice sheets, and the relationships between micro-and macroscale flow processes in ice bodies are not fully understood yet. We have presented three newly developed apparatuses designed to investigate, in situ, the effects of simple shear, pure shear and compression/extension bending on the fabrics and textures of monocrystalline or polycrystalline ice aggregates. The simple shear and pure shear apparatuses were designed to provide a constant strain rate throughout the experiment, whereas the bending method imposes an increasing strain rate due to its log shape. Results from deformation experiments conducted at –5°C and at strain rates of the order of 10–6 to 10–7 s–1 indicate the development, starting from small strain increments, of significant textural and fabric changes induced by shear deformation. In the polycrystalline-ice simple shear and pure shear experiments, the dominant recrystallization mechanisms involved the rotation of grains and the multiplication of low-angle grain boundaries – both processes often being found to occur faster than fabric clustering during earlier stages of deformation – and grain boundary migration. A dynamic equilibrium was reached through the last strain stages between the processes of deformation, recrystallization and recovery, resulting in stable fabric and crystal size distributions. In the mono-crystalline ice-bending experiments, the response to stress showed strong dependence on the pre-existing c-axis orientation, and the microstructures developed resulted in contrasting rheologies. Our methods open new possibilities to investigate recrystallization and weakening mechanisms in ice and in other ‘soft’ materials, and their dependence on flow regime and cumulative strain.

Fig. 12. Grain size, aspect ratio and elongation direction profiles at various pure shear increments. (a) Deformation in the upper mold (εx(U)); (b) deformation in the lower mold (εx(L)). Red, blue and green curves represent the log-normal, GEV and Rayleigh best-fit probability distributions, respectively.

Fig. 13. Fabric Schmidt plots at various shear strain increments (polar equal-area projection). The number of grains analyzed is >100 for each increment. The center of the diagrams coincides with the mold long axis. U and L stand for deformation in the upper (εx(U)) and lower (εx(L)) mold section, respectively. The inner circle represents the 45° dip delineation.
Acknowledgements
D.S. acknowledges financial support from the Japanese Society for the Promotion of Sciences (JSPS) through a Postdoctoral Fellowship for Foreign Researchers and a Grant-in-Aid for Scientific Research. We express our gratitude to all students from the Graduate School of Mechanical Engineering who participated in this work. We also thank the Scientific Editor, Stephen Jones, and Adam Treverrow and Ilka Weikusat for their valuable comments.


