


Introduction
The introduction of multidrug therapy dropped the global leprosy prevalence by more than 95% from the levels observed in 1980s, but leprosy still afflicts hundreds of thousands of people worldwide [1, 2]. The decline in the prevalence was strongly influenced by the clearing of records due to a decrease in the treatment time that occurred in the mid-1990s [Reference Lockwood and Suneetha3]. Despite progress in the detection and treatment of patients, leprosy still presents several challenges that need to be addressed. Many cases are simply not detected and reported, and the number of cases with grade 2 disabilities at diagnosis has increased in some countries [1]. In Brazil, the grade 2 disability rate has varied from 5.6% in 2003 to 7.9% in 2016 [4].
Understanding the causes and the context of disease onset is extremely important for the development of effective and efficient disease control programmes. The association between poverty and leprosy has been recognised for a long time, with several associated variables that include agglomeration [Reference Williams5], low educational level [Reference Kerr-Pontes6], low nutritive diet [Reference Wagenaar7] and social inequality [Reference Montenegro8]. However, and in contrast to this concept, not all poor countries have high leprosy prevalence rates, while others that can be classified as emerging economies, such as Brazil and India, remain endemic [Reference Wagenaar7, Reference Lockwood9]. Current geoprocessing technologies have improved the analyses of these associations, simultaneously evaluating the occurrence of disease with data referring environmental and social factors in addition to the proximity to health services [Reference Fradelos10]. The objective of the present study was to evaluate the progress of epidemiological indicators of leprosy and to determine the strength of associations between social indicators and the occurrence of leprosy cases. As a representative example of a leprosy-affected region, we used data from the Brazilian endemic municipality of Juiz de Fora, Minas Gerais.
Methods
Overall study design and data collection systems
The study protocol was approved by the Research Ethics Committee of the Federal University of Juiz de Fora under no 1 698 184. An ecological study was conducted in Juiz de Fora, a city with more than 500 000 people, and a referral point for leprosy treatment for several nearby cities in the state of Minas Gerais, Brazil. Data were sourced from the SINAN database, a computerised system managed by the Brazilian Ministry of Health that gathers information on compulsory notifiable diseases. Time series was divided into two comparative periods: period I, from 1995 to 2004 and period II, from 2005 to 2015. These periods were selected to avoid distortions caused by both population and geographic structural changes that occurred within this time frame. A total of 379 new cases of leprosy were evaluated, of which 238 were diagnosed in period I and 141 in period II. In the first phase of the analysis, indicators of leprosy monitoring were calculated such as annual detection rates, prevalence rates, number of cases detected with grade 2 disability at diagnosis, age distribution, clinical presentation and case identification strategy. The geographic analysis of the cases was achieved by georeferencing using the ArcGis version 10.2.2 programme, and the cartographic base referring to the 2000 demographic census in period I and to the 2010 census in period II. Twenty-nine cases were excluded from this evaluation (26 in period I and three in period II) due to records that did not have complete addresses.
An indicator called Health Vulnerability Index (HVI), created by the Secretary of Health of the state of Minas Gerais to highlight the intra-urban socio-economic inequalities and to identify priority areas for resource allocation, was built with demographic data provided by the Brazilian Institute of Geography and Statistics (IBGE). This index presents an inverted scale, such that the lower the HVI the greater the social inclusion. HVI has previously been used to study the association of socio-economic factors with the occurrence of health disorders [Reference Pastrana11].
Sub-regional compartmentalisation of data
The municipality was divided into censitary sectors, which represent the smallest territorial unit. Each of these units was ranked according to the HVI value, then classified as one of the following: low risk = sectors with HVI value lower than the mean minus half standard deviation (s.d.) of the mean HVI value from all censitary sectors; medium risk = censitary sectors with HVI value equal to the mean +/− 0.5 s.d.; high risk = sectors with HVI value between 0.5 and 1.5 s.d. units above than the mean; very high risk = sectors with HVI value above the high HVI.
Statistical analyses
Statistical analyses were performed using IBM SPSS software version 24 (IBM Corp, Armonk, NY, USA). To test the differences in detection rate, prevalence rate and mean age between periods I and II, the Student's t test was used for independent samples. Normal distribution of data assumptions and equality of variances was validated by the Kolmogorov–Smirnov test and the Levene test, respectively. To compare the grade 2 disability rate at diagnosis, the non-parametric Mann–Whitney U test was used. The χ 2 test was used for the analysis of operational classification, clinical forms and age range. The Fischer's test was used for the analysis of forms of case identification. A P-value of ⩽0.05 was considered as representing statistical significance. To test the association between the HVI and leprosy, census tracts were classified as tracts with or without cases. Then, the association between the presence of leprosy and the HVI was expressed as odds ratios (OR), calculated using logistic regressions, with the low HVI as reference category. The data of each period were analysed with a separate regression. The regressions were fitted in R 3.4.0.
Results
Characteristics of leprosy presentation during the study periods
The recorded prevalence rates of leprosy in the city of Juiz de Fora, Minas Gerais, ranged from 1.38/10 000 inhabitants in 1997 to 0.22/10 000 inhabitants in 2015, indicating a strong overall downward trend (Fig. 1a). Transient increases were observed in 2001 (prevalence rate of 0.77/10 000 inhabitants), which is accentuated in the years of 2002 (0.98/10 000 inhabitants) and 2003 (0.96/10 000 inhabitants), but followed by a resumption in decline (Fig. 1a). Prevalence rates for the first 2 years (1995 and 1996) were not calculated because they involved cases recorded in years prior to 1995. After a period of stability with minor peaks in 1997 (8.75/100 000 inhabitants) and in 2003 (6.47/100 000 inhabitants), the detection rate of new leprosy cases in Juiz de Fora showed a downward trend (R 2 = 0.6108), reaching a minimum value of 0.9/100 000 inhabitants in 2015 (Fig. 1b). Similar trends were observed in both state (Minas Gerais) and national (Brazil) levels, indicating the suitability of using data from Juiz de Fora as a representative for broader application (Fig. 1b). The close association of prevalence with the detection rate, particularly since 2006, is apparent when the trends are overlaid (Fig. 1c). The rate of new cases presenting with grade 2 disability at diagnosis was highly variable, peaking in 1997 (1.8/100 000 inhabitants) and 2007 (1.5/100 000 inhabitants), reaching zero in 2008 and 2012, but showing significant re-emergence in 2015 (Fig. 1d). When data were pooled into the two distinct reporting periods, however, there was evidence of a significant reduction in the prevalence (Fig. 1a), number of new cases (Fig. 1b) and grade 2 disability rates (Fig. 1d).
Fig. 1. The annual prevalence of leprosy (/10 000) in Juiz de Fora, Brazil, from 1997 to 2015 (a), the detection rate of new cases (/100 000) from 1995 to 2015 (b), the prevalence and adapted detection rate (/10 000) from 1997 to 2015 (c) and the annual grade 2 disability rate from 1995 to 2015 (d) were determined.
The multibacillary form (MB) of leprosy prevailed in both periods studied; however, MB cases fell from 80.2% to 61.5%, and the dimorphic form decreased from 62.6% to 42.7%, between periods I and II (Fig. 2a and 2b). Accordingly, the tuberculoid form increased its representation and was more common than the extreme lepromatous form in period II (P < 0.05). An increase in the mean age of patients was observed between periods I and II (44.1 ± 16.1 vs. 48.2 ± 17.0, respectively), with a relative decrease in the range of 30–44 years and increase of the group above 45 years (Fig. 2c). The detection of new cases through referral by health professionals was predominant in both periods, but was noticeably higher in period II, and this was accompanied by a reduction in the detection by spontaneous demand (P < 0.001). While recommended as an efficient case-detection measure, it was noteworthy that few of the patients were diagnosed through the contact examination strategy (Fig. 2d).
Fig. 2. Characteristics of leprosy in Juiz de Fora, Brazil, in period I (1995–2004) and period II (2005–2015). Distribution of leprosy according to operational classification (a), clinical forms (b), age (c) and form of detection of new cases (d). Paucibacillary leprosy corresponds to the indeterminate and tuberculoid forms, while multibacillary leprosy corresponds to the dimorphic and lepromatous forms.
Georeferencing and stratification by HVI
Leprosy cases were located in the cartographic base, allowing detection rates to be calculated by more refined censitary sectors. As expected and indicative of ongoing Mycobacterium leprae transmission, all cases in children under 15 occurred in highly endemic sectors (data not shown). Adapting the classification of the censitary sectors according to the HVI, the majority of leprosy cases in period I (52.6%) occurred in sectors with a medium HVI, whereas in period II, the distribution of the absolute number of cases was more equally distributed across the low, medium and high HVI sectors (33.3%, 31.1% and 25.4%, respectively) (Fig. 3 and Table 1). The sectors with very high HVI are mainly located in the most peripheral regions of the municipality and are the ones with the lowest occupancy (contributing 7.7% of the population in period I and 9.3% in period II). These sites were also those with low leprosy detection rates (8.6% of total cases in period I and 10.1% in period II). As cases tend to occur where there is a greater population concentration, to avoid distortions and to obtain robust data, we combined the ‘high’ and ‘very high’ HVI classifications for the analysis of association between HVI and the leprosy new case-detection rate. From logistic regression analysis and using low HVI sectors for reference, we observed that while there is a greater chance of occurrence of leprosy in sectors with a medium and high HVI classification in period I, risk was very significantly focused within high HVI sectors in period II (Table 2). Thus, over time the trend has been for leprosy cases to emerge from among those with greatest social exclusion.
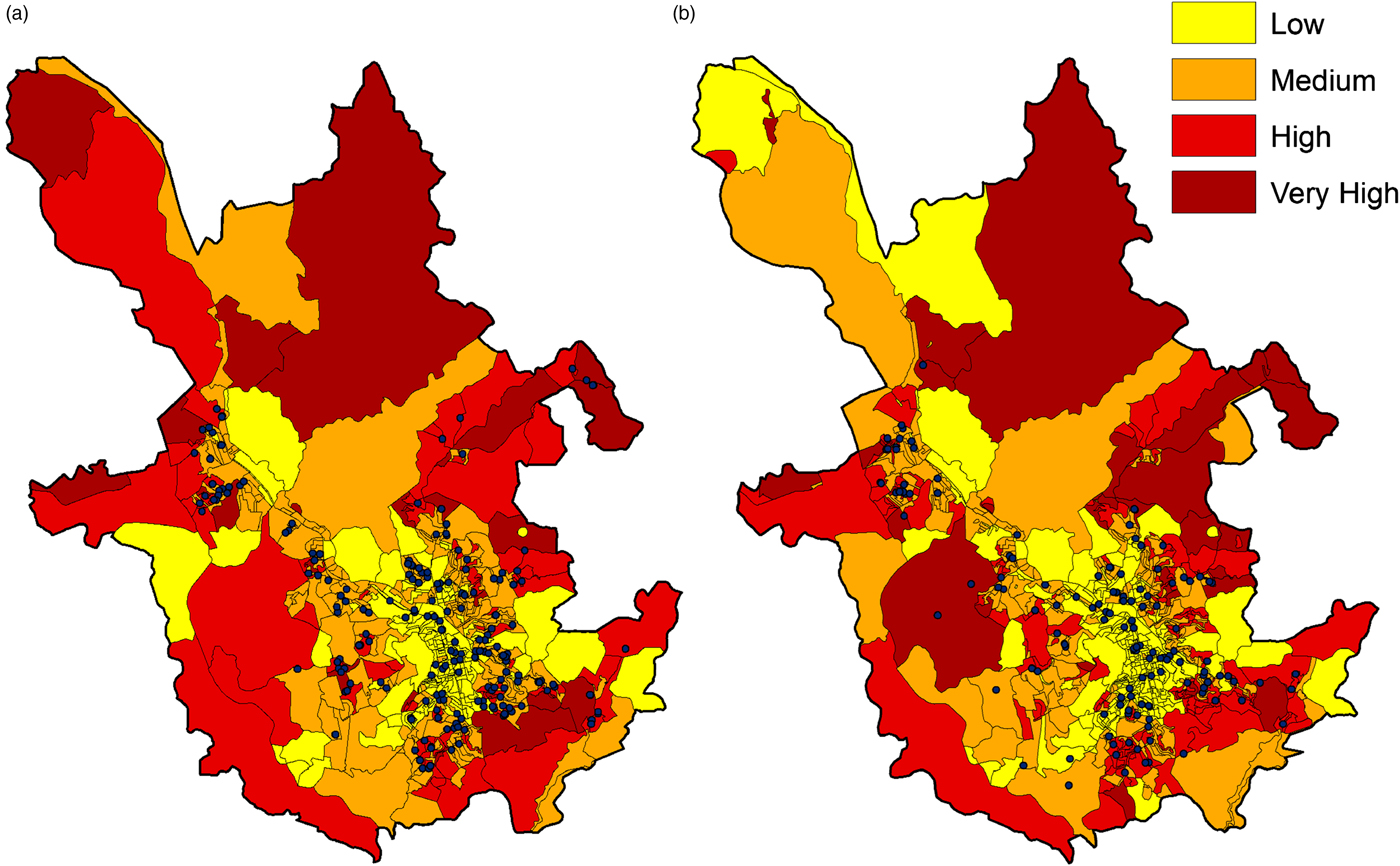
Fig. 3. Map of the urban perimeter of Juiz de Fora, Brazil, showing the cases of leprosy detected in period I (1995–2005, a) and in period II (2006–2015, b) localised in censitary sectors organised according to the Healthy Vulnerability Index (HVI) classification (low, medium, high and very high).
Table 1. Distribution of leprosy cases in the municipality of Juiz de Fora by category of the censitary sector according to the Health Vulnerability Index
The spatial analysis of the cases was carried out by georeferencing using the ArcGis version 10.2.2 programme, using the cartographic boundary files for the 2000 census in period I (1995–2005) and for the 2010 census in period II (2006–2015). Censitary sectors were ranked according to the Health Vulnerability Index (HVI) value as described in Methods section.
Table 2. Logistic regression evaluating the association of HVI with the presence of leprosy in censitary sectors

a Healthy Vulnerability Index (HVI) classification.
b Odds ratio (OR) with the low index as the reference category.
c Confidence interval (CI).
* P < 0.05 versus ocurrence of leprosy in low HVI sectors.
Discussion
Effective multidrug therapy (MDT) treatment and case-detection campaigns have contributed to marked reductions in the global prevalence of leprosy in recent years [1]. Given these successes, resources that were available for leprosy-specific control programmes are now being reassigned in many countries. It is well documented, however, that endemic pockets remain and many individuals remain at risk of developing leprosy. Our data reveal that prevalence and new case-detection rates in Juiz de Fora (sub-regional level) had a very similar trend to both the state and national reported levels, indicating that close analyses of the sub-regional trends and presentations would likely be reflective of these larger units and even beyond Brazil into other nations.
The pronounced fall that occurred in the prevalence of leprosy in Juiz de Fora in 2000 can be attributed, in part, to the reduction in the treatment time of MB patients from 24 to 12 months, which was operationalised in the municipality in 1999 [Reference Freitas12]. The increase in the prevalence rate that occurred in 2001–2003 coincided with the increase in new cases that occurred not only in Juiz de Fora and Minas Gerais, but also in other Brazilian states [Reference Freitas, Duarte and Garcia13]. This can be readily attributed to the intensification of contact surveys that occurred from 2002, as recommended by the Ministry of Health of Brazil [14]. There was also a more pronounced reduction in case-detection rates after 2007, when prevalence and detection curves tend to nearly overlap. This can be explained by another operational change that occurred in 2006, when the criteria for discharging from the active registry changed to discharge occurring automatically after 6 months of MDT for paucibacillary (PB) patients and 12 months for MB patients. Thus, since 2006, prevalence appears to be strongly influenced as a function of a single variable by the new case-detection rate [Reference Penna and Penna15]. This strategy generates some artificial distortions in the prevalence rates, since for the calculation of this variable only the cases in treatment are counted on 31 December of the year of evaluation. Thus, PB patients who began their treatment in the first half of the year are not entered into the prevalence statistics because they usually complete treatment before the end of the year.
In general, leprosy patients do not usually present with incapacities or disabilities at the time of diagnosis, and their presence is generally considered as indicative of late diagnosis [Reference Lana16]. In association with the fall in the new case-detection rate, the decrease in the rate of grade 2 disability at diagnosis in period II may suggest a reduced endemicity of leprosy in Juiz de Fora [17]. The resurgence in the detection of patients with grade 2 disability in 2015, however, coinciding with the lower rate of detection of new cases in the same time frame, indicates the possibility of hidden/delayed detection of cases. It is important to emphasise that passive forms of detection predominated in both periods, supporting the hypothesis that many of the cases were no longer being efficiently diagnosed. In addition, although a relative increase in the detection of PB cases and more patients with the polar tuberculoid form of leprosy were observed between the evaluated periods, the proportion of MB cases was predominant, as observed in most countries, indicating continued transmission [1]. It is worth noting that obtaining the correct diagnosis avoids misclassification and ensures appropriate treatment, thereby reducing the risk of relapse.
While studies have shown that leprosy is associated with poverty [Reference Kerr-Pontes18], poverty is only one of the determining factors for the occurrence of leprosy [Reference Kerr-Pontes6, Reference Freitas, Duarte and Garcia19]. The present study demonstrated an association of higher rates of leprosy detection with high social vulnerability index. Although this is an ecological study and conclusions cannot be made at the individual level, this type of study is important because the understanding of social and environmental determinants is essential to explain overall health conditions, especially when it comes to infectious diseases [Reference Halloran and Struchiner20]. Using other social indicators, Monteiro et al. found an association between variables related to poverty and the incidence of leprosy, in addition to a lower incidence in municipalities with greater coverage of social income distribution programmes [Reference Monteiro21]. Accordingly, Kerr-Pontes et al. evaluated another endemic region in Brazil and observed an association between the incidence of leprosy and levels of inequality and population growth [Reference Kerr-Pontes18]. Taken together, the data indicate that leprosy control programmes should focus on resources among particular demographics to optimise their impact and ability to detect new cases.
Our findings suggest that although the changes in epidemiological indicators are apparently directed towards the elimination of leprosy in Juiz de Fora, there is evidence that there may be many undetected/hidden cases that persist within the region. The association of social vulnerability factors and the occurrence of leprosy emphasise the importance of public policies aimed at reducing social inequalities to, among other reasons, effectively obtaining adequate control of the disease. Thus, it is essential to increase the active search for cases in endemic regions and to ensure sustained political commitment to efficiently target and reduce the areas of greater social vulnerability.
Acknowledgements
This work received support from Conselho Nacional de Desenvolvimento Científico e Tecnológico – CNPq (grant number 31036/2015-5) and Fundação de Amparo à Pesquisa de Minas Gerais – FAPEMIG (grant number APQ-02504-17). The authors thank the Department of Health of the State of Minas Gerais for providing access to the SINAN database.
Conflict of interest
None.


