


Introduction
In various disciplines, measurement instruments such as questionnaires are akin to magic wands due to their potential to refine theories and inform practice by shedding light on latent constructs (Zickar, Reference Zickar2020). In second language (L2; hereafter, this acronym is used to refer to both second and foreign language acquisition) research, psychometric instruments and self-report scales, in particular, are employed by scholars from a variety of subdomains. Perhaps not surprisingly, these data collection instruments appear to be especially common in the substantive realm of L2 learner-internal factors or individual differences, such as anxiety and willingness to communicate (WTC; see Elahi Shirvan et al., Reference Elahi Shirvan, Khajavy, MacIntyre and Taherian2019; Teimouri et al., Reference Teimouri, Goetze and Plonsky2019).
Somewhat paradoxically, despite the popularity of self-reports in L2 research, prevailing attitudes to questionnaires range from mild distrust to scoffing skepticism (e.g., Al-Hoorie et al., Reference Al-Hoorie, Hiver, Kim and De Costa2021), and not without a reason. Drawing a parallel to other common L2 instruments such as C-tests (see McKay, Reference McKay2019, for a meta-analysis), concerns have been raised about questionnaire designs and validation, their psychometric properties (i.e., evidence of validity and reliability), usage, and overall questionnaire literacy of L2 researchers (see Al-Hoorie & Vitta, Reference Al-Hoorie and Vitta2019). Indeed, as succinctly put by DeVellis (Reference DeVellis2017), “measurement can make or break a study” (p. 229).
The purpose of this study is to stir up a much-needed conversation on scale quality in the realm of L2 individual differences—a strand of research that has been thriving over the years (as suggested by Zhang, Reference Zhang2020)—by conducting a methodological synthesis of primary empirical studies that employed self-report scales measuring learner-internal factors of L2 anxiety and WTC. Unlike meta-analysis, which typically focuses on aggregating effect sizes, methodological synthesis is a type of systematic review that surveys methodological practices rather than substantive results (as noted by Cooper, Reference Cooper2016; Plonsky, Reference Plonsky2014). The primary advantage of a systematic review over a traditional literature review lies in the enhanced systematicity and objectivity of the former compared to the “opportunistic” and idiosyncratic nature of the latter (Paré et al., Reference Paré, Trudel, Jaana and Kitsiou2015, p. 185). Among existing systematic reviews of L2 anxiety and WTC, meta-analyses appear to be prevailing (e.g., Botes et al., Reference Botes, Dewaele and Greiff2020; Elahi Shirvan et al., Reference Elahi Shirvan, Khajavy, MacIntyre and Taherian2019; Li, Reference Li2022; Teimouri et al., Reference Teimouri, Goetze and Plonsky2019). Nevertheless, what has been largely missing in previous research is a thorough description and examination of methodological practices and the status quo of scale quality in these subdomains of L2 individual differences. One notable exception is Sudina’s (Reference Sudina2021) methodological synthesis of L2 anxiety and motivation, which was, nonetheless, substantially narrower in scope and did not examine WTC scales. Another commendable synthesis of questionnaires in L2 research was conducted by Zhang and Aryadoust (Reference Zhang and Aryadoust2022); however, their study had a more general scope and included only recent questionnaire studies. The present study is unique on at least two accounts. First, it surveys two specific latent constructs, L2 anxiety and WTC, over a two-decade timeframe and across 22 target journals. Second, it provides a comprehensive account of scale quality, which includes characteristics pertaining to scale design, the evidence of scale validity and reliability, and transparency in reporting at the scale level.
To be clear, scale quality is an integral part of study quality in survey research because psychometrically sound measures are a prerequisite for conducting methodologically savvy survey research, which in turn enhances our understanding of the role of these and other already-established learner-internal characteristics in L2 development. By shedding light on the quality of scales employed in L2 anxiety and WTC research, the present study seeks to make several valuable contributions—from emphasizing the importance of creating robust questionnaire designs to raising awareness of how to assess psychometric properties of questionnaires, including various types of scale validity and reliability, and to (hopefully) demonstrating that adhering to the principles of scale quality does not require advanced statistical knowledge or highly specialized methodological training.
Methodological syntheses and methodological reform in L2 research
An increasing number of scholarly articles, books, journal guidelines, plenaries, and even entire conferences devoted to research methods have been urging L2 researchers to reconsider and renovate the arsenal of their research tools and to implement cutting-edge methodological practices. This has been instrumental in moving the field toward coming of age (as noted by Gass et al., Reference Gass, Loewen and Plonsky2021). Critically, a current surge in systematic reviews and methodological syntheses, in particular, is another valuable indicator attesting to the fact that a call for reform in L2 research (see Plonsky, Reference Plonsky2014) has been taken seriously. This is evident in the accelerated growth of evidence-based guidance developed by synthetic researchers aiming to instigate changes in their respective substantive domains and advance the use of specific research techniques (as observed by Gass et al., Reference Gass, Loewen and Plonsky2021; Marsden & Plonsky, Reference Marsden, Plonsky, Gudmestad and Edmonds2018). Methodological syntheses focusing on methodological issues that have a bearing on substantive domains have been referred to as within-domain syntheses (e.g., Plonsky & Gass, Reference Plonsky and Gass2011), whereas their counterparts targeting research techniques and practices have been categorized as across-domain syntheses (Marsden et al., Reference Marsden, Thompson and Plonsky2018).
Concerning across-domain syntheses, Plonsky’s (Reference Plonsky2013, Reference Plonsky2014) comprehensive syntheses of quantitative studies (K = 606) laid the groundwork for describing and evaluating study quality across various subdomains of L2 research and equipped L2 readership with empirically derived insights into meritorious methodological choices as well as inadequate practices that should be abandoned to drive the field forward. This gave rise to other methodological syntheses surveying (a) research tools and techniques (e.g., self-paced reading, judgment tasks; Marsden et al., Reference Marsden, Thompson and Plonsky2018; Plonsky et al., Reference Plonsky, Marsden, Crowther, Gass and Spinner2020); (b) transparency features (e.g., assumption reporting practices; Hu & Plonsky, Reference Hu and Plonsky2021); and (c) statistical techniques (e.g., Crowther et al., Reference Crowther, Kim, Lee, Lim and Loewen2021). Based on this classification, the present study falls into the category of across-domain syntheses because its goal was to address measurement-related features of scales employed across two strands of L2 individual differences research: anxiety and WTC.
Assessing scale quality
To explore the degree of adherence to methodological rigor in L2 survey research into anxiety and WTC, scale quality has been defined as the robustness of scale(s) employed in the study, which is dependent on scale design, psychometric properties, and scale-related reporting practices (or transparency). Notably, all aspects of scale design as well as its validity and reliability should be carefully considered when appraising the quality of a scale.
Scale design
This section delineates the following features of a scale design that need to be assessed to evaluate scale quality: response format type, number of items, number of response options, the presence or absence of a neutral midpoint, and category labels. Dörnyei (Reference Dörnyei and Taguchi2010) emphasized that the term scale may denote two different concepts: (a) a psychometric instrument that consists of multiple items and (b) a rating scale, or “a measurement procedure utilizing an ordered series of response categories” (p. 26). Rating scales may come in a variety of forms, but the most popular ones are Likert, semantic differential, visual analog (or slider), and binary scales (see DeVellis, Reference DeVellis2017; Menold & Bogner, Reference Menold and Bogner2016; Phakiti, Reference Phakiti, Winke and Brunfaut2021). Each rating scale type has its limitations. For example, Likert and binary scales may evoke acquiescence bias, or “the tendency to respond in the affirmative direction when in doubt” (Dörnyei, Reference Dörnyei and Taguchi2010, p. 32); additionally, binary items tend to have low reliability.
Concerning scale length, although it is acceptable to include redundant items during scale development, excessive redundancy is not recommended when the scale is being finalized. Single-item scales can prove problematic as well. First, it is difficult to create an item that would grasp all aspects of a latent construct; second, it is difficult to determine if it is reliable (see DeVellis, Reference DeVellis2017).
Similar to the number of items, there are no hard and fast rules about the number of response options for a scale. A large number of response options, however, may be confusing or misleading to respondents (as maintained by DeVellis, Reference DeVellis2017). To that end, Dörnyei (Reference Dörnyei and Taguchi2010) suggested that on a Likert scale, researchers should aim for about three options for children and five to six options for adults. Along these lines, Menold and Bogner (Reference Menold and Bogner2016) recommended choosing between five to seven options, which can buttress a scale’s psychometric properties and is optimal for participants’ cognitive load.
Whether an odd or even number of response options should be included is often a matter of a researcher’s preference to keep or avoid the neutral midpoint. The proponents of the middle category argue that it is inappropriate to force respondents to take sides if they feel truly neutral about a given topic; the antagonists maintain that participants who are not enthusiastic about the topic or are reluctant to express their opinion may take advantage of a neutral midpoint and engage in satisficing behavior or fall prey to social desirability bias (as maintained by Dörnyei, Reference Dörnyei and Taguchi2010; Menold & Bogner, Reference Menold and Bogner2016). Thus, it is advisable to consider “the type of question, the type of response option, and the investigator’s purpose” when deciding on whether the neutral midpoint is worth including (DeVellis, Reference DeVellis2017, p. 119).
Scale developers are also advised to take the issue of category labels seriously. Specifically, fully verbal scales are shown to have the advantage over partially verbal (i.e., with only scale endpoints being verbally labeled) and numerical rating scales—because numbers can be interpreted differently by participants; moreover, full verbalization is especially beneficial for respondents with little or no formal education (as noted by Menold & Bogner, Reference Menold and Bogner2016).
Validity
Validity refers to the extent to which an instrument measures what it is supposed to measure. To assess scale validity, it is critical to establish (a) how the scale was developed (i.e., content validity), (b) how it is related to scales targeting other constructs (i.e., construct validity as well as its subtypes, convergent and divergent/discriminant validity), and (c) how it predicts outcome variables (i.e., criterion-related validity) (see DeVellis, Reference DeVellis2017; Purpura et al., Reference Purpura, Brown and Schoonen2015). Nonetheless, L2 psychometricians have been accused of not exhaustively reporting instrument validity (see Al-Hoorie & Vitta, Reference Al-Hoorie and Vitta2019), which imperils the quality of psychometric instruments. The facets of instrument validity that were examined in this study are discussed in the following text.
Content validity represents the degree of “item sampling adequacy—that is, the extent to which a specific set of items reflects a content domain” (DeVellis, Reference DeVellis2017, p. 86). To ensure that the intricate nature of a target latent variable is well reflected by scale items, it is important to find a match between a conceptual definition of the construct, which refers to theoretical claims about the nature and components of the construct and is typically provided in the literature review section of a research report, and an operational definition, which corresponds to how the construct is being measured in a particular study. For example, if a researcher is interested in investigating the construct of L2 speaking anxiety, the scale should not contain items tapping into participants’ listening, writing, or reading anxiety in an L2. Additionally, the item content should be appropriate for the target population and context (as noted by DeVellis, Reference DeVellis2017). Finally, it is not expedient to utilize a single-item scale to measure a latent variable due to insufficient comprehensiveness of such a measure (see Kim, Reference Kim2009); ideally, the scale should consist of at least three to four items (as suggested by Dörnyei, Reference Dörnyei and Taguchi2010). To provide a formal evaluation of items’ content, scale developers can either ask experts’ opinions or use a more advanced Q-sorting procedure (see Cortina et al., Reference Cortina, Sheng, Keener, Keeler, Grubb, Schmitt, Tonidandel, Summerville, Heggestad and Banks2020; DeVellis, Reference DeVellis2017; Zickar, Reference Zickar2020). In a Q-sorting technique, subject-matter experts rank-order items based on specific criteria; these rankings are then analyzed by scale developers (as noted by Kim, Reference Kim2009).
Evidence of construct validity is arguably best thought of as a justification of the measurement instrument as “a meaningful representation of the underlying psychological construct being assessed” (Purpura et al., Reference Purpura, Brown and Schoonen2015, p. 43). It is critical to provide both conceptual and operational definitions of the construct of interest and indicate the scope of the measurement instrument and the aspects of the target construct that it captures. To establish construct validity, the following procedures can be used: the multitrait-multimethod matrix, factor analysis (such as exploratory factor analysis, or EFA; principal components analysis, or PCA; and confirmatory factor analysis, or CFA), correlational analysis, structural equation modeling, and item response theory analysis, including Rasch measurement and Mokken scaling (see Bond & Fox, Reference Bond and Fox2015; Campbell & Fiske, Reference Campbell and Fiske1959; Mokken, Reference Mokken, van der Linden and Hambleton1997; Phakiti, Reference Phakiti and Phakiti2018a, Reference Phakiti and Phakiti2018b; Purpura et al., Reference Purpura, Brown and Schoonen2015; Zickar, Reference Zickar2020, for more information on these construct validation techniques). According to DeVellis (Reference DeVellis2017), a scale that possesses construct validity will show evidence of convergent validity (i.e., similarity) with a scale targeting a theoretically related construct (e.g., one might expect that the scores on the L2 reading anxiety scale would be positively and strongly correlated with the scores on L2 writing anxiety scale) and evidence of divergent (or discriminant) validity with a scale measuring a theoretically distinct construct (e.g., one would anticipate a negative correlation between L2 anxiety and WTC).
Testing for measurement invariance is yet another critical procedure that is used to shed light on scale validity. Measurement invariance refers to a “condition in which the measures forming a measurement model have the same meaning and are used in the same way by different groups of respondents” (Hair et al., Reference Hair, Black, Babin and Anderson2010, p. 726). It can be tested by performing multigroup CFA, which operates by comparing model fit for each of the subgroups of interest (e.g., English-as-a-second vs. English-as-a-foreign language students). The steps typically involve examining configural invariance (i.e., the extent to which the overall factor structure across groups is equivalent), metric invariance (i.e., the extent to which factor loadings across groups are equivalent), and scalar invariance (i.e., the extent to which item intercepts are equivalent). Assuming there is evidence thereof, it is now appropriate to test mean differences across groups. In case any differences emerge, they can be attributed to differences in latent variables themselves rather than differences in how the subgroups interpret scale items (see Hussey & Hughes, Reference Hussey and Hughes2020). Another way to test measurement invariance is to apply item response theory (e.g., Rasch analysis) and investigate differential item functioning (see Bond & Fox, Reference Bond and Fox2015).
Providing explicit validity evidence to a previous study in which a scale has been validated offers an attractive alternative to formal validity tests and can save researchers a great deal of time and effort. However, the demonstration of indirect validity evidence only applies to existing measures that have been successfully validated in a similar research context. If a scale has been newly designed or modified for a different target population (e.g., a scale of L2 anxiety for use with children has been developed based on a scale originally validated with a sample of adults), referencing a loosely related validation study lacks both logic and credibility. Rather, such scales should withstand comprehensive scrutiny of validity and reliability in a new research context (as recommended by Flake et al., Reference Flake, Pek and Hehman2017).
Reliability
When applied to scales, reliability refers to “the proportion of variance attributable to the true score of the latent variable” (DeVellis, Reference DeVellis2017, p. 49). Although reliability is considered a critical prerequisite for instrument validity, L2 psychometric studies have been notorious for underreporting reliability of their measures, reflecting an unfortunate trend in L2 research (as observed by Al-Hoorie & Vitta, Reference Al-Hoorie and Vitta2019; Purpura et al., Reference Purpura, Brown and Schoonen2015). Under classical test theory, the higher the reliability of the scale, the better it reflects the true score of the construct of interest (see Zickar, Reference Zickar2020). Nonetheless, classical test theory provides information only about “test” reliability, which is equivalent to person reliability in item response theory, whereas item response theory also informs about item reliability (see Linacre, Reference Linacre2020). Internal consistency refers to the extent to which items forming the scale are homogeneous (see DeVellis, Reference DeVellis2017). For an instrument to be internally consistent, items should be correlated with each other as well as with the overall score. The former is referred to as interitem correlations, while the latter is called item-total correlations (ITCs). Critically, item analysis should be performed on items representing a unidimensional scale or on a set of items comprising a subscale of a multidimensional measure. Items that do not correlate strongly with the total score are typically removed from the scale to enhance its reliability (see Zickar, Reference Zickar2020).
Cronbach’s alpha is arguably the most common index of internal-consistency reliability in L2 research (as suggested by Plonsky & Derrick, Reference Plonsky and Derrick2016; Razavipour & Raji, Reference Razavipour and Raji2022). Notably, Cronbach’s alpha remains popular despite a number of rigid assumptions that should be tenable for a reliability estimate based on alpha to be trustworthy (i.e., assumptions of unidimensionality, tau-equivalence, uncorrelated errors, and normal distribution of continuous variables); if these assumptions are not upheld, the estimate will not be accurate (as maintained by McNeish, Reference McNeish2018). For that reason, methodologists recommend using alternative indices that require fewer assumptions to be satisfied (e.g., Guttman’s lambda-2, McDonald’s or Revelle’s omega total, coefficient H, the greatest lower bound; see Cortina et al., Reference Cortina, Sheng, Keener, Keeler, Grubb, Schmitt, Tonidandel, Summerville, Heggestad and Banks2020; McKay & Plonsky, Reference McKay, Plonsky, Winke and Brunfaut2021). On a final note, it should be emphasized that acceptable reliability estimates vary across domains. In L2 research, Plonsky and Derrick’s (Reference Plonsky and Derrick2016) reliability generalization meta-analysis reported a median instrument reliability estimate of .82.
L2 anxiety and WTC: Reasons for inclusion
Arguably the most established affective variable in L2 individual differences research, anxiety has been defined “as the feeling of tension and apprehension specifically associated with second language contexts” (MacIntyre & Gardner, Reference MacIntyre and Gardner1994, p. 284). Although it has been more than four decades since the seminal review by Scovel (Reference Scovel1978) and more than three decades since the seminal works by Horwitz and colleagues on the development and validation of the Foreign Language Anxiety Scale (FLCAS; Horwitz, Reference Horwitz1986; Horwitz et al., Reference Horwitz, Horwitz and Cope1986), language learning anxiety remains one of the most researched topics to date (as noted by Zhang, Reference Zhang2020). In L2 research, anxiety has been typically regarded as a situation-specific variable such as L2-learning anxiety in a particular setting (e.g., in a foreign language classroom as measured by the FLCAS, Horwitz et al., Reference Horwitz, Horwitz and Cope1986; for a short version of the scale, see Botes et al., Reference Botes, van der Westhuizen, Dewaele, MacIntyre and Greiff2022) or in relation to a particular language skill (e.g., L2 speaking anxiety as measured by the Speaking Anxiety Scale; Pae, Reference Pae2013). A meta-analysis of L2 anxiety and achievement by Teimouri et al. (Reference Teimouri, Goetze and Plonsky2019) revealed that the FLCAS was, in fact, the most frequently administered L2 anxiety instrument in their sample (52% of a total of 129 measures). The status of anxiety as a well-established psychological variable in L2 research has been further supported by a mean correlation of −.36 in a sample of 96 studies on L2 anxiety and achievement (Teimouri et al., Reference Teimouri, Goetze and Plonsky2019). A similar result was reported by Botes et al. (Reference Botes, Dewaele and Greiff2020). Nonetheless, the propensity of L2 individual differences research to focus predominantly on negative emotions has been subjected to criticism, and there have been calls to investigate the role of positive variables in L2 development through the lens of positive psychology (e.g., enjoyment; see Botes et al., Reference Botes, Dewaele and Greiff2022; MacIntyre et al., Reference MacIntyre, Gregersen and Mercer2019; Wang et al., Reference Wang, Derakhshan and Zhang2021 for more).
One of the variables that can be fruitfully examined from the positive psychology perspective is WTC, which has been defined as a disposition of an L2 user to initiate a conversation in an L2 (see MacIntyre et al., Reference MacIntyre, Dörnyei, Clément and Noels1998). According to Zhang (Reference Zhang2020), there has been a stable interest in WTC in the field of SLA over the past 20 years. Research on L2 WTC originated in L1 communication research (see McCroskey & Baer, Reference McCroskey and Baer1985). MacIntyre et al. (Reference MacIntyre, Dörnyei, Clément and Noels1998) proposed the construct of L2 WTC, which was redefined as a situation-specific variable affecting not only oral but also written communication in an L2. Furthermore, the researchers identified “over 30 variables that may have potential impact on L2 WTC” (p. 558), including L2 users’ desire to communicate with a particular interlocutor and constructs such as L2 self-confidence. A meta-analysis by Elahi Shirvan et al. (Reference Elahi Shirvan, Khajavy, MacIntyre and Taherian2019) identified L2 anxiety as one of three conceptual correlates of L2 WTC. Similar to L2 anxiety, L2 WTC has been typically measured by self-reports (as noted by Elahi Shirvan et al., Reference Elahi Shirvan, Khajavy, MacIntyre and Taherian2019). For example, an influential study by MacIntyre and Charos (Reference MacIntyre and Charos1996) adapted McCroskey and Baer’s (Reference McCroskey and Baer1985) WTC scale to investigate L1 English Canadian students’ L2 WTC in French. Yashima (Reference Yashima2002), in turn, used the adapted McCroskey’s (Reference McCroskey1992) WTC scale to measure L1 Japanese students’ WTC in L2 English. More recently, Teimouri (Reference Teimouri2017) adapted Yashima’s (Reference Yashima2002) L2 WTC scale for use with L1 Iranian students studying L2 English. In sum, although not as widely researched as L2 anxiety, the concept of L2 WTC has been investigated in a variety of language learning settings and has firmly established its niche in L2 individual differences research.
Critically, the two individual differences of L2 anxiety and WTC seem to be inextricably intertwined. First and foremost, both anxiety and WTC fall under the umbrella term of affect. MacIntyre and Gregersen (Reference MacIntyre, Gregersen and Mercer2012) maintain, “The term ‘affect’ includes many things, such as feelings of self-confidence, feeling willing to communicate, or feeling anxious” (p. 103). Second, these constructs are both conceptually and empirically related, and the relationship is predominantly negative and moderate to large in size. In fact, Elahi Shirvan et al.’s (Reference Elahi Shirvan, Khajavy, MacIntyre and Taherian2019) meta-analysis revealed that L2 anxiety and WTC correlated at r = −.29. Third, both constructs have been extensively measured by self-report questionnaires. In sum, given the interconnectedness of the two constructs and the complementary roles they play in L2 learning, it seemed relevant to include both anxiety and WTC studies in this methodological synthesis.
The present study
This study provides a systematic account of the key features integral to scale quality as they manifest themselves in two key individual differences often examined via surveys: L2 anxiety and WTC; underscores areas that would benefit from methodological enhancement; and, critically, offers empirically grounded suggestions and recommendations for future research (Norris & Ortega, Reference Norris, Ortega, Norris and Ortega2006). The underlying goal is thus to complement and expand the current line of inquiry inspired by methodological reform in L2 research (see Gass et al., Reference Gass, Loewen and Plonsky2021; Marsden & Plonsky, Reference Marsden, Plonsky, Gudmestad and Edmonds2018) by helping move our field toward developing and using more psychometrically sound data collection instruments to have a better understanding of nonlinguistic factors that influence language development. This study investigated the following research question:
To what extent and by what means has scale quality been demonstrated in L2 anxiety and WTC survey research with regard to (a) scale design, (b) scale validity, (c) scale reliability, and (d) reporting practices?
Method
Eligible studies and scales
To define the domain of interest at the study level, three criteria were applied: (a) substantive, or the type of studies to be included, (b) temporal, or the year of publication, and (c) locational, or the outlets in which the studies have appeared. The same three dimensions were employed in Plonsky’s (Reference Plonsky2013, Reference Plonsky2014) methodological syntheses of study quality in L2 research.
Concerning the substantive criterion, eligible studies have been selected from primary quantitative research into L2 anxiety and WTC. In line with Plonsky (Reference Plonsky2014), a study was regarded as quantitative if it presented “one or more numeric results … regardless of the design, sample, instrumentation, and so forth” (p. 467). Thus, all primary qualitative studies, secondary studies, editorials, book reviews, theoretical articles, research timelines, and position papers were excluded. In terms of the temporal criterion, articles published over a 20-year period (2000–2020, excluding studies in advance online publication) were eligible for inclusion. This timeframe appears to be reasonable because the concept of L2 WTC was introduced in the mid-to-late 1990s (e.g., MacIntyre & Charos, Reference MacIntyre and Charos1996; MacIntyre et al., Reference MacIntyre, Dörnyei, Clément and Noels1998).
Regarding sources containing articles of interest, only peer-reviewed journals dedicated to L2 research were eligible for inclusion. Following a number of methodological syntheses (e.g., Amini Farsani et al., Reference Amini Farsani, Jamali, Beikmohammadi, Ghorbani and Soleimani2021; Crowther et al., Reference Crowther, Kim, Lee, Lim and Loewen2021; Plonsky & Derrick, Reference Plonsky and Derrick2016), the search was confined to leading journals in the field, all of which have been included in the Second-Language Research Corpus (Plonsky, Reference Plonskyn.d.) and the full access to which has been granted through the university library. As such, a total of 22 target journals that frequently publish L2 research were examined (see Appendix B). The choice of peer-reviewed journals has been governed by the desire to elucidate the existing state of affairs in the target subdomains of L2 individual differences given that “journals (as opposed to books or other publication formats) constitute the primary means by which SLA research is disseminated” (Plonsky, Reference Plonsky2013, p. 664). Nonetheless, I recognize that this approach might present an overly rosy picture of scale quality in L2 anxiety and WTC research.
Concerning eligible questionnaires, the scope of this methodological synthesis covered empirical studies that employed close-ended self-report scales measuring L2 anxiety and WTC to gather participants’ data. Additionally, a special case was made for so-called combination scales that measured multiple variables in one questionnaire but did not report construct-specific results for them. The articles that acknowledged having combined several constructs into one scale were also included in the present sample.
The search
Two main search channels were used to locate and retrieve eligible studies: (a) journal websites and (b) the Second-Language Research Corpus assembled by Plonsky (n.d.). The corpus contains scholarly articles (N = 24,231 as of November 2021) from 22 leading peer-reviewed journals in L2 research; it has been used to find eligible studies for a number of systematic reviews to date (e.g., Marsden et al., Reference Marsden, Thompson and Plonsky2018). Additionally, following recommendations by Plonsky and Oswald (Reference Plonsky, Oswald and Plonsky2015), complementary searches were conducted in two databases: Linguistics and Language Behavior Abstracts (LLBA) and PsycINFO.
The following search terms and/or combinations thereof were employed to identify potentially eligible publications: anxiety, apprehension, willingness to communicate, WTC, L2 WTC, scale, questionnaire, and survey. Moreover, search terms such as well-known individual scale names (i.e., FLCAS, FLRAS, SLWAT, FLLAS) and subtypes of anxiety (i.e., communication apprehension, fear of negative evaluation, test anxiety) and WTC (i.e., in the classroom, outside the classroom, in digital settings) were tried out to determine whether any additional “hits” would be observed. These search terms were tailored to each of the search channels and online search platforms for each of the journals listed in Appendix B to account for differences in functions available. The PRISMA flow diagram (Page et al., Reference Page, McKenzie, Bossuyt, Boutron, Hoffmann, Mulrow, Shamseer, Tetzlaff, Akl, Brennan, Chou, Glanville, Grimshaw, Hróbjartsson, Lalu, Li, Loder, Mayo-Wilson, McDonald and Moher2021) in Figure 1 summarizes the results across all search channels.

Figure 1. PRISMA flow diagram of included and excluded studies.
Note: Adapted from Page et al. (Reference Page, McKenzie, Bossuyt, Boutron, Hoffmann, Mulrow, Shamseer, Tetzlaff, Akl, Brennan, Chou, Glanville, Grimshaw, Hróbjartsson, Lalu, Li, Loder, Mayo-Wilson, McDonald and Moher2021). L2RC = Second-language Research Corpus (Plonsky, n.d.).
The distribution of eligible articles and scales across the journals and over time is displayed in Figures 2 and 3, respectively. Of note, 2 out of a total of 22 journals did not have eligible studies published in 2000–2020. These journals are Language Awareness and Language Teaching. Given the type of research these journals tend to lean toward, the results are not surprising. Thus, the final sample includes 232 articles (248 independent studies or samples) with 385 scales (anxiety = 321, WTC = 64). As shown in Figure 2, the majority of articles in the sample came from System, The Modern Language Journal, and Foreign Language Annals. Approximately 50% of all anxiety scales in the sample appeared in the same journals. The majority of WTC scales appeared in System, Studies in Second Language Acquisition, and The Modern Language Journal, thereby accounting for 59% of all WTC scales in the sample. Regarding the year of publication (see Figure 3), the published articles reached a peak of their frequency in 2014. The lowest number of target articles was published in 2001. In terms of the questionnaires, the majority of anxiety scales appeared in 2014, whereas WTC scales reached their peak in 2019. See Appendix A for a list of articles included in the synthesis.

Figure 2. Frequency of articles and scales across the target journals.
Note: Articles: N = 232; studies/samples: N = 248; anxiety scales: k = 321; WTC scales: k = 64.

Figure 3. Frequency of articles and scales over time.
Note: Articles: N = 232; studies/samples: N = 248; anxiety scales: k = 321; WTC scales: k = 64.
During the screening stage, a total of 1,518 articles did not meet the eligibility criteria and were, therefore, excluded. Because the goal was to prioritize thoroughness and comprehensiveness over convenience, a large number of false positives was expected. Overall, the majority of articles were excluded because they did not contain the scales of interest and either used qualitative methods to assess participants’ L2 anxiety and WTC (e.g., through interviews) or simply mentioned one of the search terms in the abstract, literature review, discussion, and/or references. During the coding stage, 37 more articles were excluded upon a closer examination. (These articles and the reasons for their exclusion can be supplied upon request.)
Coding scheme
A coding scheme adapted from Sudina (Reference Sudina2021) was used to retrieve and document the necessary information about the variables of interest and answer the research question. This instrument was developed following recommendations from a variety of credible sources including (a) methodological literature on scale design and evaluation (e.g., DeVellis, Reference DeVellis2017; Menold & Bogner, Reference Menold and Bogner2016), (b) relevant methodological syntheses and meta-analyses (e.g., Flake et al., Reference Flake, Pek and Hehman2017; Plonsky, Reference Plonsky2013, Reference Plonsky2014), and (c) meta-analytic book-length treatments and how-to guides (e.g., Cooper, Reference Cooper2016; Plonsky & Oswald, Reference Plonsky, Oswald and Plonsky2015).
The coding sheet was pilot-tested and finalized following several rounds of revisions after incorporating feedback and suggestions from a leading synthetic researcher in the field and two qualified second coders with expertise in quantitative research methods. Afterward, each of the articles and scales was coded by the author. The full coding scheme is available on IRIS (https://www.iris-database.org/; see also Appendix C). The instrument consists of two main parts: Part 1 comprises three categories of variables related to the study (study identification, sample characteristics, and survey characteristics; results pertaining to the last two categories in Part 1 are reported elsewhere); Part 2 includes five additional categories of variables specific to the measures (scale characteristics, reliability, content validity, construct validity, and predictive validity).
Screening and coding procedures
To ensure the accuracy and trustworthiness of screening and coding procedures, a research assistant among advanced PhD students was recruited. Following rigorous training, the research assistant (a) conducted full-text screening of a subset of this study sample (n = 35) following the screening protocol adapted from McKay (Reference McKay2019) and (b) double-coded a subsample of 50 articles comprising 98 scales (anxiety: k = 54; WTC: k = 44), which is in line with Plonsky and Oswald (Reference Plonsky, Oswald and Plonsky2015). Results of interrater reliability for the screening stage indicated that the two judges (the research assistant and the author) had perfect reliability (i.e., percent agreement = 100%; Cohen’s kappa = 1.0; the S index = 1.0, see Norouzian, Reference Norouzian2021). Results of interrater reliability for the double-coding stage before discussing disagreements are demonstrated in Appendix D and were acceptable as well. Following the calculation of interrater reliability statistics, all discrepancies and sources of disagreement were further discussed by the coders until the final agreement reached 100%.
Data analysis
To answer the research question, categorical variables in the coding scheme were analyzed by calculating frequencies and percentages in Excel and SPSS using cross-tabulation. For variables measured at a continuous level (e.g., reliability estimates), other types of descriptive statistics were computed (e.g., medians and interquartile ranges). The unit of analysis was a self-report scale measuring either L2 anxiety or WTC.
To address the subquestion on scale reliability, reliability generalization meta-analysis was performed (see Mckay, Reference McKay2019; Plonsky et al., Reference Plonsky, Marsden, Crowther, Gass and Spinner2020). In the present study, this analysis involved aggregating reliability coefficients across the scales in the sample. Following other systematic reviews in L2 research (e.g., Sudina, Reference Sudina2021), in situations in which reliability was provided for multiple administrations such as in longitudinal surveys, only reliability estimates for the first administration were included. To investigate the relationship between reliability and the scale length, a correlation between reliability estimates and the number of scale items was performed.
Prior to conducting the reliability generalization meta-analysis, z-scores were computed for reliability estimates, and two scales were removed as univariate outliers. Next, assumptions of normality and linearity were checked by examining histograms and normal Q-Q plots and by inspecting a scatterplot. Although the assumption of linearity was satisfied, the assumption of normality was violated. Thus, median reliability estimates along with their interquartile ranges were computed instead of means and standard deviations, and nonparametric Spearman’s rho along with 95% confidence intervals was presented when reporting the results of the correlational analysis. Additionally, the percentage of variance shared by the reliability estimates and scale length was calculated, and the magnitude of the effect size was interpreted based on Plonsky and Oswald’s (Reference Plonsky and Oswald2014) guidelines. Finally, following Plonsky and Derrick (Reference Plonsky and Derrick2016) and Flake et al. (Reference Flake, Pek and Hehman2017), several moderator (or subgroup) analyses were conducted to examine differences in scale reliability.
Although for some scales more than one reliability index was available, typically, Cronbach’s alpha was reported by default, including for all L2 WTC scales and all but eight L2 anxiety scales. Of those eight, three corresponded to Rasch reliability for persons, which is equivalent to Cronbach’s alpha (as argued by Linacre, Reference Linacre2020, p. 698), and the remaining five did not have the type of index specified. Given the overwhelming popularity of Cronbach’s alpha in L2 research (as noted by Plonsky & Derrick, Reference Plonsky and Derrick2016), it is safe to assume that those were Cronbach’s alpha coefficients as well. Therefore, when performing reliability generalization meta-analysis, a subgroup analysis with a reliability index or estimation method as a moderating variable did not seem necessary.
Results
The research question addressed in the present study focused on various scale quality characteristics such as those pertaining to scale design, validity, reliability, and reporting practices. There were 321 L2 anxiety and 64 L2 WTC scales in total. The results for these scales are presented separately side by side to allow for comparisons. The number of scales of interest in the 248 independent studies ranged from one to seven for L2 anxiety and from one to eight for L2 WTC; 25 studies (10%) used both types of scales. As demonstrated in Table 1, the majority of scales were used cross-sectionally rather than longitudinally; the number of scenario-based questionnaires was limited. The number of items (mean = 13, range = 1–40 for anxiety; mean = 11, range = 1–27 for WTC, respectively) and the author of the scale were reported for the majority of scales in the sample.
Table 1. Scale characteristics
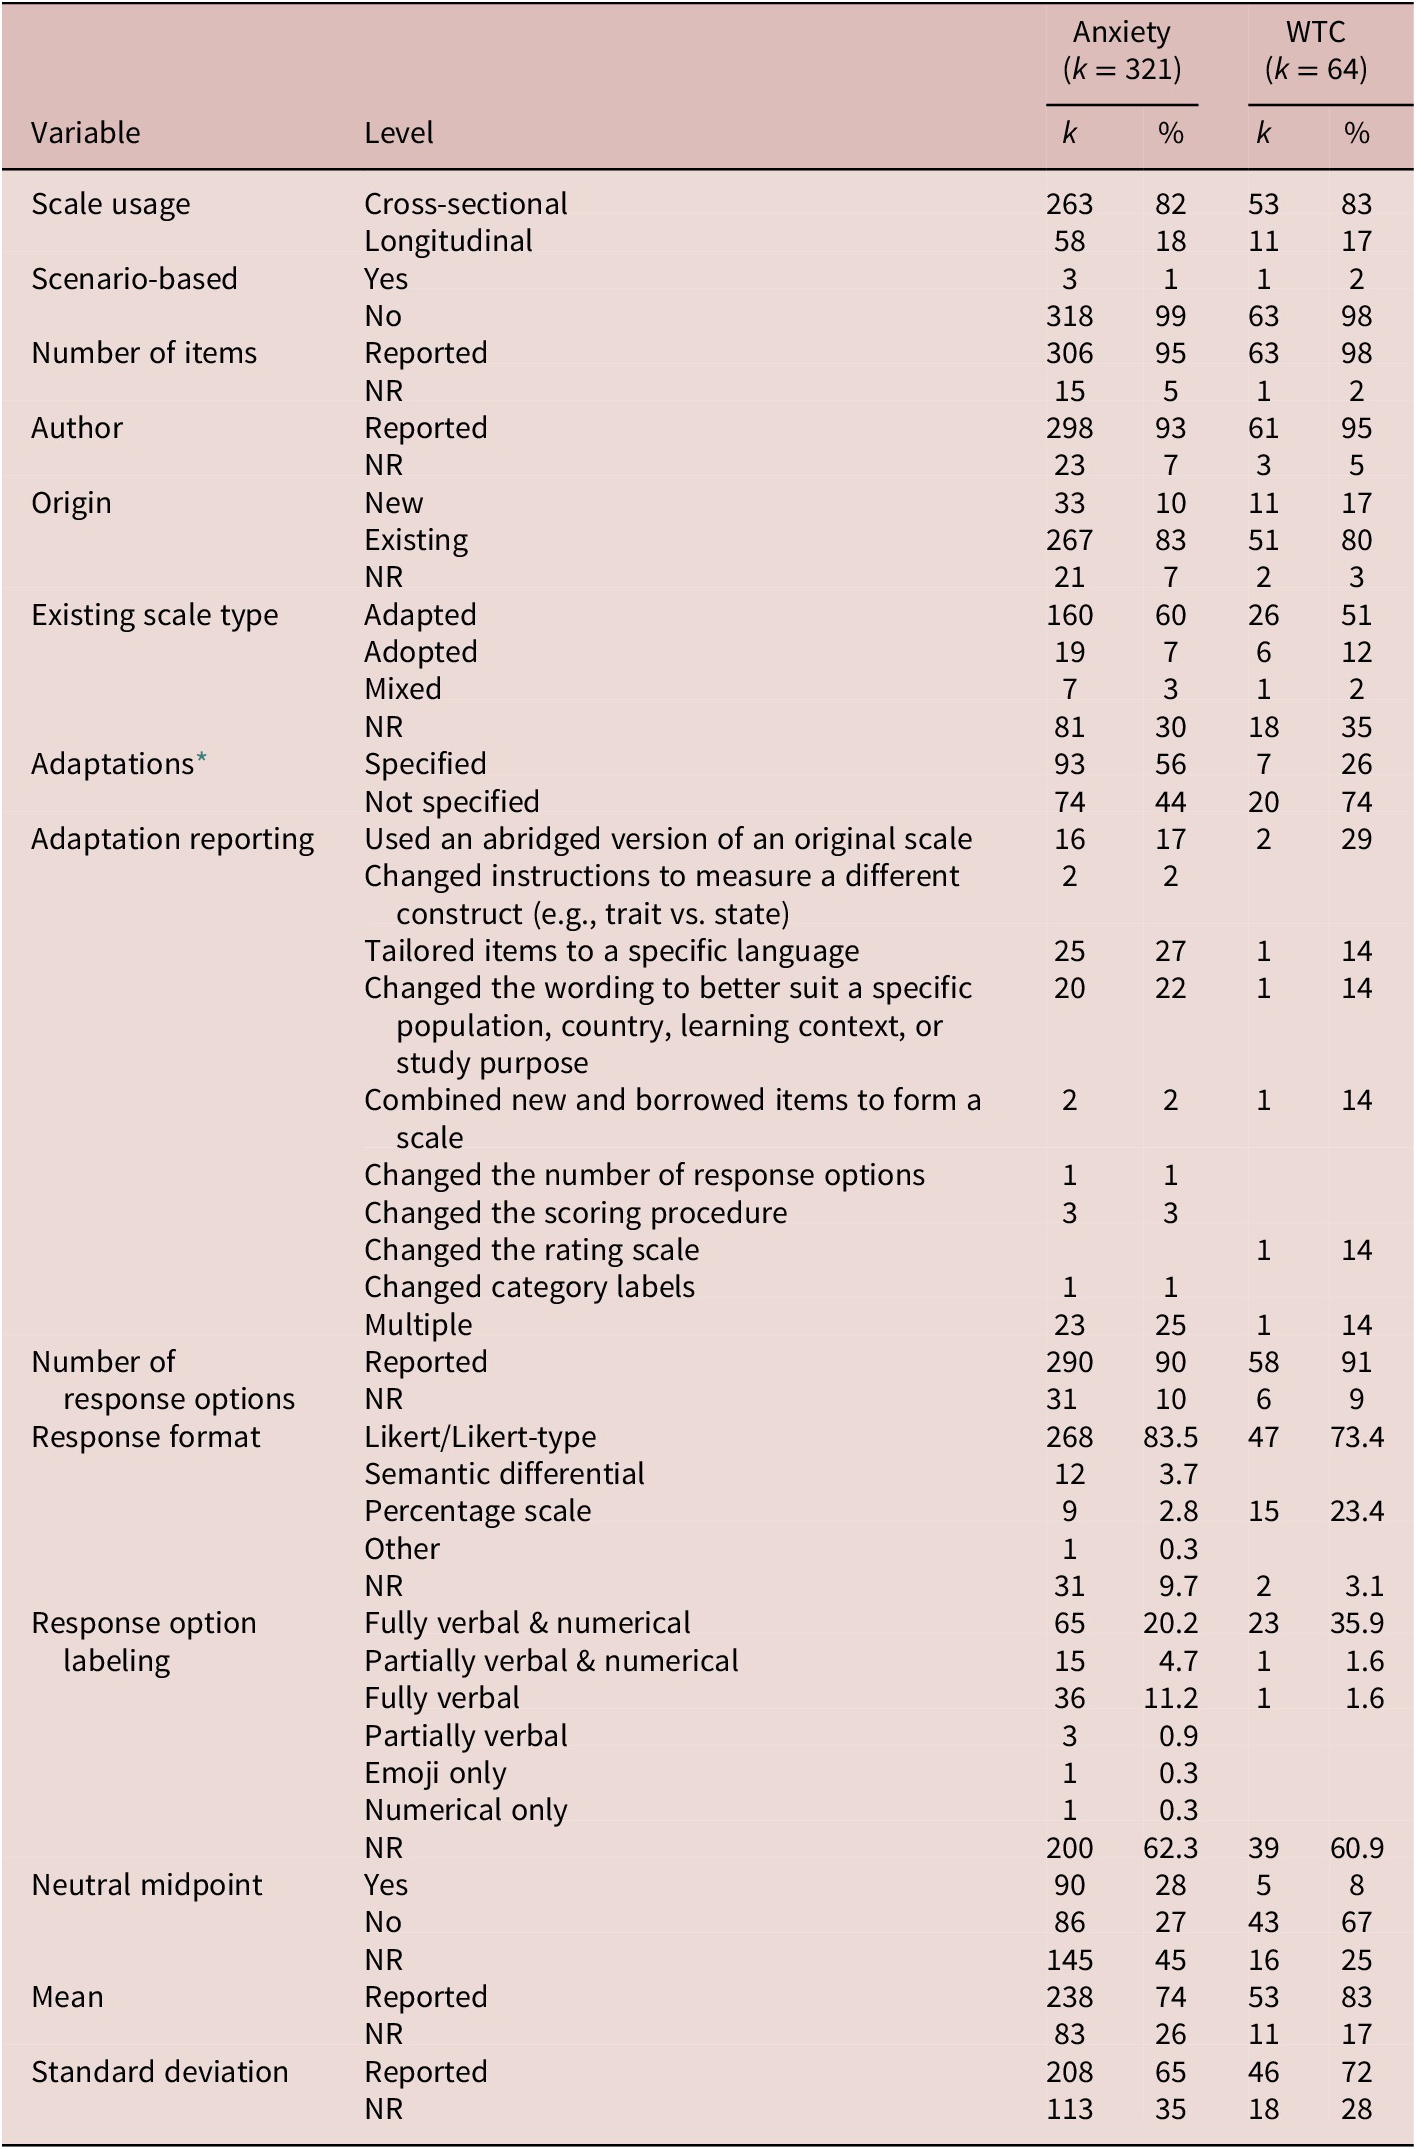
Note: NR = not reported.
* For adapted and mixed scales.
The most frequently reported authors of anxiety scales were Horwitz and colleagues, whose FLCAS (Horwitz et al., Reference Horwitz, Horwitz and Cope1986), either in its original or modified form, constituted over a quarter of all anxiety scales in the sample (26%). The most frequently reported authors of WTC scales were MacIntyre and colleagues (19%) and McCroskey and colleagues (19%). There were more existing rather than newly developed scales in regard to scale origin; among the former, adapted scales were more common than those that were borrowed without modifications; nonetheless, the information regarding the type of existing scales was not always provided, as was the case with adaptation reporting (see Table 1). The types of adaptations reported in primary studies varied both in terms of their scope and number. Some scales were only mildly modified (e.g., by tailoring questionnaire items to a specific language), whereas others underwent more pivotal modifications (e.g., by using an abridged version of a scale, changing the wording of scale items).
Both anxiety and WTC constructs were predominantly measured using Likert and Likert-type rating scales. The number of response options ranged from 3 to 101 for anxiety scales, with a median of five, and from 4 to 101 for WTC scales, also with a median of five. Overall, the number of response options variable was reported more thoroughly compared to the neutral midpoint and response option labeling variables, respectively. Regarding primary researchers’ (i.e., authors of the studies in the sample) disposition to keep or avoid a neutral midpoint, there was no clear preference for anxiety scales, whereas there was a tendency to refrain from using neutral midpoints in WTC scales. The latter may be explained by the fact that almost a quarter of WTC questionnaires were percentage scales that did not include a neutral midpoint (there was a gradation instead). As for the labeling of response options, both anxiety and WTC scales in the sample were typically presented with fully verbal and numerical labels. Finally, scale descriptives such as means and standard deviations of the target constructs were reported for the majority of scales in the sample.
Moving on to the type of scales comprising the sample (see Table 2), 37% of anxiety scales were L2-learning specific, which was expected given a high frequency of usage of the FLCAS (26% of anxiety scales); additionally, scales targeting skill-specific anxieties such L2 speaking, writing, reading, and listening were also quite common (39% of anxiety scales). Turning to WTC scales, two major categories corresponded to (a) language-specific WTC (e.g., in English, French, Chinese, or Spanish) and (b) instructional settings (e.g., inside the classroom, outside the classroom, or in digital settings).
Table 2. Scale type

a Including input, output, and processing anxiety.
Zooming in on scale content validity, Table 3 shows that there were few single-item scales in the sample, which suggests that the majority of scales were multiitem instruments, which were arguably able to grasp a fuller picture of different facets of the target constructs compared to one-item scales. As for item evaluation practices, several studies reported having expert judges or panels examine the extent to which the content of scale items was meaningful, comprehensive, and appropriate for a construct of interest. However, no studies applied Q-sorting, and even expert review was rarely mentioned in primary studies in the sample, which may be because only newly designed scales are typically scrutinized for content validity. Nonetheless, it is desirable to review the content validity of modified and mixed scales as well.
Table 3. Content validity of scales

Note: NR = not reported.
Table 4 displays information related to construct validity of scales comprising the sample. Despite the numerous advantages of Rasch analysis, only a handful of scales were assessed using this method. The multitrait–multimethod matrix method (Campbell & Fiske, Reference Campbell and Fiske1959) was never employed to examine construct validity of scales in the sample. The most frequently reported method to assess construct validity was factor analysis, with PCA being the most popular validation technique for anxiety scales and EFA being the most common validation technique for WTC scales. Several scales were validated using a combination of two-to-three factor analysis techniques, such as EFA and CFA; EFA and PCA; PCA and CFA; CFA and Mokken scaling analysis; or EFA, PCA, and CFA. Nonetheless, the choice of a specific factor analysis technique was not always justified, and for a handful of anxiety and WTC scales, it was unclear which factor analysis technique was used (coded as “Some FA” in Table 4). When CFA was conducted, the fit of the final model was predominantly deemed as either “good” or “moderate” based on a number of fit indices, which ranged from 5 to 12 for anxiety scales (median = 6.5) and from 5 to 11 for WTC scales (median = 6), respectively. Although rare, there were a few instances of measurement invariance tests reported (for anxiety scales only). Evidence of measurement invariance was established—either fully or partially—for all five scales that were subjected to these tests. Further, a handful of scales were examined for convergent and discriminant/divergent validity. In addition to or instead of presenting sample-specific validity evidence for their scales, several studies that used already existing scales opted for reporting validity evidence from a previous study, thereby providing indirect validity evidence for their instruments. Regarding predictive validity of scales comprising the sample, 31.2% of anxiety constructs and 12.5% of WTC constructs were used as predictor variables. The most frequently examined criterion variables were other learner-internal variables (e.g., motivated learning behavior, working memory, L2 utterance fluency, L2 comprehensibility) and language test scores (e.g., the IELTS, receptive vocabulary and grammar, C-test).
Table 4. Construct validity of scales

Note: FA = factor analysis; EFA = exploratory factor analysis; CFA = confirmatory factor analysis; PCA = principal components analysis; NR = not reported; ID = individual difference variable(s).
Apart from scale validity, the research question addressed the issue of scale reliability. As demonstrated in Table 5, (corrected) ITCs were fully reported only for one scale in the sample. The majority of primary study authors in the sample did not report ITCs at all; some researchers provided a mean ITC value for a scale overall or reported ITCs for problematic items only. Reliability was provided for the majority of anxiety and WTC scales. Cronbach’s alpha was the most frequently reported index; three scales were presented with Rasch reliability; additionally, there were several scales with more than one index reported (e.g., Cronbach’s alpha and composite or construct reliability; Cronbach’s alpha and test-retest reliability) as well as scales (k = 5, anxiety) that were accompanied by a reliability estimate without the type of index specified. Of note, both anxiety and WTC scales were predominantly unidimensional; however, scales consisting of several factors were also present, but information about subscale reliability was not always available.
Table 5. Reliability of scales

Note: ITC = item–total correlation; NR = not reported.
The results of reliability generalization meta-analysis are demonstrated in Table 6 and Figure 4. A median reliability value for the scales accompanied by a reliability estimate was .88 (.11). Moderator analyses revealed that (a) WTC scales yielded higher reliability than anxiety scales; (b) scales that were not reported to have been piloted had higher reliability than the piloted ones; (c) scales with some factor analysis reported demonstrated lower internal consistency compared to scales without any factor analysis reported; (d) existing scales with explicit references to validity checking in previous studies had higher reliability compared to new scales and existing scales without validity reference; and (e) scales from studies published in journals with the highest scientific level (based on the rankings in the Norwegian Register for Scientific Journals) were similarly reliable to scales from articles published in journals with the second-highest scientific level. The correlation between the estimates of reliability and the number of items was positive and constituted a large effect size: ρ(272) = .65, 95% CI [.57, .71], p < .001 (Plonsky & Oswald, Reference Plonsky and Oswald2014), indicating (a) that the two variables shared 42% of the variance and (b) that the longer the scale, the higher its reliability.
Table 6. Reliability estimates overall and differentiated by moderator variables

Note: k = number of scales; IQR = interquartile range; NA = not available.

Figure 4. Scale reliability: Subgroup analyses (K = 278).
Discussion
To answer the research question that guided this study, a representative sample of 232 articles comprising 248 independent studies (or samples) with 385 eligible scales (anxiety = 321; WTC = 64) was collected by conducting searches in 22 leading L2 journals. Regarding scale quality characteristics and reporting practices, given a high number of adapted and mixed scales in the present sample (i.e., 63% of existing anxiety scales and 53% of existing WTC scales), a few suggestions should be provided for those researchers who choose to modify an existing scale to make it most suitable for their study purpose. First and foremost, one should keep in mind that the more adaptations are made, the more they affect the scale’s psychometric properties (e.g., it is often the case that an abridged scale has lower reliability, whereas a scale that underwent multiple alterations may have a different factor structure compared to the original one). Therefore, a scale with major modifications should be subjected to extensive validity and reliability checks; simply referring to a previous validation study as a means of providing implicit validity evidence for an adapted scale is not considered good practice because “the psychometric information provided by the citation may not extend to the adapted version” (Flake et al., Reference Flake, Pek and Hehman2017, p. 373). When creating a short version of a scale, which was one of the most popular types of scale adaptation in the sample, researchers should decide on a method that would enable them to select the best combination of items and create an abridged scale with high validity and reliability. One relatively simple approach is to use exploratory factor analysis and select items with the highest discrimination scores (to compute a discrimination score, subtract the average of the item’s absolute factor loadings on other factors from the item’s primary factor loading; see Donnellan et al., Reference Donnellan, Oswald, Baird and Lucas2006). Jebb et al. (Reference Jebb, Ng and Tay2021) advocated for the ant colony optimization (ACO) approach, which, unlike other commonly used techniques such as selecting items that have the highest ITCs and factor loadings, allows researchers to account for multiple criteria when retaining eligible items. The main drawback of ACO, however, is that it is an automated procedure that does not consider items’ content validity. According to Jebb et al. (Reference Jebb, Ng and Tay2021), “the items that comprise the final scale should always be examined to see if their content is sufficient” (p. 11). Item content evaluation is highly recommended for all considerably adapted scales and can be implemented by the means of traditional expert review as well as Q-sorting.
Moving on to the psychometric properties of the scales in the sample, multiitem scales were in the majority (i.e., 92% of anxiety and 95% of WTC scales, respectively). This puts L2 individual differences research at an advantage with regard to scales’ content validity compared to several other disciplines (e.g., there were 70% of multiitem scales in Flake et al.’s [2017] review of articles published in the Journal of Personality and Social Psychology and only 51% of studies without single-item scales in Kim’s [2009] review of articles published in the Journal of the American Society for Information Science and Technology). However, other evidence of scale validity in the present sample was often scarce and not thoroughly reported (of note, similar trends were observed by Sudina, Reference Sudina2021).
Concerning construct validity, some techniques for assessing the internal structure of scales appeared to be more commonly employed than others. For example, 24% of anxiety scales and 31% of WTC scales were presented with structural validity evidence from factor analysis; only five scales were examined using Rasch analysis (for a recent example of a Rasch validation study in L2 research, see Leeming and Harris, Reference Leeming and Harris2022): 1.2% of anxiety scales and 1.6% of WTC scales; and no target scales were assessed using the multitrait–multimethod matrix, which is perhaps not surprising given that “datasets used by applied researchers rarely lend themselves to MTMM analysis” (Rönkkö & Cho, Reference Rönkkö and Cho2022, p. 6). Another way to analyze rating scales is to apply Bayesian techniques to ordinal questionnaire data (see Veríssimo, Reference Veríssimo2021). However, this approach is yet to be embraced by L2 researchers of individual differences. Next, limited evidence was available in support of scales’ measurement invariance with no WTC scales and only 1.5% of anxiety scales being tested (this was done using multigroup CFA or by other means such as ordinal logistic regression for DIF detection and a series of ANOVA tests). Surprisingly, invariance tests were performed on existing scales only; no new scales in this sample were checked for measurement invariance.
Other rarely examined facets of construct validity in the sample were convergent (6% of anxiety scales) and divergent/discriminant validity (5% of anxiety scales and 2% of WTC scales). To provide evidence of convergent validity, the authors of primary studies in the sample typically calculated the average variance extracted and construct reliability, performed correlational analyses, and/or examined factor loadings. To establish discriminant/divergent validity, the researchers generally compared average variance extracted values with squared interconstruct correlations or performed other correlational analyses; one study reported having performed Mokken scale analysis to examine discriminant validity.
The main argument behind examining instruments’ discriminant validity is that insufficient testing thereof leads to construct proliferation (as argued by Jebb et al., Reference Jebb, Ng and Tay2021); this, in turn, gives rise to various jangle fallacies. Another concern related to discriminant validity was raised by Rönkkö and Cho (Reference Rönkkö and Cho2022). In their review of organizational research articles published in the Academy of Management Journal, the Journal of Applied Psychology, and Organizational Research Methods, the researchers noticed that primary study authors in their sample rarely defined what they meant by “discriminant validity”; notably, when the definition was provided, there appeared to be no uniform understanding of the term, and techniques used to examine discriminant validity varied substantially. Arguing that “discriminant validity is a feature of a measure instead of a construct” (p. 11), Rönkkö and Cho grouped the main techniques for evaluating discriminant validity in their sample into “(a) techniques that assess correlations and (b) techniques that focus on model fit assessment” (p. 15). Compared to Rönkkö and Cho’s findings, the primary authors in the present study also rarely defined discriminant validity—that is, only two out of five studies in the sample investigated discriminant validity; in both cases, discriminant validity was referred to as a property of a construct, and the decision regarding the evidence of discriminant validity was predominantly based on correlational analyses. To conclude, L2 individual differences research would benefit from greater transparency with respect to discriminant validity definition and assessment.
Further, a note of caution should be offered regarding the creation of so-called combination scales. In the present study, four studies combined several measures tapping theoretically distinct constructs to form a new scale arguably measuring yet another latent construct. The reasons for creating blended scales were either not reported, included practical considerations such as a small sample size that imposed limitations on the types of statistical analyses that could be performed, or used previous research findings along with high reliability of the combination scale as a justification. According to Flake et al. (Reference Flake, Pek and Hehman2017), this practice lacks theoretical rationale because the average score across blended scales does not represent a single construct, thereby “conflating several distinct psychological processes” (p. 375).
Concerning scale reliability, although the findings were to a large extent congruous with other related L2 syntheses, several discrepancies emerged as well. For example, the overall scale median reliability of .88 in the present study is slightly higher than the mean scale reliability of .82 reported by Sudina (Reference Sudina2021) and the median instrument reliability of .82 found by Plonsky and Derrick (Reference Plonsky and Derrick2016). Concerning anxiety scales, a median estimate of .87 is similar to that obtained by Teimouri et al. (Reference Teimouri, Goetze and Plonsky2019): mean = .88, standard deviation = .06. In terms of WTC scales, their median estimate of .90 cannot be compared to the corresponding estimate in Elahi Shirvan et al. (Reference Elahi Shirvan, Khajavy, MacIntyre and Taherian2019) because the latter did not concern with scale reliability.
With regard to other subgroup analyses, scales that were not reported to have been pilot-tested and those whose internal structure was not examined using factor analysis had higher reliability compared to their counterparts. The results by piloting status, although somewhat counterintuitive, align with the findings of Plonsky and Derrick (Reference Plonsky and Derrick2016) and Sudina (Reference Sudina2021). It may be the case that some studies failed to report that their instruments had undergone pilot-testing, and the lower reliability of piloted scales could just be an artifact of limited transparency in reporting. As for the subgroup analysis by factor analysis status, scales that were factor analyzed may have had lower reliability because they had fewer items. In fact, this is exactly what the correlation between the number of items and the estimates of reliability suggested. The remaining subgroup analysis results were as expected: Scales accompanied by a validity reference had higher reliability than those that were not; scales published by journals that had the highest and second-highest level of scientific quality as determined by the Norwegian Register for Scientific Journals had higher reliability than scales published by a journal that was not indexed in the register.
Concerning reliability reporting practices, single- and two-item scales deserve special attention. For single-item measures, reliability can be estimated based on either the test-retest method or a correlation with another instrument tapping the same latent variable (see DeVellis, Reference DeVellis2017; Kim, Reference Kim2009). However, in the current sample, no reliability evidence for one-item scales was provided. Regarding scales consisting of two items, Spearman’s rho coefficient is preferred over Cronbach’s alpha (as suggested by Eisinga et al., Reference Eisinga, te Grotenhuis and Pelzer2013). Yet in the present sample, reliability of two-item scales was either not examined at all or determined by Cronbach’s alpha. The latter was, in fact, the most frequent reliability index in the sample. Although this aligns with the findings of other systematic reviews both in and outside the domain of L2 research (e.g., Cortina et al., Reference Cortina, Sheng, Keener, Keeler, Grubb, Schmitt, Tonidandel, Summerville, Heggestad and Banks2020; Flake et al., Reference Flake, Pek and Hehman2017; Plonsky & Derrick, Reference Plonsky and Derrick2016), there may be situations in which other reliability coefficients would be more appropriate.
Finally, the results suggested that reporting practices associated with instrument quality in L2 survey research into anxiety and WTC require greater transparency to comply with and promote open data practices. Specifically, the most underreported characteristics related to scale design included (a) the type of existing scale (i.e., adapted, adopted, or mixed; not reported for 30% of anxiety scales and 35% of WTC scales); (b) the type of adaptations for modified scales (not reported for 44% of anxiety scales and 74% of WTC scales); (c) response option labeling (not reported for 62.3% of anxiety scales and 61% of WTC scales); and (d) the inclusion or exclusion of a neutral midpoint (not reported for 45% of anxiety scales and 25% of WTC scales). The most underreported attributes of scale reliability were ITCs (not reported for 94.1% of anxiety scales and 98% of WTC scales). Finally, the most underreported characteristics related to scale validity included (a) item evaluation for establishing content validity (not reported for 90% of anxiety scales and 86% of WTC scales); (b) factor analysis results (not reported for 76% of anxiety scales and 69% of WTC scales); (c) measurement invariance (not reported for 98.4% of anxiety scales and 100% of WTC scales); (d) convergent validity (not reported for 94% of anxiety scales and 100% of WTC scales); (e) divergent/discriminant validity (not reported for 95% of anxiety scales and 98% of WTC scales); and (f) validity reference for existing scales (not reported for 73% of anxiety scales and 75% of WTC scales). Although bleak and worrisome, the current picture of the state of affairs in the two subdomains of L2 individual differences is in many ways similar to what was observed in the neighboring disciplines of personality and social psychology as well as industrial and organizational psychology.
For example, Flake et al.’s (Reference Flake, Pek and Hehman2017) review of 433 scales investigated the types of construct validation evidence employed in 35 randomly chosen articles published in the Journal of Personality and Social Psychology in 2014. Although this review focused exclusively on the information reported in the “Method” section, the results indicated that the sample was replete with studies that provided insufficient psychometric evidence of scale reliability and validity and employed questionable practices during the process of construct validation. Concerning reliability, first, an array of studies relied on Cronbach’s alpha as the only means of structural validity evidence. Second, specific reliability estimates were not always reported. Finally, some studies merged separate scales into one to increase instrument reliability. In terms of validity, first, only 53% of scales were accompanied by a reference to a previous validation study, but 19% of these scales were adapted, suggesting that the use of citations may not have been justified. Second, only one study employed tests of measurement invariance. Finally, 30% of scales in the sample contained only one item, thus casting doubt on the content validity of the instruments intended to measure latent variables.
Building on Flake et al. (Reference Flake, Pek and Hehman2017), Hussey and Hughes (Reference Hussey and Hughes2020) performed a comprehensive validation of 15 self-report individual differences questionnaires (26 scales; 81,986 participants) that are commonly used in the field of social and personality psychology. Using rigorous statistical tests, the researchers evaluated the measures for (a) internal-consistency reliability (based on omega rather than Cronbach’s alpha), (b) test-retest reliability, (c) CFA, (d) measurement invariance (by assessing configural, metric, and scalar invariance for age and gender), and (e) overall structural validity, which was considered as “good” if the results of procedures a through d received an evaluation of “good” or “mixed.” The results revealed that (a) 88% of scales in their sample passed the test of internal-consistency reliability, (b) 100% of scales passed the test of test-retest reliability, (c) 73% of scales possessed good factor structure, and (d) only one scale (4%) appeared to be measurement invariant with regard to both gender and age. Hussey and Hughes (Reference Hussey and Hughes2020), therefore, argued that the issue revealed by Flake et al. (Reference Flake, Pek and Hehman2017) was likely to be more serious than underreporting. Rather, their results pointed to a problem of “hidden invalidity” (p. 166).
In the field of industrial and organizational psychology, a methodological synthesis by Cortina et al. (Reference Cortina, Sheng, Keener, Keeler, Grubb, Schmitt, Tonidandel, Summerville, Heggestad and Banks2020) surveyed 170 articles containing 9,119 “fallible” scales (i.e., those that were targeting a latent construct and were, therefore, prone to measurement error) published in four leading journals in psychology and organizational sciences. The results revealed that scale reliability and instrument validation practices often fell short of the gold standard for measurement instrument design and evaluation. First, the authors noted the overreliance on Cronbach’s alpha (67% of a total of 3,334 multiitem scales in the sample). Second, the majority of measures in their sample were single-item scales (k = 4,783), and reliability was available only for 20% of these scales. Finally, reliability was missing for 23% of multiitem scales. The researchers concluded that “hallmarks of recommended practice” for developing and evaluating scales were frequently “absent from actual practice” (p. 1356).
This brief review of methodological practices in the neighboring disciplines suggests that scale quality problems reported in the present study are not specific to SLA. Rather, they can be observed across other dimensions of social science research as well. This means that we can learn from these relevant fields by incorporating their solutions. Cortina et al. (Reference Cortina, Sheng, Keener, Keeler, Grubb, Schmitt, Tonidandel, Summerville, Heggestad and Banks2020) argued that the process of scale development and validation “can be framed as an optimization problem,” with “psychometric soundness” being the goal of optimization despite the inevitable challenges that psychometricians face in real-life situations (p. 1352). However, the reality is that some researchers are making too many compromises, which may result in compromising scale robustness.
The framework of construct validation outlined by Flake et al. (Reference Flake, Pek and Hehman2017) and Hussey and Hughes (Reference Hussey and Hughes2020) proposed a three-phase approach to presenting construct validity evidence, including substantive, structural, and external phrases. According to this framework, the substantive phase concerns construct conceptualization and operationalization based on existing theory and research; the structural phase refers to the examination of psychometric properties of a scale measuring the construct of interest; the external phase involves the investigation of the relationships between a given scale and other measures (e.g., through convergent, discriminant, and predictive validity). Critically, the first two phases are prerequisites for the meaningful interpretation of the results obtained in the final (external) phase. However, Hussey and Hughes lamented that the second (structural) phase rarely receives the attention it deserves, which imposes constraints on the replicability of research findings. Moreover, the researchers cautioned others against engaging in unethical procedures of v-hacking (i.e., validity hacking), or “selectively choosing and reporting a combination of metrics … so as to improve the apparent validity of measures,” and v-ignorance, or “relying on and reporting those metrics that other researchers have used, without considering the issues underlying their use” (pp. 180–181).
Taken together, the findings of Flake et al. (Reference Flake, Pek and Hehman2017), Hussey and Hughes (Reference Hussey and Hughes2020), and Cortina et al. (Reference Cortina, Sheng, Keener, Keeler, Grubb, Schmitt, Tonidandel, Summerville, Heggestad and Banks2020) have important implications for L2 survey research. Critically, the hidden structural invalidity described above is an avenging nemesis of scale and, consequently, study quality. Therefore, it is necessary to examine the pervasiveness of the problem across various subdomains of L2 research. This can be done by comprehensively surveying evidence of structural validity of L2 scales tapping different constructs. In closing, we as a field need to go beyond routinely reporting Cronbach’s alpha and include rigorous structural validity testing and thorough reporting thereof in the arsenal against both v-hacking and v-ignorance.
Limitations and suggestions for future research
Although this methodological synthesis represents one of the first inquiries into L2 survey research in the domain of individual differences, it is not without limitations. First, for the sake of keeping the sample of primary studies manageable, restrictions had to be imposed on the scope of the synthesis, which focused on two learner-internal variables frequently measured by self-report questionnaires: L2 anxiety and WTC. As such, the study results are not generalizable to all individual differences (e.g., self-efficacy) or other types of survey instruments (e.g., informant-based scales, observation checklists, open-ended questionnaires, and interviews). Pursuing similar questions in future conceptual replications will shed light on potential similarities and differences in the state of instrument quality in other subdomains of L2 individual differences and SLA more generally (e.g., L2 vocabulary assessment, L2 reading measures). Additionally, even though the results of this study were largely comparable to those reported by Sudina (Reference Sudina2021), future studies could examine additional outlets publishing L2 research (e.g., Computer Assisted Language Learning, Personality and Individual Differences) as well as include studies published before 2000 and after 2020.
Another limitation concerns the scope of scale validity features that were examined. Specifically, because of the multifaceted composition of criterion-related validity that can take multiple forms, including concurrent, predictive, incremental, and postdictive validity (as noted by DeVellis, Reference DeVellis2017), this type of validity could not be comprehensively evaluated in this study; it requires high-inference items in the coding scheme which inevitably involve increased subjectivity on the part of coders. It seems that the best way to examine criterion-related validity of self-report scales is to conduct a meta-analysis of primary studies that provided some evidence thereof (e.g., multiple regression coefficients indicating “the strength of the prediction made by the four skill-based anxieties on the FLCAS scores” as in Pae, Reference Pae2013, p. 248). Nonetheless, one aspect of criterion-related validity that this methodological synthesis managed to address was the nature of the criterion variable when L2 anxiety and WTC were used as predictors. Overall, this collection of primary studies appears to represent the domain of L2 anxiety and WTC well, but conceptual replications are warranted to gain a fuller picture of the state of study and scale quality in L2 survey research.
Conclusion
Given that the use of questionnaires is ubiquitous in individual differences research, but the quality of these instruments has often been subjected to criticism, this study set out to comprehensively examine the validity and reliability of self-report instruments targeting L2 anxiety and WTC and review methodological choices pertaining to scale quality. Despite a number of meritorious methodological practices observed cumulatively over a 20-year period, as a field, we still have a long way to go. Particularly problematic is the lack of evidence for scale content and construct validity, including testing for measurement invariance and referring to previous validation studies for existing scales.
These and other methodological concerns raised in this study pose a serious ethical issue. In survey research, unethical practices such as v-hacking and v-ignorance (Hussey & Hughes, Reference Hussey and Hughes2020) severely undermine questionnaire and study quality due to their potential to compromise the study findings. Therefore, it is our collective responsibility as primary study authors, synthetic researchers, journal editors, and peer reviewers—to name a few, to promote greater transparency and higher quality of scales in the domain of L2 individual differences and applied linguistics more generally and place more value on training in research methodology and research ethics (see also Isbell et al., Reference Isbell, Brown, Chan, Derrick, Ghanem, Gutiérrez Arvizu, Schnur, Zhang and Plonsky2022). To conclude this study on a more positive note, there are reasons to hope that instrument quality seeds planted by methodological syntheses will continue to germinate and lead us to a better understanding of SLA processes and their implications for L2 instruction.
Acknowledgments
This work is part of a larger project (my dissertation study), which was conducted at Northern Arizona University and supported by a Language Learning Dissertation Grant (2021, Contract #21.0293; NAU ID #1004773). I would like to thank Luke Plonsky, Vedran Dronjic, Naoko Taguchi, and Shaofeng Li for their guidance and feedback. I am also grateful to Yuhang Hu for her help with data coding. Finally, I wish to thank Kazuya Saito as well as the four anonymous reviewers for their comments and suggestions.
Supplementary Materials
To view supplementary material for this article, please visit http://doi.org/10.1017/S0272263122000560.
Data Availability Statement
The experiment in this article earned an Open Materials badge for transparent practices. The materials are available at https://www.iris-database.org/iris/app/home/index.
Competing Interests
The author declares none.


 Open access