


Adopting healthy dietary habits is crucial in promoting health and preventing nutrition-related chronic diseases(1). Socio-economic differences in dietary habits are amply documented. Thus, measures to promote healthy nutrition to all should be developed to address diet-related health inequalities(Reference Bambra, Joyce and Bellis2).
A healthy diet includes plenty of vegetables, fruit and fibre, whereas intakes of saturated fat, salt and sugar should be limited. Nutrition recommendations are relatively well known, yet many consumers find it difficult in practice to follow a healthy diet. While the number of different food products and, as a result, options in supermarkets increases, food choices become more challenging(Reference Cowburn and Stockley3).
Front-of-pack nutrition icons on products with relatively favourable product compositions have been introduced in some countries to help consumers make healthier choices(Reference Vyth, Steenhuis and Vlot4). For example, the Green Keyhole has been in use in Sweden(Reference Larsson, Lissner and Wilhelmsen5) and Pick the Tick programme in Australia(Reference Noakes and Crawford6) since the late 1980s. More recently, the Choices health logo has been introduced in the Netherlands(Reference Vyth, Steenhuis and Vlot4) and the Smart Choices programme in the USA(Reference Lupton, Balentine and Black7). These front-of-pack labelling formats differ not only by appearance but also by regulations on which the right to use a logo on products is based and by authorities responsible for the system in each country. For example, in Sweden, the Green Keyhole logo was introduced by the Swedish National Food Administration(Reference Larsson, Lissner and Wilhelmsen5), whereas in Australia, the Heart Foundation created the Pick the Tick logo based on national criteria for salt, energy, fibre and added sugar(Reference Noakes and Crawford6). In the USA, in turn, the criteria are based on the 2005 Dietary Guidelines covering nineteen product categories and six nutrients and, in some cases, energy(Reference Lupton, Balentine and Black7).
In Finland, the need for nutrition labels to help consumers make healthier food choices was emphasized in the consensus statement for promoting Finnish heart health in 1997(8). Three years later, i.e. in 2000, the system including a front-of-pack logo, the Heart Symbol, was developed for Finnish consumers and launched jointly by the Finnish Heart Association (FHA) and the Finnish Diabetes Association (FDA). The development was based heavily on the work of Finnish experts in the field of nutrition and medicine, and there was active collaboration with the Finnish Food Safety Authority and other relevant authorities that has continued since then. From the very beginning of the process, the aim was to build a labelling system that in the best possible way fits in with Finnish food culture and tackles the challenges in public health nutrition prevalent in Finland. At first it was concluded that excessive intakes of fat, hard fat and salt are the main nutrition challenges in Finland, and therefore the Heart Symbol focuses on these nutrients. The main sources of these nutrients were defined by using the national FINDIET study(9).
The Heart Symbol tells the consumer at a glance that the product marked with this symbol is a better choice in its product group regarding fat (quantity and quality) and sodium. In some product groups, also sugar and fibre contents are taken into account. The criteria for the symbol are based on the Finnish nutrition recommendations(10). In all, the criteria are defined for nine main food groups that may further be divided into subgroups. The main food groups include: milk and dairy products; oils and fats; fish; meat; meat products; bread and cereal products; convenience foods; spices and seasoning sauces; and vegetables, fruits and berries. The criteria are regularly updated, if needed, by the Heart Symbol expert group, which includes six professionals in nutrition and medicine appointed by the organisations in charge, i.e. FHA and FDA.
To be able to carry the Heart Symbol, food companies need to apply for the right to use the symbol for products that comply with the defined food category-based criteria. The rights are granted by the organisations in charge based on decisions made by the expert group, which considers the applications together with questions related to continuously controlling the validity of the products. The right to use this symbol is subject to an annual charge (ranging from 100€ to 500€ per product) but the system is not designed to bring profits. The fees collected are currently the only source of funding for the system, and are used to keep up the system, including e.g. spot checks to control that the nutritional content of the product having obtained the right to use the Heart Symbol corresponds to that given as the criteria for granting.
Since 2000, the FHA and FDA have worked hard to make the Heart Symbol known by the public. Brochures have been printed for different target groups, the system has its own homepage and there have been multiple advertising campaigns in different media. Especially, companies are encouraged to use the Heart Symbol in marketing their own products with the symbol. Currently more than 750 products on the Finnish market have the right to carry the symbol.
The aim of the present study was to investigate how well Finnish consumers with different age and educational background are familiar with the symbol, and whether the awareness has changed over a 9-year period. In addition, the reported use of products with the symbol was investigated.
Methods
Data for the present study were derived from a series of annual, nationally representative, cross-sectional population surveys on Health Behaviour and Health among the Finnish Adult Population (AVTK). For each survey, a random sample from the Finnish population aged 15 to 64 years is drawn from the National Population Register and some 5000 Finns have received a mailed questionnaire annually since 1978. The response rate has decreased over the years from 63 % to 51 % in men and from 76 % to 67 % in women. A more detailed data description has been published elsewhere(11).
Questions on the Heart Symbol have been included in the survey since 2001. Therefore, the present study covers the 9-year data (2001–2009) including 13 196 male and 16 182 female respondents. The numbers of the respondents in 10-year age groups and study periods are presented in Table 1.
Table 1 Number of male and female respondents in the Health Behaviour and Health among the Finnish Adult Population monitoring surveys in 2001–2009 by age group, educational tertile and study year period

Number of missing in self-reported school years: men 179, women 230.
The questionnaire includes two questions on the Heart Symbol. First, it is asked whether the respondent is aware of the Heart Symbol with the following question: ‘Some foods can be labelled with the Heart Symbol. Are you familiar with this symbol?’ The options were ‘yes’ and ‘no’. Second, it is asked whether the respondent has used products with the symbol during the past 12 months with the following question: ‘In the past year (12 months), have you used products with the Heart Symbol?’ with the options ‘yes’ and ‘no’. The formulation of the questions has remained the same since 2001 with an exception for the second question, in which the time reference (the past year) was included for the first time in 2004. A picture of the symbol is not shown in the questionnaires.
Educational status is inquired by asking the total number of years at school. A measure of relative education was used by categorising all respondents by gender and each year-of-birth cohort into three equally large education categories. Each respondent was thus slotted into the lowest, intermediate or highest tertile of education based on self-reported school years. For the analysis of educational differences, only respondents aged 25–64 years were included (Table 1). Justifications for this decision include that educational level can be considered sufficiently stable only in those older than 24 years of age.
For the analyses of the awareness of the Heart Symbol and the use of products with the symbol, the cross-sectional surveys were divided into the following five study periods: 2001–2002, 2003–2004, 2005–2006, 2007–2008 and 2009.
Statistical analyses
All analyses were carried out separately for men and women. Age-standardised prevalence of respondents familiar with the Heart Symbol and of respondents who have used products with the Heart Symbol by educational level during the different study periods were calculated using direct age standardisation, with the total study population as the standard population.
Logistic regression models were used to examine differences between the population subgroups. In the models, either the awareness of the symbol or the use of the symbol was used as a dependent variable. Age group, education group and study period were used as independent variables. As significant interactions between education and study period were found, differences in educational groups were investigated in two study periods (2001–2004 and 2005–2009) separately. The results of logistic models are presented as odds ratios and their 95 % confidence intervals.
The differences in respondents familiar with the Heart Symbol and respondents who had used products with the Heart Symbol between the age and educational groups for the study periods were tested with models that included the interaction terms age group × study period, for investigating whether the secular trend varied by age, and educational group × study period, for investigating whether the trend varied by education. All analyses were conducted using the PASW (formerly SPSS) for Windows statistical software package version 17 (SPSS Inc., Chicago, IL, USA).
Results
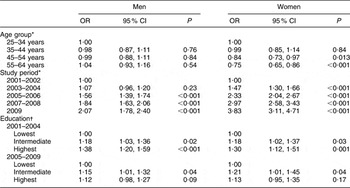
As shown in Table 2, the awareness of the symbol has increased since the early 2000s. Compared with the first two-year period, men were twice more likely (OR = 2·07; 95 % CI 1·78, 2·40) and women almost four times more likely (OR = 3·83; 95 % CI 3·11, 4·71) to be aware of the symbol in 2009. In 2001–2002, 48 % of men and 73 % of women reported to be familiar with the symbol, whereas the corresponding rates were 66 % for men and 91 % for women in 2009. Both in men and women, the awareness has increased in all age groups over the years (Fig. 1).
Table 2 Odds ratio and 95 % confidence interval for being aware of the Heart Symbol by age group and study period, and by relative education (educational tertile) in two study periods, in men (n 13 196) and women (n 16 182): Health Behaviour and Health among the Finnish Adult Population monitoring surveys in 2001–2009
*Logistic model: age group + educational group + study period.
†Logistic model: age group + educational group.

Fig. 1 Proportion (%) of (a) male and (b) female respondents being aware of the Heart Symbol in 2001–2009, by 10-year age group (![]() , 15–24 years;
, 15–24 years; ![]() , 25–34 years;
, 25–34 years; ![]() , 35–44 years;
, 35–44 years; ![]() , 45–54 years;
, 45–54 years; ![]() , 55–64 years;
, 55–64 years; ![]() , total): Health Behaviour and Health among the Finnish Adult Population monitoring surveys. Logistic model; P value for interaction age group × study period: P = 0·16 for men, P = 0·06 for women
, total): Health Behaviour and Health among the Finnish Adult Population monitoring surveys. Logistic model; P value for interaction age group × study period: P = 0·16 for men, P = 0·06 for women
The proportion of those being familiar with the symbol did not vary by age in men, whereas older women (aged 45–64 years) were less likely to be aware of the symbol compared with women aged 25–34 years (Table 2). The reported use of products with the symbol was more likely in older age groups (aged 45–64 years) compared with younger respondents (Table 3).
Table 3 Odds ratio and 95 % confidence interval for using products with the Heart Symbol by age group and study period, and by relative education (educational tertile) in two study periods, in men (n 13 196) and women (n 16 182): Health Behaviour and Health among the Finnish Adult Population monitoring surveys in 2001–2009

*Logistic model: age group + educational group + study period.
†Logistic model: age group + educational group.
Both in men and women, the awareness of the symbol increased in all educational groups and varied by education at the beginning of the 2000s. Men and women in the highest educational group were best aware of the symbol. The differences between educational groups disappeared among men and diminished among women since the mid-2000s (Fig. 2, Table 2).

Fig. 2 Age-standardized proportion (%) of (a) male and (b) female respondents being aware of the Heart Symbol in 2001–2009 by relative education (educational tertiles: ![]() , lowest;
, lowest; ![]() , intermediate;
, intermediate; ![]() , highest): Health Behaviour and Health among the Finnish Adult Population monitoring surveys. Logistic model; P value for interaction educational group × study period: P = 0·03 for men, P = 0·02 for women
, highest): Health Behaviour and Health among the Finnish Adult Population monitoring surveys. Logistic model; P value for interaction educational group × study period: P = 0·03 for men, P = 0·02 for women
The reported use of products with the Heart Symbol was most common in the group with the highest education in the early 2000s (Fig. 3). Nevertheless, the most prominent increase in the use of products with the symbol took place among the least educated men in the mid-2000s. Consequently, the differences between male educational groups disappeared. In women, the reported use increased most in the intermediate educational tertile and the differences between educational groups narrowed such that no differences between women with the lowest and the highest education were observed in the later study period (Fig. 3, Table 3).

Fig. 3 Age-standardized proportion (%) of (a) male and (b) female respondents who have used products with the Heart Symbol in 2001–2009 by relative education (educational tertile: ![]() , lowest;
, lowest; ![]() , intermediate;
, intermediate; ![]() , highest): Health Behaviour and Health among the Finnish Adult Population monitoring surveys. Logistic model; P value for interaction education group × study period: P = 0·004 for men, P = 0·02 for women
, highest): Health Behaviour and Health among the Finnish Adult Population monitoring surveys. Logistic model; P value for interaction education group × study period: P = 0·004 for men, P = 0·02 for women
Discussion
Based on our findings, Finnish men and women are well aware of the Heart Symbol in all age and educational groups. Over the years, the awareness has increased in all subgroups, with the most prominent increase taking place among men with the lowest education. Yet, women are aware of the symbol better than men. Similar trends are seen in the reported use of products with the symbol.
In accordance with our findings, Dutch women perceived their front-of-pack nutrition logo (the Choices logo) more attractive than did men. Moreover, elderly consumers reported to be more in need of a logo than younger respondents(Reference Vyth, Steenhuis and Mallant12). A recent study conducted in Nordic countries regarding the Keyhole symbol showed that also Swedish women and older consumers were better aware of the symbol compared with men and younger consumers(13). In our study, young adults reported to use products with the Heart Symbol less frequently. Based on the most recent dietary population survey in Finland(14), young adults are those whose dietary habits are furthest from recommendations, and thus would benefit most from better awareness of healthier food choices. In a recent UK study, interest in healthy eating was strongly associated with use of nutrition information in the store. The interest was higher for women and for older people, and lower for people living with children under 16 years of age(Reference Grunert, Wills and Fernándes-Celemin15).
Not surprisingly, the UK research on consumers’ interest in healthy eating showed that the interest was higher for people with higher socio-economic status(Reference Grunert, Wills and Fernándes-Celemin15). Healthier lifestyle, including healthy food habits, among people with higher socio-economic status has been amply documented(Reference Wardle and Steptoe16). Also in Finland, healthy food choices are mostly more common among those with better education. Nevertheless, food choices have improved in all educational groups and signs of diminishing the social gradient have been shown(Reference Roos, Talala and Laaksonen17, Reference Roos, Ovaskainen and Raulio18). The present results support the finding of the highest educational group to be the first adopting healthier food choices while other groups follow their example some years later(Reference Prättälä, Berg and Puska19). Therefore, our finding of equal awareness and use of products with the Heart Symbol across the educational groups may relate to the diminishing socio-economic differences in food choices and nutritional status in Finland.
Health inequalities challenge public health stakeholders all over the world, including Finland. The governmental programme on tackling health inequalities encourages the search for concrete measures to diminish the social gradient in health and health-enhancing lifestyles(20). As stated by Bambra et al.(Reference Bambra, Joyce and Bellis2), food policies and interventions may provide some of the mechanisms for addressing diet-related health inequalities. To our knowledge, however, little is known about successful measures in decreasing socio-economic differences in food habits. On the contrary, many interventions based on nutrition education have been shown to reach especially those with higher education. Thus, activities to reduce inequalities in lifestyle-related health emphasise structural and policy measures, including diet-related measures that apply to product development, labelling and marketing. Therefore, we were pleased to find out that awareness and reported use of the Heart Symbol have increasingly reached especially those with lower education.
The number of products bearing the Heart Symbol has increased steadily, especially during the past 3 years. This increase has made more products with the symbol available for consumers, and thus has provided not only more variability in supermarkets but also more visibility for the products. Simultaneously with the industry introducing more products with the symbol and using the symbol more in marketing, the awareness of the symbol has increased. Concordantly with recent findings in the Netherlands(Reference Vyth, Steenhuis and Roodenburg21), the rapid increase in consumer awareness, in turn, has increased interest of the food industry to reformulate and develop new products including less sodium and saturated fat to comply with the criteria for the symbol. All the biggest companies on the Finnish market have the Heart Symbol on some of their products.
In order to help consumers with their choices it is important to have a single, generally accepted approach to rating foods. Various approaches based on different symbols, food categories or nutrition criteria confuse consumers, as was the case in the USA before the Smart Choices programme was built(Reference Lupton, Balentine and Black7). In Finland, however, there have been no competing approaches to the Heart Symbol, which explains our findings of good awareness and high use of products with the symbol across all age and educational groups. Although the Finnish approach is administered by non-governmental organisations (FHA and FDA), it is firmly acknowledged by the national authorities. As the Finnish nutrition recommendations were updated in 2005, the Heart Symbol was included in guidelines for consumers(10). Moreover, based on European regulations (EC No. 1924/2006) on nutrition and health claims made on foods, the Heart Symbol has been notified to be the only symbol on the Finnish market to be regarded as a nutritional claim.
Data for the present study are based on postal surveys including simple questions on whether or not (yes/no) a respondent is aware of the symbol and has used products labelled with the symbol. It is worth noticing that questions like these are prone to reporting bias as respondents tend to give answers that are socially desirable(Reference Adams, Matthews and Ebbelin22). Furthermore, dichotomous answer options do not distinguish between tentative and frequent use of the products with the symbol, and self-reports do not measure the actual label use in real-life settings. In addition, although the response rates have remained reasonably high over the years in our study, a decrease in response rates is of concern since it reduces the representativeness of the results and may limit comparability of the results between population groups as the non-respondents’ characteristics may change over the years(Reference Tolonen, Helakorpi and Talala23).
In accordance with other studies(Reference Wills, Schmidt and Pillo-Blocka24), our findings refer to consumer interest in receiving nutrition information on food packages. However, conclusions cannot be drawn on how widely the Heart Symbol is used in shopping situations or on its effects on consumers’ dietary pattern. Further research is consequently needed here, also concerning the experience and role of the system in the food industry.
Conclusions
The majority of Finnish adults are familiar with the Heart Symbol but yet women are aware of the symbol better than men. Both in men and women, the reported awareness of the symbol and use of such products have increased in all age and educational groups since 2001. Over the 9-year period, the most positive trends have taken place among those with lower education. The overall experience has been very positive with the food industry increasingly developing products that comply with the criteria, applying for the right to use the symbol and referring to the symbol in its marketing. Thus, it is likely that the Heart Symbol has made a positive contribution to efforts for healthier national dietary habits and may work as an effective measure to diminish nutrition-related social inequalities in health.
Acknowledgements
This research received no specific grant from any funding agency in the public, commercial or not-for-profit sectors. None of the authors had any conflict of interest. M.L.-K. and S.H. were involved in the study design and analytic plan. M.L-K. wrote the manuscript and S.H. conducted the statistical analyses. All authors, including M.O., E.V. and P.P., contributed to the interpretation of the results and preparation of the manuscript.


