


Food insecurity is defined as ‘limited or uncertain availability of nutritionally adequate and safe foods or limited ability to acquire acceptable foods in a socially acceptable way’(Reference Anderson1). Food insecurity is associated with poorer nutritional outcomes(Reference Dixon, Winkleby and Radimer2–Reference Parnell, Wilson and Mann5), and in New Zealand (NZ) and other developed countries it is more likely to be experienced by low socio-economic groups. In NZ there is emphasis on the need to consider methods of improving food security(Reference Carter, Lanumata and Kruse6, Reference Gorton, Bullen and Mhurchu7). Changes to the tax levels for some foods (e.g. removal of tax on fresh fruit and vegetables), providing discounts on ‘healthy’ food and providing supplementary assistance for purchasing of certain foods have all been proposed as methods for improving food security within NZ(Reference Bowers, Carter and Gorton8). However, there is little definitive research exploring the impact that improving economic resources may have on food purchasing decisions.
One study which did investigate this topic is the NZ Supermarket Healthy Options Project (SHOP). That study did not find a change in the primary outcome, percentage of energy from saturated fat from supermarket food purchases, when households were given a discount on ‘healthy’ food, although an increase was found in the amount of ‘healthy’ food purchased, including fruit and vegetables, in households receiving the discount(Reference Ni Mhurchu, Blackley and Jiang9). The SHOP study included participants across the socio-economic spectrum and was not targeted to a food-insecure group. Furthermore, it did not capture food spending from outlets other than one supermarket chain. A further two studies in the USA reported that providing low-income women with ‘targeted’ vouchers to spend only on fruit and vegetables resulted in an increase in fruit and vegetable consumption among the women receiving vouchers compared with those who did not(Reference Herman, Harrison and Afifi10, Reference Weerts and Amoran11).
Household dynamics influence what an individual eats. Food is often purchased at the household level and changes to the economic resources of a household will potentially impact on food purchasing decisions. Electronic sales data have been used in previous NZ research to track changes in expenditure at the household level(Reference Ni Mhurchu, Blackley and Jiang9). Food shopping receipts have also been used in Canada and the USA to give an overview of the food purchasing habits of different socio-economic groups(Reference French, Wall and Mitchell12–Reference Cullen, Baranowski and Watson14) and to estimate expenditure on foods consumed outside the home(Reference French, Wall and Mitchell12).
No NZ research has focused on the effect of the provision of additional money to households specifically for food. The Healthy Eating Guidelines for NZ adults include advice to select on a daily basis: five or more servings of fruit and vegetables, at least six servings of bread and cereals (including wholegrain breads), one serving of lean meat and poultry and at least two servings of low-fat milk and milk products(15). Fruit and vegetables are often used as an indicator of a healthy diet. They are also the food group most likely to be reduced in times of economic hardship(Reference French, Wall and Mitchell12, Reference Ricciuto, Tarasuk and Yatchew13, Reference Kirkpatrick and Tarasuk16, Reference Turrell, Hewitt and Patterson17). The objectives of the current study were to examine the effect of additional money (in the form of supermarket vouchers) on total food expenditure and expenditure on the other food groups identified in the Healthy Eating Guidelines for NZ adults(15).
Methods
Study design
The ‘Spend Study’ was a parallel randomized controlled trial with a 4-week baseline phase, during which households collected receipts for all their food purchases, followed by a 4-week intervention phase. The study was conducted in Dunedin, NZ, between June 2009 and May 2010. Households were randomized into two groups: a voucher group that received food vouchers (coupons) from a supermarket for 4 weeks and a control group that did not receive any food vouchers until the end of the study. The study protocol was approved by the Human Ethics Committee of the University of Otago, Dunedin, NZ (ref. 09/080) and all participants provided written and informed consent.
Household recruitment and screening interview
Participants were recruited using advertisements placed in local newspapers, flyers distributed at supermarkets and posters displayed at schools. Food-insecure households that had taken part in a previous study(Reference Smith, Parnell and Brown18) were also contacted by mail. Interested participants could contact researchers by a free telephone number or email. The main food preparer for the household was identified at the initial contact and interviewed over the telephone to determine household eligibility. Trial inclusion criteria were: (i) one child or more under 18 years living at home; (ii) household gross annual income <$NZ 45 000 ($US 28 395Footnote *); (iii) no expected change in household composition over the study period, e.g. long-term guest, new baby; (iv) no expected change in household income over the study period; (v) purchasing at least two-thirds of food from supermarkets; and (vi) food insecure as determined by the validated NZ Food Security Scale(Reference Parnell, Wilson and Mann5). This scale has eight food security statements and households were classified as food insecure and thus eligible if they responded positively to at least two of the statements (Table 1). Full details of these statements are available elsewhere(Reference Parnell, Scragg and Wilson19). Two trained research assistants and the primary investigator conducted the screening process and the demographic data collection.
Table 1 New Zealand food security indicator statements

Intervention
Vouchers were allocated for the supermarket identified by each household as the most frequently used. Vouchers were posted weekly and the food preparer was asked to spend the voucher within two weeks or one week for the final voucher. Previous research among low-income households in NZ found females within food-insecure households spent $NZ 5·00 ($US 3·15) less on food per week than females within food-secure households(Reference Smith20). This led to the voucher value of five dollars per adult female. The NZ Estimated Family Food Costs Survey(21) was used as the basis to derive the monetary amount of the vouchers allocated to each adult male or child in the household. This survey provides data on the basic food costs for people of differing age and sex so that their nutritional needs are met. Table 2 shows how the values for individual household members were derived. The total amount for each household was summed for the week. For example, the amount provided to a family with two adults (male and female), one boy (12 years) and one girl (7 years) was calculated as follows: $NZ 5·00 + $NZ 5·30 + $NZ 6·75 + $NZ 4·15 = $NZ 21·20. The weekly household ‘voucher’ amount was rounded to the nearest five cents. Two large supermarket chains were able to provide prepaid voucher cards with the weekly allocation loaded onto a card. One other supermarket chain only issued vouchers in five-dollar amounts. For households using this chain the allocated amount was rounded to the nearest five dollars ($NZ 20·00 in the example above). Food receipts were returned by mail, using stamped self-addressed envelopes, to the project office and checked to determine whether the vouchers were used during the intervention.
Table 2 Voucher dollar allocation per person per week in the Spend Study

Outcomes
The primary outcome assessed was the expenditure on fruit and vegetables during the intervention phase. Secondary outcomes were intervention phase expenditure on total food and the following specified food groups: ‘dairy products’, ‘milks’, ‘wholegrain/wholemeal breads’ and ‘meats and poultry’. Further exploratory analyses were conducted for the food groups ‘processed meat and poultry’, ‘soups, sauces and prepared meals’, ‘snacks’, ‘pasta, rice and noodles’, ‘potatoes and kumara’, ‘beverages’, ‘other bread’, ‘alcohol’ and ‘ready-to-eat food’. These additional food groups were selected as previous research in Dunedin, NZ indicated food-insecure households had expenditures on these items which differed from those of food-secure households(Reference Smith20).
Data collection
Age, sex, occupation, receipt of government benefits and self-reported ethnic group were collected for each household member. Using prioritized ethnicity each participant was assigned into the group: (i) Māori, (ii) Pacific, (iii) Asian, (iv) NZ European and (v) Other. For each household, information was collected for income (previous year) and home ownership. Households were categorized as of ‘low food security’ if they responded to five or more of the food security statements affirmatively and as ‘moderate food security’ if they responded to two or more of the food security questions affirmatively.
Outcomes were assessed by analysis of data from food shopping receipts and recording forms over the 8-week study period. Participants were mailed a ‘study pack’ with information sheets and consent forms for all household members aged 12 years and over and two postage paid envelopes. For any un-receipted food purchases forms were provided and the date of purchase, retail outlet and price were recorded. The main food preparer was sent ‘reminder’ text messages, emails or telephone calls (according to preference) fortnightly.
Receipt coding and data entry protocol
The 2006/2007 NZ Household Economic Survey Expenditure Classification System(22) was used to code food groups. The food group ‘fruit and vegetables’ included all frozen, canned and dried fruit and vegetables but excluded potato and kumara (sweet potato). ‘Meat and poultry’ included unprocessed meat and poultry. Bacon, sausages, rissoles, chicken nuggets and meat pies were included in the food group ‘processed meat and poultry’. The food group ‘snacks’ included cakes, biscuits, crackers, confectionery, chocolate, snack bars and crisps. ‘Ready-to-eat food’ included all food and beverages purchased from restaurants, cafes and takeaway outlets requiring no further preparation other than reheating.
Weekly receipts returned were summed per household. Stability in the weekly receipts per household was determined to check adherence to the study protocol.
Sample size
The sample size was calculated on the basis of a minimum difference of $NZ 2·00 (sd 4·70) between the control group and voucher group for intervention expenditure on fruit and vegetables. This was based on previous research comparing fruit and vegetable expenditure of food-secure and food-insecure households in Dunedin and Wellington, NZ(Reference Smith20). A sample of 166 (eighty-three per group) was calculated to provide 80 % power at a 5 % (two-sided) level of significance. We therefore planned to recruit 240 households to allow for a 30 % drop-out and non-return of food shopping receipts.
Randomization
Households were allocated to the voucher or control group in equal proportions using block randomization. The randomization sequence was generated using ralloc.ado, a STATA software module. Block sizes were even numbered and less than ten(Reference Ryan23). Households were randomized into either the voucher or the control group after their eligibility had been determined, informed consent had been given and their baseline phase had begun. The allocation sequence was concealed from research assistants enrolling households.
Blinding
As food purchasing could be influenced by fore-knowledge of upcoming vouchers, some ‘deception’ was used to minimize this. Households were not aware of the study design, but were informed the study would have three parts (a, b and c). Parts a and b would involve the collection of food shopping receipts only and during part c the household would receive ‘vouchers’ while continuing to collect food shopping receipts. They were told that: (i) they would receive notification of start time (random) and a study pack one week before the beginning of each part within the next six months; and (ii) the three parts would not necessarily run sequentially. In effect, households believed the study could run for a longer time period than it actually did and did not know when they would be receiving vouchers. This optimized baseline data collection from both groups and ensured that the control group normalized their food shopping during the intervention phase. On completion of the second phase all households were informed of the actual design of the study and the control group given vouchers, appropriate to their household composition and equivalent to that received by the voucher group. Research assistants and the primary investigator were not blinded to the group allocation after the baseline phase had begun.
Statistical analysis
The STATA statistical software package version 10 was used for all statistical tests and a two-sided P value less than 0·05 considered statistically significant. Unpaired t tests were used to compare the mean number of receipts returned by the control group with the voucher group. Differences in the number of receipts returned within each group for week 1 v. week 4 and week 6 v. week 9 were examined using paired t tests (two-sided).
The outcomes selected a priori were ‘fruit and vegetables’, ‘meat and poultry’, ‘dairy’, ‘milk’, ‘wholegrain/wholemeal breads’ and total food expenditure. Further exploratory analyses were conducted for the food groups ‘processed meat and poultry’, ‘soups, sauces and prepared meals’, ‘snacks’, ‘pasta, rice and noodles’, ‘potatoes and kumara’, ‘beverages’, ‘other bread’ and ‘ready-to-eat food’. Analyses were restricted to participants with complete food shopping receipt data. For each outcome, a linear regression model was used to compare the voucher and the control group for phase 2 expenditure, baseline expenditure was entered as a covariate. Total food expenditure was calculated by subtracting expenditure of non-food items from total expenditure. Analysis of residuals was conducted to check model assumptions. Normal probability plots were used to check the residuals had a roughly normal distribution and plots of the residuals against fitted values were used to check for non-constant variance. In cases where the model generated a large residual or a leverage point, the regression model was repeated with the removal of these values. Where residuals were not normal or clear evidence of heteroscedasticity was present, the Wilcoxon rank-sum test was used to compare change from baseline to follow-up expenditure.
Results
Recruitment and participant characteristics
Of the 236 households screened for eligibility, 214 were randomly assigned to either the voucher or the control group and 153 (71 %) households completed the study. Participant flow through the study and known reasons for withdrawal are shown in Fig. 1.
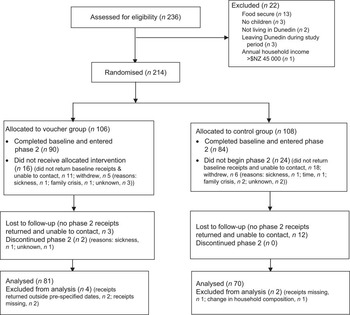
Fig. 1 Participant flow through the study and known reasons for withdrawal
Table 3 describes baseline characteristics for the households, which were similar between the voucher and the control group but a smaller proportion of control households received government benefits.
Table 3 Baseline characteristics of main food preparer and their household: parallel randomized controlled trial (Spend Study) among food-insecure households with children (n 151), Dunedin, New Zealand, June 2009–May 2010

*Data presented as mean and standard deviation.
†Household income before tax deductions.
‡Data presented as median and range (minimum–maximum).
Adherence to receipt collection protocol
The total number of receipts returned during the study did not differ between the control (mean 41, sd 25·7) and the voucher group (mean 41, sd 18·7, P = 0·987). During the baseline phase there was a decrease in the number of receipts returned from week 1 to week 4 for the voucher group only (Fig. 2, P = 0·011). During phase 2 there was a decrease in the number of receipts returned for both groups from week 6 to week 9 (Fig. 2, P < 0·001).

Fig. 2 Mean number of receipts returned by experimental group (– – ▪ – –, control group; —▴—, voucher group) and duration of each phase in a parallel randomized controlled trial (Spend Study) among food-insecure households with children (n 151), Dunedin, New Zealand, June 2009–May 2010. All paired t tests NS apart from: week 1 v. week 4 for voucher group (P = 0·011) and week 6 v. week 9 for both groups (P < 0·001)
Total expenditure and food expenditure
The mean voucher value given to households per week was $NZ 17·00. A significant effect of receiving vouchers was found for total expenditure and for food expenditure. The voucher group spent $NZ 18·55 (95 % CI 3·08, 34·02) more per week compared with the control group, controlling for baseline (P = 0·019, Table 4). Of this, $NZ 15·20 (95 % CI 1·46, 28·94) was spent on food and this was significantly higher than the amount spent on food by the control group (P = 0·030, Table 4).
Table 4 Estimates of the effect of vouchers v. no vouchers on weekly expenditure ($NZ) for selected food groups: parallel randomized controlled trial (Spend Study) among food-insecure households with children (n 151), Dunedin, New Zealand, June 2009–May 2010

NA, not applicable.
*Unadjusted weekly expenditure ($NZ) from supermarkets and other food retail outlets.
†Difference in household expenditure at follow-up between voucher and control group adjusted for baseline expenditure.
‡Change between phase 2 and baseline expenditure on wholegrain bread and alcohol compared between the voucher and control group using Wilcoxon rank-sum test.
§Bread excluding wholegrain products.
Food group outcomes
There were no statistically significant differences in weekly expenditure between the voucher and the control group for the food groups ‘fruit and vegetables’ (mean difference: $NZ 0·46; 95 % CI −1·97, 2·89; P = 0·709), ‘meat and poultry’ (mean difference: $NZ 0·29; 95 % CI −3·07, 3·64; P = 0·866) and ‘dairy’ (mean difference: $NZ 0·82; 95 % CI −0·75, 2·42; P = 0·302). No significant differences between the control group and the voucher group were found for additional food groups examined (Table 4).
Although the absolute amounts are small, there was a tendency for the voucher group to spend more money on ‘potatoes and kumara’ (mean difference: $NZ 0·43 per week; 95 % CI −0·04, 0·89; P = 0·071) and ‘beverages’ (mean difference: $ NZ 1·26 per week; 95 % CI −0·03, 2·56; P = 0·056) compared with the control group (Table 4).
Large residuals or leverage points were generated for the models of the food groups ‘meat and poultry’, ‘pasta, rice and noodles’, ‘potatoes and kumara’, ‘ready-to-eat food’, ‘soups, sauces and prepared meals’ and ‘snacks’. The results of the repeated analyses were similar to the main study findings so have not been reported.
Sensitivity analysis
Some households did not return as many shopping receipts during phase 2 as compared with baseline. In order to determine whether the differences observed between the control and voucher group were due to compliance to the study protocol, a sensitivity analysis was conducted excluding households that returned less than half the number of receipts during phase 2 compared with baseline. In total, twenty-two households were excluded (eleven in the voucher group, twelve in the control group) and all analyses repeated. For all food groups the main study findings were replicated.
Discussion
No known research to date has answered the fundamental question of whether increasing the money available to food-insecure households will change expenditure on food. As the underpinning reason for food insecurity is irrefutably financial, with associations found between food insecurity and household income, wealth and employment(Reference Gorton, Bullen and Mhurchu7), this is a most important area to investigate. In this randomized control trial, when provided with vouchers, food-insecure households increased their spending on food. Related research in this area has restricted the capacity of households’ choice by providing either targeted vouchers or discounts on only ‘healthier’ foods. The present study is thus unique in that households were given the freedom to spend the vouchers provided on either food or non-food items and it was conducted among low-income households experiencing food insecurity. Furthermore, the collection of food shopping receipts and the concurrent use of recording forms allowed for food purchases from all retail outlets to be gathered.
Households in the current trial, when provided with vouchers, chose to increase their ‘food spending’. This is interesting given that qualitative research in NZ reports that low-income households report reduced food spending at the expense of other financial demands(Reference Cheer, Kearns and Murphy24). The findings in our study, however, indicate there was little deferment to other expenses/bills. Possibly participating households could have had a greater than usual interest or awareness of food than the general population, as has been observed elsewhere(Reference Dowler and Calvert25).
We did not find any evidence for an increase in expenditure on the food groups investigated. The intervention period may not have been long enough for households to change purchasing habits or incorporate the money strategically into their ‘shop’. Qualitative research in low-income families has shown that avoiding waste is important in ensuring that food dollars stretch(Reference Dowler and Calvert25, Reference Wiig and Smith26), which is not conducive to experimentation or purchasing of unfamiliar foods. In addition, the monetary value of the voucher may not have been enough to impact food purchasing at the group level in a consistent way.
While the voucher group spent more on beverages and on potatoes and kumara during the intervention this was not statistically significant. In NZ potatoes and kumara are a preferred staple among low socio-economic groups(Reference Russell, Parnell and Wilson27) and also have a stable shelf-life. The voucher group may therefore have stocked up on this important food. For beverages, households receiving vouchers may have simply purchased more or changed the type of beverage, e.g. fruit juice instead of a ‘cheaper’ powdered fruit drink or spent more money on a different brand or type of coffee. Changes to the type of brand or quality of the foods have not yet been explored.
In theory, an extra $NZ 15 per week could make a nutritional difference to households. In practical terms it would allow an additional daily serving of fruit and vegetables, dairy or bread. McIntyre et al. demonstrated an increase of one serving daily of a nutrient-rich food that was already being eaten by food-insecure women as part of their regular diet could reduce the prevalence of nutritional inadequacy by at least half for most nutrients(Reference McIntyre, Tarasuk and Jinguang Li28).
Other studies have found increased purchasing of ‘healthier foods’ using ‘targeted’ vouchers. A 6-month intervention among women enrolling for WIC (US Special Supplemental Nutrition Program for Women, Infants and Children), using targeted vouchers for fruit and vegetables, resulted in an increase in fruit and vegetable consumption(Reference Herman, Harrison and Afifi10). The NZ SHOP study found that discounts on healthier food resulted in an increase in purchasing of these foods although it did not show a decrease in purchasing of ‘less healthy’ food(Reference Ni Mhurchu, Blackley and Jiang9). The complexity of food purchasing decisions was demonstrated by Inglis et al. in their hypothetical experiment in which women were presented with a scenario where they had 25 % more of their food budget to spend(Reference Inglis, Ball and Crawford29). Low-income women hypothetically chose to increase their spending on both healthy and unhealthy food to a greater extent than high-income women.
While a longer duration of the intervention period might have allowed for more changes in purchasing, the collection of receipts for longer than 8 weeks would increase respondent burden. Longer trials may need to consider less burdensome methods for examining food expenditure. Four weeks appeared to be the point where households began to lose interest and a decline in the number of receipts returned was seen. Weerts and Amoran also found a drop-off in the number of receipts returned over time in their study of 3 months duration(Reference Weerts and Amoran11). A sensitivity analysis, removing the households that were least compliant in returning receipts, replicated the observed differences in expenditure between the control and voucher group.
This research is not ethnically representative of NZ low-income households. The city of Dunedin is comprised mainly of NZ European ethnicity and the number of Māori, Pacific and Asian households recruited into the study was low (<5 %). Different ethnicities could react differently to the provision of vouchers and the Spend Study does not allow us to comment on this. Further research with other ethnic groups is needed.
Food security was measured at the start of the study; however any effect of the vouchers on food security status was not measured. Change in food security status would be useful to use as an outcome measure in future research. To date there has been no research into repeat measures in the same households using the NZ Food Security Scale. Furthermore, the scale captures what is experienced ‘over the previous year’ and has not been tested in reference to different time periods, such as ‘the previous month’. It is known that food insecurity for some households can be transient(Reference Tarasuk30) and a better understanding of this in the NZ context would be useful. At a national level, in the USA recent increases in SNAP (Supplemental Nutrition Assistance Program) entitlements resulted in an improvement in food security by 2·2 % and an increase in food expenditure by 5·4 % among low-income households between 2008 and 2009(Reference Nord and Prell31).
Lifestyle, education and behavioural approaches have been the traditional ways used to influence dietary habits. However, if financial barriers to achieving food security are not addressed, these approaches will have limited impact among low socio-economic groups. The removal of ‘tax’ on fruit and vegetables and other ‘healthy’ foods has been discussed at length in NZ. While it is encouraging that the issue of access to food is on the political agenda, such an action would not target those most at risk of food insecurity.
The results of the present study suggest that easing economic constraints by simply providing monetary vouchers to the household is a feasible method for reducing the impact of food insecurity on the food choices of food-insecure households. Further research into the optimal method for easing economic constraints and thereby reducing nutritional inequalities, should be undertaken. This could include research into differing monetary amounts and trials of a longer duration.
Acknowledgements
The work was funded by the Department of Human Nutrition, University of Otago. The authors declare they have no conflict of interest. Authors’ contributions were as follows: C.S., W.R.P., R.C.B. and A.R.G., study conception and design; C.S., acquisition of data, coding and statistical analysis; A.G., statistical advice; C.S., W.R.P., R.C.B. and A.R.G., interpretation of data; C.S., drafting of the manuscript; W.R.P., R.C.B. and A.R.G., reviewing the manuscript. This study is registered at www.actr.org.nz as ACTRN12611001170910. The authors would like to acknowledge the families that volunteered for the study.


