


Hospitalisation has a major impact on the physical functioning of patients. Bed rest and physical inactivity during hospitalisation accelerate the loss of muscle mass, strength and function, which is more pronounced in older adults than in younger adults( Reference English and Paddon-Jones 1 ). Moreover, older adults show a blunted response to dietary protein in protein synthesis after bed rest( Reference Tanner, Brunker and Agergaard 2 , Reference Deutz, Bauer and Barazzoni 3 ). To improve the recovery of muscle strength and function, older adults may therefore need more dietary protein than the current RDA of 0·8 g/kg body weight per d (g/kg per d)( Reference Deutz, Bauer and Barazzoni 3 – Reference Wolfe, Miller and Miller 5 ). Therefore, the PROT-AGE study group recently recommended a protein intake of 1·2–1·5 g/kg per d for older adults suffering from acute or chronic diseases( Reference Bauer, Biolo and Cederholm 4 ). However, protein intake of older adults during and after hospitalisation is generally well below this level( Reference Neelemaat, Lips and Bosmans 6 – Reference Bally, Blaser Yildirim and Bounoure 8 ).
To overcome older adults’ difficulties in consuming enough protein, enriching products they consume as part of their daily menu might be an effective strategy. Two recent studies, one in a hospital and the other in a rehabilitation centre, found promising results for protein-enriched bread and drinking yogurt( Reference Stelten, Dekker and Ronday 7 , Reference van Til, Naumann and Cox-Claessens 9 ). Protein intake of the older participants increased in both studies as a result of using protein-enriched products, but the intervention periods were limited to a maximum of 3 weeks and only two products were provided. Therefore, a consortium of food companies, nutrition researchers and health professionals developed a larger variety of protein-enriched familiar foods, tailored to the needs and preferences of older adults. These needs and preferences were determined based on interviews conducted with a group of older adults at risk for malnutrition. In the first phase of our current trial, we studied the effects of these products in hospitalised older adults and found that 79 % of the intervention group reached a protein intake of at least 1·2 g/kg per d compared with 48 % of the control group( Reference Beelen, Vasse and Janssen 10 ). However, we do not know if this is maintained for a longer term at home where recovery mainly takes place. Therefore, we continued the trial in a fraction of the patients at home after hospital discharge. In this home-phase study, our main outcome was not just an increased protein intake but the effect on physical performance as a measure of physical recovery after hospitalisation. By increasing the protein intake of older patients with protein-enriched familiar foods and drinks during the first 12 weeks after hospitalisation, we aimed to reach a protein intake of 1·2–1·5 g/kg per d and thereby improve physical performance in older patients in the first 6 months after hospital stay.
Methods
Study design
This study was designed as a randomised controlled trial with two parallel intervention arms. The study started in the hospital for the duration of the patient’s stay and continued at home for 12 weeks. After another 12 weeks without intervention, a follow-up measurement was taken. Results of the hospital phase of this study focusing on protein intake were reported in a separate paper( Reference Beelen, Vasse and Janssen 10 ). The study is registered on ClinicalTrials.gov (Identifier: NCT02213393). This study was conducted according to the guidelines laid down in the Declaration of Helsinki and all procedures involving human subjects were approved by the Medical Ethics Research Committee of Wageningen University. Written informed consent was obtained from all subjects.
Subjects
Recruitment took place between 1 October 2014 and 1 April 2015 in hospital Gelderse Vallei, Ede, the Netherlands. All patients aged 65 years and older admitted to the departments of geriatrics/internal medicine and pulmonary medicine were screened for study eligibility. First, patients were excluded from the hospital phase if their hospital stay was expected to be shorter than 4 d, or if they were terminally ill, had a food allergy or intolerance that restricted them from receiving the standard energy- and protein-rich menu or the protein-enriched intervention products, had an estimated glomerular filtration rate ≤30 ml/min per 1·73 m2, had communication difficulties because of aphasia or not understanding the Dutch language, were diagnosed with delirium or were at risk for developing refeeding syndrome according to the hospital screening tool. Eligible patients were asked to participate in the hospital phase of the study within the first 2 d of their hospital stay and they provided written informed consent to gather information from their medical records. Second, participants in the hospital phase were screened for eligibility for the home phase of the study. Exclusion criteria for the home phase were: patient goes to a nursing home, rehabilitation centre or hospice after hospital discharge; patient suffers from cognitive impairment (based on a medical specialist’s opinion) or is diagnosed with dementia or is legally incapacitated. Eligible patients were visited by a research assistant as soon as possible after inclusion in the hospital phase to provide oral and written information about the home phase of the study. Patients who were willing to continue with the study at home signed a second informed consent form.
Nutritional intervention
Subjects were randomly assigned to one of two treatment groups. Randomisation was carried out by an independent person using a statistical program, with permuted blocks of size 4, stratified by sex and hospital department of admission.
The intervention in the hospital phase started within 2 d after hospital admission and continued until the end of a patient’s hospital stay (more details on the hospital phase can be found elsewhere( Reference Beelen, Vasse and Janssen 10 )). The intervention was continued at home for 12 weeks, and subjects stayed in the assigned treatment group. Blinding was not possible as the product labels revealed whether products were protein enriched. During the hospital phase, subjects received the intervention through the usual food service. Subjects in both groups were free to choose and order from their own menus. Subjects received package deliveries at home twice a week during the first 12 weeks after hospital discharge. The packages were standardised during the first 2 weeks to familiarise the subjects with the entire assortment; from the 3rd week onwards subjects were free to order whatever they wanted and in any quantity using ordering forms. Subjects in the intervention group received the protein-enriched familiar products, whereas the control group received regular non-enriched variants of some of the intervention products. We decided to offer the control group some protein-rich products such as dairy products because we did not want to interfere with the standard advice to consume a protein-rich diet. To verify the protein content of the intervention products, chemical analyses were performed (Kjeldahl method). All measured protein levels were within a margin of 5 % of the protein content as provided by the manufacturers and shown in Table 1.
Table 1 Nutritional content of the intervention and control products (per portion)Footnote *

* According to chemical analyses (with Kjeldahl method): all measured protein levels were within 5 % of the protein content as provided by the manufacturers.
† All intervention breads were whole-wheat, the control breads were regular white bread (‘light’), regular wheat bread (‘brown’), and regular whole-wheat bread (‘dark’).
Study outcomes
We defined two primary outcomes: protein intake and physical performance during the 12-week intervention period. Protein intake was measured at baseline (week 0) and at 2, 6 and 12 weeks after hospital discharge, on random assessment days. As a baseline measure of intake, the mean of the intake on the 4th day in and the day before discharge from the hospital was used. Physical performance was measured at baseline (week 0) and at 2, 6 and 12 weeks after hospital discharge. Measurements from the day before discharge were used as a baseline of physical performance. For both protein intake and physical performance, a follow-up measurement was taken at 24 weeks after hospital discharge.
Before the measurements, all assessors received extensive training on the procedure for taking measurements. For all measurements standardised protocols were used including one for encouraging the subjects to push (leg strength) or squeeze (hand-grip strength) as hard as possible during the measurements. Moreover, dietary assessment was only carried out by trained dietitians.
Dietary assessment
During the home phase, protein intake was assessed using a 24-h recall combined with a dietary food record that was used as a memory aid. Participants were asked to record their food intake in household measures including all meals, snacks and beverages consumed during one prespecified day. During a home visit on the following day, the 24-h recall was carried out by trained dietitians in a face-to-face interview. During this interview, the food records were checked for completeness and additional information was obtained about unclear items or amounts. In the hospital, we used the ordering data of patients on day 4 of hospitalisation and the day before discharge. This method is a good proxy at the group level for protein intake in older patients admitted to these departments( Reference Beelen, Vasse and Janssen 10 ).
The verified food records were entered into the food-calculation program Compl-eat (Department of Human Nutrition, Wageningen University, http://www.compleat.nl). Ordering data from the hospital phase were also entered into Compl-eat, with portion sizes based on the Menu Management System database (in g). Compl-eat was used to calculate energy (kJ/d (kcal/d)) and macronutrient (g/d) intake according to the Dutch food composition table 2013( 11 ). Protein intake was further calculated for each subject in g/kg body weight per d (g/kg per d). This procedure was carried out for each measurement (weeks 0, 2, 6, 12 and 24). Average protein and energy intake was calculated for the whole 12-week intervention period as well. This was only done for subjects who completed at least two out of three measurements (weeks 2, 6 and 12).
The consumption of products was also reported in average portions per patient during the 12-week intervention period. Further, the contribution to protein intake (in %) of the intervention products in the intervention group was calculated for weeks 2, 6 and 12.
Physical-recovery outcomes
The primary outcome for physical recovery was measured with the Short Physical Performance Battery (SPPB). The SPPB consists of three components: balance, gait speed and chair-rise time( Reference Guralnik, Simonsick and Ferrucci 12 ). All three components of the SPPB were categorised into a five-level score, with 0 indicating the inability to perform a test and 4 indicating the highest level of performance. A total performance score between 0 and 12 was calculated by summing up the scores of the three tests.
Secondary outcomes for physical recovery were gait speed in seconds (measured within the SPPB), chair-rise time (in s) (measured within the SPPB), leg-extension strength, hand-grip strength, body weight, nutritional status (Mini Nutritional Assessment; MNA), independence in activities of daily living (ADL) and physical activity (LAPAQ questionnaire).
To determine leg-extension strength, a hand-held dynamometer (MicroFET2; HOGGAN Scientific, LLC) was used to measure isokinetic knee-extensor strength (in Newtons). Hand-held dynamometry has been shown to be a reliable method to measure leg strength in older adults( Reference Schaubert and Bohannon 13 ). Subjects were seated straight up with knees hanging at 90°, the hand-held dynamometer was placed in front of the lower leg just above the ankle with the assessor firmly seated against a wall or supporting object. Subjects were instructed to push against the dynamometer by trying to straighten their knee. They were instructed to push with maximum effort in 2 s and push as hard as possible until a stop signal was given (maximum of 10 s). A total of three consecutive measurements were recorded, alternating between both legs, making sure that each leg could rest for 1 min between measurements. The highest of the three measurements was used as maximum leg-extension strength.
Hand-grip strength was measured using a hand dynamometer (Lafayette Instrument Company). In all, three consecutive measurements were taken while alternating between both hands, making sure that each hand could rest for 1 min between measurements. Subjects were instructed to squeeze as hard as possible until a stop signal was given. Attempts were recorded to the nearest 0·5 kg and the maximum strength effort was reported for the dominant hand.
Body weight was measured twice with a calibrated digital scale to 0·01 kg (SECA scale). When the two measurements were more than 0·1 kg apart, a third measurement was taken. Mean body weight was calculated from all measurements. Only at baseline we could measure subjects who could not stand on the scale with a chair scale.
Nutritional status was measured with the MNA, which is a validated nutrition screening and assessment tool that can identify patients aged 65 years and older who are malnourished or at risk for malnutrition. The MNA includes a total of eighteen questions related to anthropometric measurements, mobility, dietary intake and overall health( Reference Vellas, Villars and Abellan 14 , 15 ). The higher the total score, the better the nutritional status.
The Barthel Index was used to assess the level of independence in ADL. This instrument contains ten items of which seven are related to basic ADL, and three items to mobility. The Dutch version of the questionnaire( Reference Post, van Asbeck and van Dijk 16 ) was used. A summary score between 0 and 20 was calculated, with a higher score indicating more independence.
Physical activity was assessed with the LAPAQ questionnaire( Reference Stel, Smit and Pluijm 17 ). This questionnaire assesses the frequency and duration of physical activity in the previous 2 weeks. Daily activities included walking, cycling, gardening and light and heavy household work, but sport activities were also included. For each performed physical activity, the frequency and duration was recorded to calculate physical activity in min/d.
All questionnaires (MNA, ADL and LAPAQ) were filled out by the assessor in a face-to-face interview with the subject.
Characteristics
The following baseline characteristics were collected from the patient’s medical record: age, sex, admission ward, medical diagnosis for admission, score on the Malnutrition Universal Screening Tool (MUST) at hospital admission, Hb level (mmol/l) and vitamin-D status (nmol/l). Hb and vitamin-D levels were recorded to obtain an overall impression of the health and nutritional status of the patient. Education level was asked from the patient. Height was measured with a stadiometer (SECA stadiometer) or when a participant could not stand up straight, the height recorded in the medical record was used. We checked whether the measured height differed from the height in the medical record for the subjects for whom we had both numbers (n 97). The medical record overestimated height by 2 cm on average, therefore final height was calculated by subtracting 2 cm from the medical record’s height for those subjects without an actual measurement. BMI was calculated by dividing the body weight by squared height. Length of hospital stay in days was obtained from the medical record after a patient was discharged.
Sample size
The sample-size calculation was based on the primary outcome for physical recovery: the SPPB. Following the literature( Reference Perera, Mody and Woodman 18 ), we wanted to be able to detect a meaningful change of at least 1 point. According to the sample size calculation, we needed thirty-five subjects per treatment group to detect this difference (using a power of 80 %, α of 0·05 and an estimated standard deviation of 1·5 points). With seventy subjects, the minimally detectable change in protein intake was 0·24 g/kg per d. With an expected dropout rate of 30 %, we aimed to include fifty subjects per group.
Statistical analysis
To prevent mistakes in data entry, double data entry was carried out: two assistants individually entered data into a data set, and when finished, the two data sets were compared in SPSS by a third person, after which unmatched values were checked and corrected. Statistical analysis was performed using the intention-to-treat principle, considering that our intervention was not strictly defined in terms of obliged consumption; subjects were free to order and consume whatever and how much they wanted. IBM SPSS Statistics version 22 was used and analyses were performed according to a predefined analysis plan. Statistical significance was set at P<0·05. Descriptive statistics were used to describe baseline characteristics and are presented as means and standard deviation. Independent t tests (or non-parametric tests for skewed data) for continuous variables and Pearson χ 2 test or Fisher’s exact test for categorical variables were used to test whether the two groups were still comparable at baseline, because randomisation took place at the start of the hospital phase and only half of the subjects in the hospital phase continued in the home phase. The differences in dietary intake between the two intervention groups were analysed using an independent t test. Differences in physical-recovery outcomes between groups over time were analysed with linear mixed models, with time, intervention group and their interaction as fixed factors and subjects defined as random factors in the model. For all outcomes, a random-intercept model was used with appropriate covariates and covariance structures. The appropriate covariates and covariance structures were chosen using a top–down model-fitting procedure. These differ between the different outcome variables. Linear mixed models estimated means and standard errors, therefore the data on these outcomes are presented as estimated means with their standard errors. Excluding subjects who withdrew from the study within 2 weeks did not affect the results, and therefore all recorded measurements were included in the linear mixed-model analysis.
Results
Subjects
Between October 2014 and April 2015, 860 patients were screened for eligibility and 159 patients of these consented to participate in the hospital phase of the study. From these 159 subjects, thirty-three subjects did not wish to participate in the home phase of the study. The others were screened for eligibility for the home phase of the study and fifty-one subjects were excluded because of the following reasons: transferred to other specialism or hospital (n 22), having cognitive impairments (n 13), not living independently (n 12), died during hospitalisation or treatment plan changed into palliative care (n 4). In total, seventy-five subjects consented to continue participation in the home phase of the study (thirty-nine in the control group and thirty-six in the intervention group). During the first 2 weeks at home, seven subjects of the control group and six subjects from the intervention group withdrew from the study. Between the measurements of weeks 2 and 12, another three in the control group and three in the intervention group withdrew from participation. During the follow-up phase, three subjects in each group dropped out. Fig. 1 shows the flow chart of subjects with reasons for withdrawal.

Fig. 1 Flow diagram of participant enrolment.
Although only half of the subjects from the hospital phase continued in the home phase, characteristics were comparable in both groups (P>0·05). At baseline, the study population had a mean age of 76·8 (sd 6·9) years and were mostly admitted to the pulmonary medicine ward of the hospital for lung disease-related reasons (Table 2). The mean length of stay was 8 d in the control group and 9 d in the intervention group. The majority of subjects had a low risk for malnutrition according to the MUST screening. Education level was low in most patients in both groups.
Table 2 Baseline characteristics (Mean values and standard deviations; numbers and percentages)

CRP, C-reactive protein; COPD, chronic obstructive pulmonary disease; MUST, Malnutrition Universal Screening Tool.
* Measured in fifteen control patients and eighteen intervention patients.
† Mann–Whitney U test used for skewed data.
‡ Education level was based on the highest level of education completed and divided into three categories: low (no education, primary or lower-secondary school), middle (higher-secondary school or intermediate vocational school) and high (higher professional education or university level).
Protein intake
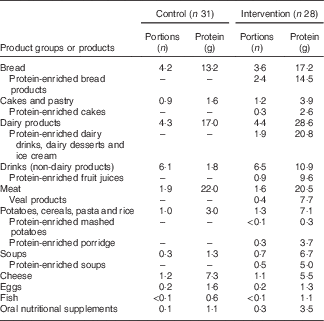
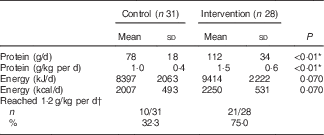
In the intervention group, intervention products contributed substantially to total protein intake during the 12-week intervention period: 61 % at the measurement of week 2, 56 % at week 6 and 49 % at week 12. Dominant protein sources for the intervention group were dairy products, whereas the control group received most protein from meat products (Table 3). A large difference between groups was found in protein provided by non-dairy drinks: the intervention group received 11 g protein from (mainly protein-enriched) drinks, whereas the control group received only 2 g protein from drinks. Use of the protein-enriched intervention products led to an increased mean protein intake in the intervention group compared with the control group: 112 (sd 34) g/d compared with 78 (sd 18) g/d (P<0·01), which corresponds to a mean protein intake of 1·5 (sd 0·6) g/kg per d v. 1·0 (sd 0·4) g/kg per d (P<0·01). Energy intake did not differ significantly between groups (P=0·070). The higher mean protein intake in the intervention group resulted in more subjects reaching the recommended protein intake of 1·2 g/kg per d: 72 % of the intervention group compared with 31 % in the control group (Table 4). The online Supplementary Table S1 provides the crude mean intakes and standard deviations per time point.
Table 3 Protein intake from food groups including intervention products: consumed number of portions and the amount of protein (g) (based on the mean consumption of the three measurements at home; weeks 2, 6 and 12)Footnote *
* These food groups all provided at least 2·5 % of total protein intake. Portion sizes are the same for both groups.
Table 4 Protein and energy intake during the home-phase intervention (weeks 2, 6 and 12; only calculated when a subject had completed at least two out of three measurements) (Mean values and standard deviations; number of subjects that reached a protein intake of 1·2 g/kg per d and percentages)
* Significant difference between groups (tested with independent t test).
† Based on the mean intake, and therefore includes only people who completed at least two out of three measurements.
Further, the intervention group reached a higher protein intake than the control group did during each meal occasion. Both lunch and dinner provided at least 25 g protein, whereas breakfast remained below this level in both groups. All three snack occasions were significantly higher in protein in the intervention group than in the control group (Fig. 2).

Fig. 2 Protein intake per meal occasion on average during the home phase. Values are means and standard deviations represented by vertical bars. ![]() , Control (n 31);
, Control (n 31); ![]() , intervention (n 29). * Significant difference between groups (P<0·05).
, intervention (n 29). * Significant difference between groups (P<0·05).
Physical recovery
Physical-recovery outcomes are shown in Table 5. Leg-extension strength is only reported for the right leg; results from the left and right legs were similar. None of the outcomes showed a significant intervention effect or interaction of intervention and time effect. In both groups, time effects were found for physical performance (SPPB), gait speed, chair-rise time, body weight, nutritional status (MNA) and physical activity (LAPAQ). Leg-extension strength, hand-grip strength and independence in ADL did not change over time. Data shown in Table 5 were derived from mixed models without the measurement of week 24, because our main interest was to measure the effect of the protein-enriched products during the 12-week intervention period. Including the follow-up measurements of week 24 did not change the estimated means and did not alter the significance of time, group or interaction effects (P>0·05). Further, the follow-up measurements at week 24 did not show significant differences between groups. The online Supplementary Table S2 provides crude means and standard deviations for each physical-recovery outcome per time point.
Table 5 Physical-recovery outcomes at baseline (0=day before discharge from hospital) and after 2, 6 and 12 weeks in the control and intervention groupFootnote ‡ (Mean values with their standard errors)

SPPB, Short Physical Performance Battery; MNA, Mini Nutritional Assessment; ADL, activities of daily living; CRP, C-reactive protein.
* Significant time effect (P<0·05) compared with baseline within a group.
† Significant time effect (P<0·05) compared with week 2 within the control group. No intervention effect or interaction of intervention and time effects were found (P>0·05).
‡ Intention-to-treat analyses were performed with a linear mixed model (no subjects were excluded from the analyses).
§ Leg-extension strength (right leg) included as covariable.
|| CRP at baseline and leg-extension strength (left leg) included as covariables.
¶ CRP at baseline and leg-extension strength (both legs) included as covariables.
** Leg-extension strength (left leg) included as covariable.
†† Sex included as covariable.
‡‡ Nutritional status (MNA total score) included as covariable.
§§ Body weight included as covariable.
|||| No extra covariable included.
¶¶ Sex included as covariable.
Post hoc analysis
Because not all subjects in the intervention group reached the desired protein intake of 1·2 g/kg per d and because some subjects in the control group did, we performed an additional stratified analysis for SPPB score by protein intake (mean protein intake below or above 1·2 g/kg per d during the 12-week intervention period). The same method was applied for linear mixed models: time, intervention group and their interaction were defined as fixed factors, subjects were defined as random factors and a random-intercept model was used. Fig. 3 shows the results of this analysis. The group with an intake above 1·2 g/kg per d had a higher score at each measurement. Further, SPPB improved significantly over time in both groups, but the group with a higher protein intake recovered faster in SPPB score (week 6 was already different from baseline) than the group with a lower intake did (week 12 was different from baseline). There were, however, no interaction effects of group×time found (P>0·05).

Fig. 3
Post hoc analysis (including right leg’s extension strength as covariate) on physical performance (Short Physical Performance Battery (SPPB)) in groups based on the mean protein intake during the 12-week home phase; subjects with a mean protein intake of below 1·2 g/kg per d (![]() , n 30) and subjects with a mean protein intake of above 1·2 g/kg per d (
, n 30) and subjects with a mean protein intake of above 1·2 g/kg per d (![]() , n 31). Values are means with their standard errors. There were significant effects of time (P<0·01) and group (P=0·003), but no group×time interaction effect (P>0·05). a,b,c,d,e,f,g Same letters on two time points indicate a significant difference between these two time points within a group (e.g. in the group with an intake above 1·2 g/kg per d, weeks 0 and 6 are significantly different).
, n 31). Values are means with their standard errors. There were significant effects of time (P<0·01) and group (P=0·003), but no group×time interaction effect (P>0·05). a,b,c,d,e,f,g Same letters on two time points indicate a significant difference between these two time points within a group (e.g. in the group with an intake above 1·2 g/kg per d, weeks 0 and 6 are significantly different).
Discussion
Protein-enriched foods and drinks were successfully implemented in the menu of older adults. Although these foods and drinks increased protein intake, they did not result in a greater improvement in physical performance.
We were able to achieve a high protein intake for as long as 12 weeks, which was much longer than in two previous studies of 3 d and 3 weeks( Reference Stelten, Dekker and Ronday 7 , Reference van Til, Naumann and Cox-Claessens 9 ). Such long-term adherence may be the result of the large assortment of protein-enriched familiar foods and drinks. Protein-enriched dairy drinks, bread and soups were major protein contributors, but also alternatives like fruit juices and porridge contributed a substantial amount of protein. By only using protein-enriched familiar foods and drinks we found a higher protein intake compared with a study that combined dietetic treatment and oral nutritional supplements for 12 weeks after discharge in undernourished older adults( Reference Neelemaat, Lips and Bosmans 6 ). We believe that the protein-enriched familiar foods and drinks can even be used for a longer term than 12 weeks, because the amount of these products ordered remained stable over time. If the products had been made available for a longer period, we still may have found a difference between groups after 6 months, which was not currently the case.
In contrast to some other studies that reported positive effects of protein supplementation on physical performance( Reference Tieland, van de Rest and Dirks 19 , Reference Kim and Lee 20 ), we found no effect on the physical performance outcomes. This may be due to two reasons: the high protein intake in the control group and the lack of physical activity in our study population. These two explanations could also be associated with the fact that a large part of our subjects were chronic obstructive pulmonary disease (COPD) patients. COPD patients are recommended to increase their energy and protein intake because they would benefit from a high intake as they suffer from chronic inflammation( Reference Deutz, Bauer and Barazzoni 3 ). However, even the high protein intake of 1·5 g/kg per d of our intervention group may have been too low for these patients to improve physical performance. Further, the condition of a COPD patient (shortness of breath, exhaustion) usually prevents an active lifestyle( Reference de Blok, de Greef and ten Hacken 21 , Reference Pitta, Troosters and Spruit 22 ), which was also seen in our study.
The rather high protein intake of the control group is probably a joint result of the following two factors: first, the participating hospital offers protein- and energy-rich menus to older patients in the participating departments, and all discharged patients receive information about the importance of protein during the recovery phase after hospitalisation; second, the control group received dairy products in their packages during the home phase. This was done because we thought it would be unethical to give them products low in protein despite being advised to choose a protein-rich menu. Providing these packages indeed had an impact on their protein intake: at the follow-up measurement of week 24, the protein intake of both groups was much lower compared with the first 12 weeks (see online Supplementary Data). This suggests that the participants were unable to maintain a high protein intake by themselves and that the free delivery service of the packages was also of great importance during the intervention period.
Although post hoc testing has its limitations – a no longer randomised sample, and therefore a higher risk for biased results – we performed an explorative post hoc analysis which showed that the physical performance of subjects with an average intake of at least 1·2 g/kg per d (after 6 weeks, a significantly higher score compared with baseline) increased faster than that of the subjects who had an intake lower than 1·2 g/kg per d (after 12 weeks, a significantly higher score compared with baseline). Further, the subjects who reached the intake of 1·2 g/kg per d had a higher SPPB score at each time point. However, the interaction effect was not statistically significant, meaning that a higher protein intake did not change physical performance to a greater extent over time. We speculated that this may be due to the inactive study population. To further investigate the effects of the activity level of the study population, we carried out another additional post hoc analysis including only subjects who performed sports activities (data not shown). This had no effect on the results: differences in the SPPB score remained the same between the groups. The performed sports may have been too low in intensity or may not have focused on resistance-type exercise. Especially resistance-type exercise is effective in increasing physical performance and strength in older adults( Reference Tieland, Dirks and van der Zwaluw 23 ). If we could have combined the nutritional intervention of our study with a resistance-type exercise programme, we might have found more positive results on the physical-performance outcomes in our study. However, this was not possible in our recent study because of practical and financial constraints. These factors also hindered continuing the recruitment to reach the desired sample size; we wanted to recruit fifty patients in each group to end up with thirty-five per group. However, within the recruitment period we had only seventy-five patients who continued the study at home after hospital discharge. But even when we would have included enough patients, it seems unlikely that we would have been able to detect a statistically significant difference; the standard deviation we found was larger than what we used in the sample-size calculation.
It could be argued that an intervention period of 12 weeks is not long enough. Tieland et al. ( Reference Tieland, van de Rest and Dirks 19 ) found a result after 24 weeks of protein supplementation, whereas Kim & Lee( Reference Kim and Lee 20 ) found a positive result after 12 weeks of protein supplementation. In our results, we saw improvements in physical performance outcomes especially within the first 6 weeks of the intervention, but after that values plateaued (both in the original analyses as well as in the post hoc analyses). Therefore, we do not think a longer intervention period would have yielded different results.
We chose to stay close to reality, with a free-choice intervention instead of giving strict guidelines on what and when to eat. Although our participants had a free choice in what to consume and how much, the variety of products helped them to maintain a higher protein intake in the longer term. Some participants in the intervention group did not reach an average protein intake of 1·2 g/kg per d for 12 weeks; thus, for some people other strategies could be more beneficial.
Because of financial and practical constraints, it was not possible to blind our participants or the study assessors for the intervention allocation, which in theory could have influenced our results and therefore is a study limitation. However, to minimise these influences, all assessors were trained extensively and we used standardised protocols for all measurements.
In conclusion, protein-enriched products enabled older adults to increase their protein intake to levels that are higher than their required intake. In these older adults with already adequate protein intakes and limited physical activity, protein enrichment did not enhance physical recovery in the first 6 months after hospital discharge.
Acknowledgements
The authors thank the participants, staff of hospital Gelderse Vallei, and all research assistants for their assistance during data collection and data cleaning.
This research was part of the Cater with Care® project and supported by a grant from the GO EFRO 2007–2013 programme (grant no. 2011-016066-251111). Products and services were developed in the Cater with Care® consortium that existed with the following partners: Carezzo Nutrition BV, The Kraft Heinz Company, Veal Promotion Foundation, NIZO food research BV, Sodexo, Hospital Gelderse Vallei and Wageningen UR. The sponsors had no further role in the study design, data collection, analysis and interpretation of the data, writing the article or in the decision to submit the article for publication.
The author responsibilities were as follows: all authors provided input for designing the study, J. B. performed data collection and analyses; all authors provided assistance in writing the manuscript.
None of the authors has any conflicts of interest to declare.
Supplementary material
For supplementary material/s referred to in this article, please visit https://doi.org/10.1017/S0007114517001477


