


Introduction
The Intergovernmental Panel on Climate Change (Reference SolomonSolomon and others, 2007) concluded that the Arctic is particularly susceptible to the effects of global warming. This has been conclusively demonstrated by rapid changes in the extent and nature of the Arctic Ocean ice cover (Reference Nghiem, Rigor, Perovich, Clemente-Colón, Weatherly and NeumannNghiem and others, 2007; Reference Perovich, Kwok, Meier, Nghiem and Richter-MengePerovich and others, 2010; Reference WitzeWitze, 2010) and the extent and volume of ice caps in the Canadian Arctic Archipelago, which are estimated to have lost 635.8 km3 between 1959 and 1999 (Reference Sharp, Copland, Filbert, Burgess and WilliamsonSharp and others, 2003).
Glaciers are particularly useful indicators of changes in climate, hence the renewed emphasis on the compilation of glacier inventories around the world to aid in our understanding of how climate is changing (Reference Haeberli, Cihlar and BarryHaeberli and others, 2000; Reference CogleyCogley, 2009; Reference OhmuraOhmura, 2009) and the likely impact on sea level.
Although a world glacier inventory had been proposed for the first International Geophysical Year (1958), there had been little international coordination until a similar project was proposed for the International Hydrological Decade (IHD; 1965–74). Raymond Nace, considered by many to be the father of the IHD, in calling for global inventories, explained the situation as follows:
‘considerable difference of opinion prevails about whether the ice masses are growing, shrinking or merely being maintained. It is important that this be determined because the ice areas are great weather factories and their melting would cause a rise of sea level.’ (Reference NaceNace, 1969, p.32)
The International Commission on Snow and Ice rose to the challenge of the IHD, and appointed committees to develop guidelines for assessing the attributes of various elements of the cryosphere. Those related to a global inventory of perennial snow and ice masses were developed under the direction of Fritz Müller at McGill University, Montréal, Canada, and published by UNESCO/International Association of Scientific Hydrology (IASH) (1970). The first to be completed for a substantial area using the new guidelines was that for Axel Heiberg Island (AHI) (Reference OmmanneyOmmanney, 1969). This comprehensive inventory presents an opportunity for assessing glacier changes over a 42 year period for part of the Canadian High Arctic by comparing it with a subsequent inventory compiled as part of a Global Land Ice Measurements from Space (GLIMS) project (Reference BishopBishop and others, 2004).
Axel Heiberg Island
Reference OmmanneyOmmanney (2009) has recently described the background to the AHI inventory and the Canadian inventory program. There were a number of reasons for the selection of this area for a test of the guidelines in Canada:
‘Although it might have seemed more appropriate to carry out a pilot study of this nature in an area of greater human and economic importance it was necessary that the recommendations be tested in one of the least favourable areas so that the success there would prove the general applicability and suitability of the proposals and ensure that the study could be carried out for all glacierized areas in the country.’ (Reference OmmanneyOmmanney, 1969, p.25)
In addition to the remoteness of the island, AHI provided a landscape with varying degrees of ice coverage and a wide range of glacier types, with 55% of the area being attributed to outlet glaciers, 26% to valley, mountain and other independently sourced glaciers, 16% to ice caps and 3% to ice fields (Reference OmmanneyOmmanney, 1969). As in many other glacierized regions on Earth, the mapping of ice extents required remote-sensing methods using aerial photographs. Given that air photos were available from the late 1940s, the early 1950s and 1958–59, and that 1:250 000 Canadian National Topographic Series (NTS) maps were being prepared, the materials required for the proposed inventory were available. AHI was also chosen so that the fundamental information on the ice cover of the island would complement the work of the glaciologists and physical scientists who started working there in 1959, under the auspices of the Jacobsen–McGill University Arctic Research Expedition, led by Fritz Müller, and who have continued working there to the present using the McGill Arctic Research Station. While the basic inventory focused on one date, 1959, the resulting catalogue provides a structure for comparing earlier and subsequent glacier records and observations, creating a legacy for future generations (Reference Ommanney and AdamsOmmanney, 1987a, Reference Ommanney and Adamsb; Reference Ecclestone, Cogley, Adams, Taylor, Hardy and PomeroyEcclestone and others, 2000; Reference Cogley, Adams and EcclestoneCogley and others, 2011), and for all the researchers who continue to study the glaciers of the island.
Data Sources
Baseline inventory: 1958–59
To enable regional assessment in the original inventory (Reference OmmanneyOmmanney, 1969), AHI was divided into five principal hydrological basins, designated 46441–46445, which were then subdivided into lesser-order basins identified by letters (Fig. 1a). Glacier outlines were compiled at a scale of 1 :125 000 on advanced prints of the eleven 1 :250 000 NTS maps developed from 1958 and 1959 Canadian Government aerial photography. In this process, ice masses measuring 0.1–2.6 km2 were added to the inventory. Glacier areas were calculated using a Bruning Areagraph random dot overlay and a mechanical dot counter, noted as having a >97% precision (Reference OmmanneyOmmanney, 1969). The original and uncorrected NTS extents are available from Geomatics Canada and were used by Reference Sharp, Copland, Filbert, Burgess and WilliamsonSharp and others (2003) in their assessment of area and volume change of ice caps in the Canadian Arctic. As most survey lines were flown in 1959, we refer to the baseline inventory by this date for brevity. In developing the baseline inventory for AHI, Ommanney used air photos taken by the Royal Canadian Air Force in 1958 from an altitude of 30 000 ft (9144 m), and stereophotogrammetric methods to check and improve the glacier boundaries of the NTS. Features down to 0.01 km2 were included following checks against earlier trimetrogon photography, taken in 1950 and 1952, and against the more limited vertical air-photo coverage from the US Army–Air Force task force ‘Operation Polaris’ in 1947; a process which revealed the perennial nature of these small ice patches.

Fig. 1. Regional classification (a) and spatial depiction of glacier advance and retreat (b) on AHI. (a) Geographic divisions: regional boundaries (46441–46445) are indicated by bold lines, and smaller hydrological basins (alphabetic) by narrow black lines. Ice extent (grey) was assessed according to these divisions. Expedition Fiord is region 46444, basin e. (b) Ice coverage in 2000 gained (white) or lost (grey) as a percentage of 1958–59 extent, according to basin.
The 1120 glaciers (including 12 rock glaciers) in the baseline inventory were identified sequentially according to region, basin and number, then assigned a single set of geographic and Universal Transverse Mercator (UTM) coordinates and attributes such as aspect, elevation, area and volume. Following the UNESCO/IASH (1970) manual for the World Glacier Inventory, a six-digit code that identified the qualitative characteristics of each glacier was also assigned (Table 1). The ice masses and rock glaciers identified covered a combined total area of 11 734.9 km2 (Reference OmmanneyOmmanney, 1969). The difference between this value and the 11 978 km2 reported by Reference Sharp, Copland, Filbert, Burgess and WilliamsonSharp and others (2003) from NTS extents can be attributed to the corrections of these extents made by Reference OmmanneyOmmanney (1969).
Table 1. Six-digit classification table used on each of the 1120 glaciers identified in the 1958–59 inventory (Reference OmmanneyOmmanney, 1969)

GLIMS inventory: 2000
The second inventory of glaciers in this study utilizes the Global Land Ice Measurements from Space (GLIMS) database, the extents of which were originally delineated using Landsat 7 scenes from 1999 and 2000 over AHI. The precision required of GLIMS data is 0.001 km2 with a minimum glacier size of 0.01 km2 from clear Landsat 7 scenes (15 m spatial resolution) (Reference PaulPaul and others, 2010). The GLIMS dataset delineates not only terminus extents and margins, but also individual glacier catchments in the upper reaches of ice fields where accumulation areas are adjacent (outlined according to the ice-flow regime). This information, though extremely beneficial for individual glacier assessment, unfortunately cannot be used in this study because glacier outlines are not available from the baseline inventory. Instead, all glaciers from the GLIMS inventory were first combined as a single feature and subsequently divided according to the regions and basins of the baseline inventory. Thus, the two datasets can be compared without discrepancies associated with differing accumulation-area boundaries. The smallest ice mass identified in the GLIMS inventory of AHI glaciers measures 0.04 km2.
Inventory comparison methods
Some pre-processing was required as, in their original format, the two inventories were not directly comparable. First, the boundaries of the regions and basins were manually delineated from scanned versions of the baseline inventory maps (Reference OmmanneyOmmanney, 1969) using the Environmental Systems Research Institute’s (ESRI) ArcGIS software and projected to fit zone 14-north of the UTM projection using the North American Datum 1983 (NAD83). On these maps, points identifying each glacier were plotted, the glacier characteristics from the Reference OmmanneyOmmanney (1969) report were entered as point-associated attributes to include the orientation (accumulation and ablation areas), mean elevations (accumulation and ablation areas), accumulation–area ratio (AAR), depth and volume, and the six-digit classification was recorded (Table 1).
To verify that the inventory data entered remained true through the data entry process, the attributes of the five largest and five smallest glaciers (in area) were checked in each basin, as well as three glaciers selected randomly from within the basin. Following these attribute checks, which suggested a 0.3% error in data entry (13/4654), a final comparison found the area sum of each basin in the digital inventory to match the area sums reported in the baseline inventory. The greatest discrepancies between the two inventories can be attributed to the removal of 12 rock glaciers from the dataset, as they are not considered to contribute to ice coverage in the GLIMS inventory.
Finally, to minimize inconsistencies between the two inventories, and to ease the task of cataloguing and temporally comparing hundreds of glaciers, ice coverage for both inventories was assessed according to the five geographic regions and lesser-order basins of the baseline inventory, rather than on a glacier-by-glacier basis.
Results
Our comparison of the extent of ice coverage between 1959 and 2000 is summarized in Figure 1b. Changes in ice coverage are noted as a percentage of the 1959 area, such that a value of −4 (e.g. area 46444a) indicates that 96% of 1959 ice extent remains.
The island-wide ice coverage in the year 2000 inventory (11 709.3 km2) is only 15.92 km2 less than the 1959 extent of 1172 5.22 km2 (without rock glacier contributions). This loss of <1 % during the 42 year period was unexpected considering consistent reports of ice loss from other glacierized areas in the Arctic (Reference Sharp, Copland, Filbert, Burgess and WilliamsonSharp and others, 2003; Reference SolomonSolomon and others, 2007; Reference Andreassen, Paul, Kääb and HausbergAndreassen and others, 2008). Further analysis reveals, however, that there are two distinct trends in the response of glaciers on AHI and that simply measuring and comparing the areas observed from the two inventories does not provide a complete picture. In the following discussion of results, we highlight the occurrence and distribution of the dominant trend, glacier recession, and discuss a mechanism for the sparse, yet marked, occurrence of glacier growth in regions dominated by outlet glaciers of Müller Ice Cap (MIC).
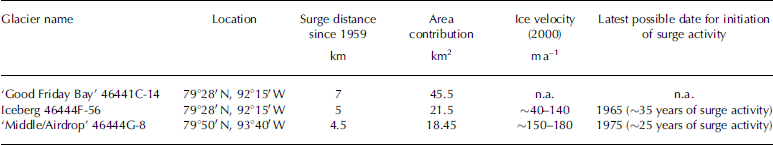
Table 2. The occurrence and nature of surge-type glaciers on AHI. Area change has been calculated using measurements of terminus width (Reference OmmanneyOmmanney, 1969), and surge distances calculated by Reference Copland, Sharp and DowdeswellCopland and others (2003). Surge-flow rates follow from RADARSAT-1 speckle-tracking methods applied by Reference Short and GrayShort and Gray (2005) used to estimate the latest date of surge initiation, assuming the maximum velocity measurement from 2000–04 by Short and Gray is representative of the maximum velocity experienced during the entire surge event. n.a.: not available
Discussion
First, let us compare Reference OmmanneyOmmanney’s (1969) assessments of glacier terminus behaviour, these being retreat, advance or surge characteristics (according to the classification table of the baseline inventory), with the distribution, sign and magnitude of area changes measured between 1959 and 2000. Figure 2a illustrates the frequency of these glacier characteristics for each region and basin and shows that retreating glaciers overwhelmingly dominate glacier populations in all regions and basins. Of the 1108 glaciers listed in the baseline inventory, 90.5% showed retreating characteristics, while 2.9% were stationary and 5.7% were advancing. The remaining glaciers were either unclassified or listed as potential surge-type glaciers, which we discuss later. Though retreating glaciers were the most common glacier type observed in 1959, the contribution of these ice masses to overall area loss was masked by that of the less common, though significantly larger, advancing glaciers (Fig. 2b and c, respectively).

Fig. 2. Plots illustrating the (a) frequency distribrution, (b) area contribution and (c) average areas of glaciers exhibiting advancing, stationary and retreating characteristics as identified in the baseline inventory (Reference OmmanneyOmmanney, 1969). The results of area comparison between 1959 and 2000 are indicated above each bar.
Glacier advance
The eight basins exhibiting an increase in ice coverage are all located in region 46444. Of these, five are dominated by glaciers with accumulation areas fed by MIC: Strand Fiord (d), Expedition Fiord (e), Iceberg Bay (f), Middle Fiord (g) and Skaare Fiord (m). The greatest growth was observed in the Iceberg Bay basin, where the ice cover increased by 77.81 km2. Growth was observed to a lesser extent along the eastern rim of MIC in Li Fiord (h), Bunde Fiord (j) and the eastern Schei Peninsula (l). When considering island-wide change, these increases are significant enough to counterbalance losses observed more generally across the island, resulting in the small island-wide change in ice coverage.
Reference OmmanneyOmmanney’s (1969) observations of advancing termini (Fig. 2) primarily related to those basins centred on the two largest ice bodies, MIC (region 46444) and Steacie Ice Cap (SIC; 46441), where glaciers he identified as advancing and stationary comprised most of the ice cover and were clearly larger on average (Fig. 2c). However, despite the contributions of advance-categorized glaciers to SIC, this region exhibited shrinkage on the order of ∼180 km2 from 1959 to 2000, the nature of which is discussed immediately below. Considering the regional and basin-specific results from this study (noted above each column in Fig. 2), recent observations of growth from some of the MIC basins suggest that the advance of some of the glacier termini continues.
Surging and ice dynamics
In a survey across the Canadian Arctic of 51 glaciers exhibiting surge characteristics, three glaciers of western AHI (‘Good Friday Bay Glacier’, Iceberg Glacier and ‘Middle or Airdrop Glacier’) show the most dramatic surge activity (Reference Copland, Sharp and DowdeswellCopland and others, 2003). Two of the three surge-type glaciers identified on AHI in the Reference Copland, Sharp and DowdeswellCopland and others (2003) study, Iceberg Glacier and ‘Middle or Airdrop Glacier’, are in basins where ice coverage has increased since 1959. Though these three surge-type glaciers alone added 85.45 km2 of ice to the 2000 inventory, these advances should not be misinterpreted as positive mass balance. Thus, if we subtract the contribution of these three surging glaciers the island-wide shrinkage quadruples from ∼15 to ∼60 km2. In the case of the Iceberg Bay and Middle Fiord glaciers, surges were responsible for one-third of the area gain in ice cover for their basins (46444F and 46444G). Adjusting to account for surging-glacier contributions, the 46444F basin advance changes from 6.9% of the 1959 coverage to 5%, and that for basin 46444G from 8.1% to 5.6%. For ‘Good Friday Bay Glacier’, which is an outlet of SIC, the corrected results for this retreating basin increase from 3.8% ice loss to 6%.
While not all advance observed in basins of MIC can be explained by confirmed surge activity, numerous recent studies suggest that our understanding of climate-driven changes linked to ice coverage is incomplete and that ice dynamics are both skewing and underestimating regional observations of ice loss (Reference Kaser, Cogley, Dyurgerov, Meier and OhmuraKaser and others, 2006; Reference Rignot and KanagaratnamRignot and Kanagaratnam, 2006; Reference BellBell, 2008). For Thompson Glacier of Expedition Fiord (46444e), Reference Cogley, Adams and EcclestoneCogley and others (2011) suggest that, in light of the findings of Reference Copland, Sharp and DowdeswellCopland and others (2003) and the distorted medial moraine characteristics, the glacier’s advance prior to 2000 may have been exhibiting ‘slow-surge’ characteristics. We speculate that growth in other glacier basins on western AHI might similarly be attributed to the dynamic processes of increased ice velocity leading to a redistribution of ice from the higher elevations of MIC to the major outlet-glacier tongues at the margins. This conjecture, however, will require future remote-sensing and in situ studies of AHI glaciers to assess any reductions in ice thickness of MIC, specifically in the accumulation areas of the large outlet glaciers. Contemporaneous with dynamic processes, it is possible that glacier growth from MIC can be attributed to the longer response time of large outlet glaciers to the positive mass-balance conditions during the Little Ice Age (Reference Cogley, Adams and EcclestoneCogley and others, 2011). It is likely that this process can explain why the smaller and thinner White Glacier has been exhibiting retreat alongside the previously advancing Thompson Glacier. The fact that the advance of Thompson has now stopped suggests that non-surging outlets from MIC will henceforth exhibit retreat as has been observed for most of the island’s other glaciers.
Ice loss
As illustrated in Figure 1b, regions dominated by outlet glaciers from the two major ice bodies on the island, SIC and MIC, have shown expansion or lesser shrinkage. Although Figure 2b shows that growing and stationary glaciers represented most of the ice cover in the SIC (46441) region during the 1950s, the measured 186.88 km2 of ice loss in 2000 suggests that either the advance of glacier termini has stopped since the 1950s, or the rate of advance has decreased and previously stationary glaciers have begun to retreat. Although the nature of our datasets precludes glacier-by-glacier analysis, we have been able to assess the relative changes in larger outlet and valley glaciers in basins hosting both.
By delineating divisions between ice-cap-derived and independent glaciers, we can assess the state of individual ice masses separately from the coalescent ice fields. We used this method to determine whether the outlet glaciers of the SIC region (46441), considered together, have been advancing, en masse. Figure 3 shows the division between SIC-derived glaciers and independent glaciers, and documents ice losses between 1959 and 2000. It is clear that all glaciers in the region have experienced ice loss, but that the losses experienced by independent glaciers are ∼30% greater than those of the SIC-derived glaciers.

Fig. 3. Analysis of SIC-derived glaciers, bounded inside the white dashed line, and independent glaciers (Ind.) which are outside this division. Basins are divided by black lines and indicated with white letters, while glaciers identified in 1959 (Reference OmmanneyOmmanney, 1969) are indicated by dots.
Across AHI, regions dominated by small glaciers identified as retreating in the 1950s have since shown a dramatic degree of ice loss. Small ice caps, cirque glaciers, mountain glaciers, ice aprons and glacierets persist as the primary glacier types along the western and northern peninsulas of AHI (regions 46442 and 46443). These are the regions where Reference OmmanneyOmmanney (1969) reported the highest number of retreat-type glaciers and where the smallest glaciers on the island are concentrated (Fig. 2). In these two regions, 992.89 km2 of ice has been lost since 1959, activity consistent with the abundance of retreat classifications assigned in the baseline inventory. Two-thirds of all glaciers in these regions are independent, i.e. they are not outlet glaciers of the few small ice caps. The higher ice losses measured in these regions can be attributed mainly to the small glacier sizes, most being <0.5 km2. Region 46445, which exhibited the greatest percentage ice loss of all the regions on the island, was the one with the least ice cover in 1959 (8.82 km2). By 2000, glacier coverage had dropped to 3.21 km2, and four of the seven glaciers identified in 1959 had disappeared. The 64% loss observed here may be representative of the response that can be expected generally from remnant and isolated glaciers.
Across the island, observations of significant retreat consistently coincide with higher numbers of these small, remnant glaciers, and glaciers at lower elevations (Fig. 4). The Pearson correlation coefficients between area fluctuations (1959–2000), glacier area (1959) and the average accumulation-area elevation (1959) are r = 0.477 (P(r = 0) = 0.0103) and r = 0.425 (P(r = 0) = 0.0241), respectively. Unfortunately, we are unable to derive equilibrium-line elevations using the example set by Reference Braithwaite and RaperBraithwaite and Raper (2009), as the baseline inventory reports the average accumulation-area elevation and the average ablation-area elevation, rather than the maximum and minimum glacier elevations required. However, Figure 5 maintains that small glaciers and those below elevations of ∼1100 m are particularly susceptible to rises in the freezing level associated with a warming climate, which agrees with the findings of Reference Braun, Hardy and BradleyBraun and others (2004) and Reference Dyurgerov, Meier, Bamber and PayneDyurgerov and Meier (2004). If current climatic trends on AHI persist or intensify, substantial additional retreat can be expected here.

Fig. 4. Scatter plot demonstrating the relationship between average glacier area, elevation and ice coverage with respect to the classification used to describe each. Elevations generally refer to the average accumulation-area elevation except for glaciers with AARs of zero for which the average ablation-area elevation was used.

Fig. 5. A sampling of glaciers observed during 2009 (bottom row) compared with corresponding photography from 1958 (top row). (a) Glacier 46441 E-12 as a small ice cap in 1958, which is no longer present in 2009. (b) Three small mountain glaciers (46441 E-9,10,11) remain as thin ice aprons on the north-facing slopes of their niches. None has a distinct accumulation area. (c) Glacier 46441 E-17, a small mountain glacier, has decreased in area but still shows surface snow, suggesting a nonzero AAR.
Missing glaciers
Island-wide, 294 glaciers that were mapped in the baseline inventory were not identified in the GLIMS inventory. Initially, it appeared that these glacierets and mountain glaciers could account for the loss of 146.04 km2 of ice if all 294 glaciers were indeed missing. Though these glaciers only represented 1.25% of the ice coverage in 1959, this is still a significant finding given that it suggests that 26% of the glaciers identified by Reference OmmanneyOmmanney (1969) are no longer present. Figure 5 illustrates some of the glaciers identified in the baseline inventory that could not be identified in satellite imagery from the year 2000 for the GLIMS inventory. These losses were noted mainly in regions 46442 and 46443. In region 46442, one-third (53/152) of the glaciers from the 1959 inventory were not recorded in the 2000 inventory. In region 46443, only 47% of glaciers remain (75/158).
Are all these glaciers truly ‘missing’? Discrepancies between the two inventories may be attributed to conflicting notions of how large ice masses must be to be considered glaciers and, compared to aerial photography, the lower-resolution satellite imagery may create an artificial bias against the detection of small ice masses in the GLIMS inventory. To determine whether these ‘missing’ glaciers have indeed disappeared in the past 50 years, we visited 23 sites of the identified features in summer 2009. Of these, 13 sites had no ice and were deemed to have truly disappeared at some time during the past 50 years (e.g. Fig. 5a). Six sites had ice which was insubstantial in thickness and extent, with entirely bare ice indicating the lack of an accumulation area (e.g. Fig. 5b). The ice in the remaining 4 sites was substantial enough to be mapped as glaciers, but displayed insubstantial accumulation areas and significantly smaller area coverage than observed in the 1959 aerial photographs (e.g. Fig. 5c). With these proportions in mind, it is more likely that the loss of ∼82.5 km2 of ice can be attributed to the disappearance of ∼165 glaciers, and that the remaining ∼128 glaciers from the baseline inventory that went undetected in the GLIMS inventory have shrunk to less than 0.04 km2 (the smallest ice area detected in the GLIMS inventory). As GLIMS methodology states a lower area limit for catalogued glaciers of 0.01 km2 and a precision of 0.001 km2, we interpret the loss of these ice bodies from the GLIMS inventory as being associated with either less-than-favourable imaging conditions for the Landsat 7 scenes, or human error related to conflicting interpretations of glacier definition. To resolve these latter conflicts, it is recommended that future inventory creators refer to multi-year imagery to confirm the perennial status of small ice bodies, as was demonstrated for small ice bodies in generating the baseline inventory (Reference OmmanneyOmmanney, 1969).
Conclusions
Island-wide, the area coverage of glaciers derived from major ice caps in the year 2000 was found to be on the order of 90% of the 1959 extent, whereas independent ice masses (remnant glaciers, niche glaciers, cirque glaciers and ice aprons) maintained only ∼50–80% of their 1959 extent.
According to assessments made by Reference OmmanneyOmmanney (1969), >90% of glaciers showed either marked or slight retreat at the date to which his inventory refers. The remaining glaciers, which exhibited either marked advance or surge potential, were limited to regions dominated by the outlet glaciers of SIC and MIC. Our measurements of glacier growth or minimal shrinkage within these two regions, and more prevalent shrinkage elsewhere, indicate that Reference OmmanneyOmmanney’s (1969) assessments were both perceptive and correct.
Similar to trends observed throughout polar and mountainous regions, we observed the greatest ice loss in regions dominated by small, remnant glaciers. These findings have been attributed to the greater sensitivity of small glaciers to climate forcing (Reference Braun, Hardy and BradleyBraun and others, 2004; Reference Dyurgerov, Meier, Bamber and PayneDyurgerov and Meier, 2004; Reference Paul, Kääb and HaeberliPaul and others, 2007; Reference Andreassen, Paul, Kääb and HausbergAndreassen and others, 2008; Reference Paul and AndreassenPaul and Andreassen, 2009; Reference Paul and SvobodaPaul and Svoboda, 2009; Reference Bolch, Menounos and WheateBolch and others, 2010). Most surprising was that 294 small glaciers, over one-quarter of all glaciers on the island (according to 1959 definitions), were unlisted in the 2000 GLIMS inventory. Field reconnaissance of ‘missing glacier’ locations suggests that, if our field observations are scaled up, ∼165 small glaciers and perennial ice patches have disappeared from the island since 1959, and that the remaining ‘missing glaciers’ are artefacts associated with the use of satellite imagery, which has a comparatively coarser resolution than the photography collected in 1959. As Eureka, to the east of AHI, has experienced a 3.2°C increase in annual average surface temperature since 1972 (G. Lesins and others, unpublished information), we believe that the glacier shrinkage reported here has been in response to that warming, similar to glacier responses to climate warming reported elsewhere in the circumpolar regions (Reference DowdeswellDowdeswell and others, 1997; Reference Sharp, Copland, Filbert, Burgess and WilliamsonSharp and others, 2003; Reference Arendt, Walsh and HarrisonArendt and others, 2009).
The increase in ice area around MIC is thought to be due both to the surges of Iceberg Glacier and ‘Airdrop Glacier’ and changes in ice velocity, which are more pronounced along the steeper western margin of the ice cap than in the glaciers along the eastern margin which terminate on a broad and shallow sloping plateau.
The potential exists to extend the temporal coverage by incorporating: extents from the Little Ice Age generated by Reference Wolken, England and DykeWolken and others (2008), as was done for the Glacier National Park area (Reference Champoux and OmmanneyChampoux and Ommanney, 1986); previous limits identifiable from photography in the 1940s and 1950s; and glacier extents from past and future satellite imagery. While beyond the scope of this study, changes in ice volume should be investigated to determine whether there has been a more substantial overall loss of mass from the island. Fortunately, annual mass balances have been measured in the Expedition Fiord area (Reference Adams, Cogley, Ecclestone and DemuthAdams and others, 1998; Reference Cogley and AdamsCogley and Adams, 2000; Reference Cogley, Adams and EcclestoneCogley and others, 2011) for the last 50 years, so critical field data to complement the broader regional studies continue to accumulate. As the small ice masses have proven to be particularly responsive to climate forcing, it is important that measurements continue on Baby Glacier (∼0.6 km2) (Reference Adams, Cogley, Ecclestone and DemuthAdams and others, 1998). The mass-balance measurements summarized by Reference Cogley, Adams and EcclestoneCogley and others (2011) are temporally complementary to the baseline inventory as they provide a nearly continuous series of measurements since 1959 for White and Baby Glaciers, with respective mass balances of −175 and −150 mm w.e. a−1.
Reference Evans and CoxEvans and Cox (2010), in their study of Spitsbergen glaciers, commented on the value of inventories for recovering climate information, while expressing concern about the omission of smaller glaciers from many inventories. The value of including such glaciers has been demonstrated in this study, as has the value of the original classification table that allowed us to differentiate components of an inhomogeneous population that are subject to different lags and forcings. A simple comparison of differences in area is not enough to assess a regional glacier response to climate change.
Acknowledgements
This research would not have been possible without the logistical support of the Polar Continental Shelf Project and funding from the Natural Sciences and Engineering Research Council of Canada (G.R.O.), the Canadian Space Agency (G.R.O.), the Department of Indian and Northern Affairs Northern Training Grant Program (L.I.T.) and the Association of Canadian Universities for Northern Studies (ACUNS) Canadian Northern Studies Trust Research Support Opportunity (L.I.T.). We thank W. Pollard and M. Ecclestone and those others with whom we shared the McGill Arctic Research Station for their support and companionship in the field. We also thank G. Wolken and W. Harrison for sharing historic photography of the region. We thank G. Cogley and D. Mair for constructive reviews that improved the quality of the manuscript.


