


Globally, Indigenous Peoples, including First Nations in Canada, are more likely to experience poverty, health challenges, obesity and nutrition-related chronic disease (e.g. type 2 diabetes) than their non-Indigenous counterparts(Reference Anderson, Robson and Connolly1–6). First Nations are one of the three Indigenous groups recognised in the Canadian constitution(7). The prevalence of type 2 diabetes is three to five times higher in First Nations than among other Canadians (age-standardised prevalence diabetes rate of 17·2 % in on-reserve First Nations v. 5 % in the non-Indigenous population(6)). The personal burden as well as the health care costs associated with type 2 diabetes will worsen since population growth among First Nations is four times that of the general Canadian population(8).
The high prevalence of nutrition-related chronic disease in First Nations can mostly be explained by the high prevalence of food insecurity that they experience, meaning that they have insufficient physical and financial access to both sufficient healthy market foods (MARKFOOD) as well as culturally appropriate, nutrient-dense traditional food (TRADFOOD) procured from local ecosystems, such as game, fish, fowl and plants(8,9) . There are several explanations for the limited access to TRADFOOD and high-quality MARKFOOD such as fruits, vegetables and unprocessed meat. One reason is that European colonial policies and practices undermined or destroyed land-based food practices and created barriers for Indigenous communities to access sufficient healthy foods from local food systems(Reference Robidoux and Mason10). Another reason is that many First Nations have lower incomes than other Canadians and therefore less money available to purchase nutrient-dense high-quality MARKFOOD(11). Unprocessed nutrient-dense foods like vegetables tend to cost more per g and per kJ than nutrient-poor processed food(Reference Gupta, Hawk and Aggarwal12). Furthermore, the overall cost of obtaining store-bought or MARKFOOD is high in First Nations reserve communities located in rural or remote areas and the quality of fresh foods is poor as a result of spoilage and transportation challenges(Reference Willows, Iserhoff and Napash13).
Considering the health, financial and cultural challenges facing First Nations peoples, it is imperative to provide culturally appropriate, practical recommendations to improve their diet. Improving diet could lessen health concerns in this population at high risk for obesity, CVD and diabetes(Reference Anderson, Robson and Connolly1,Reference Bruce, Riediger and Zacharias14,Reference Ayach and Korda15) . Linear programming is a mathematical technique that can be used to convert nutrient, cost and food constraints into food-based dietary guidelines for healthy eating in populations where food security and cost are important considerations. It can generate optimal solutions that satisfy several constraints including meeting nutrient requirements at low cost and conforming to typical eating habits in the target population including important TRADFOOD (i.e. remain as close to the population diet as possible)(Reference Briend and Darmon16,Reference Buttriss, Briend and Darmon17) . The advantage of this technique is that the existing diet of a population is the basis for modelling; thus, optimal diets contain familiar foods. Because this technique can integrate many variables and constraints, it is well suited to the complex task of developing dietary guidelines in challenging environments such as those that exist in many First Nations communities(Reference Buttriss, Briend and Darmon17).
Our objective was to examine the possibility of meeting Institute of Medicine nutrient requirements for macro- and micronutrients in healthy persons(18–23) based on the foods available and consumed in First Nations reserve communities in Ontario, at no additional cost (i.e. the cost of the theoretical diet must be equal to, or below, the estimated cost of the observed diet). In the province of Ontario, 47·6 % of First Nations adults living on reserves report living in food-insecure households (marginal, moderate and severe household food insecurity, combined)(24). Although this approach to diet modelling has been used previously to formulate cost-efficient and favourable dietary patterns in other populations(Reference Briend and Darmon16,Reference Drewnowski and Darmon25,Reference Parlesak, Tetens and Dejgard Jensen26) , to our knowledge, it has never been used to optimise diets in First Nations individuals in Canada.
Methods
Study participants
Data were collected in the autumn of 2011 and 2012 from participants in eighteen reserve communities in the province of Ontario, as part of the First Nations Food, Nutrition and Environment Study (FNFNES)(Reference Chan, Receveur and Batal27). The details of FNFNES have been described elsewhere(Reference Chan, Receveur and Batal27–Reference Batal, Johnson-Down and Moubarac29). Briefly, FNFNES was a pan-Canadian study that aimed to address gaps in knowledge regarding diet and environment among First Nations adults living on-reserve south of the 60th parallel in Canada. FNFNES data represent the most complete dietary information available from a representative sample of First Nations individuals to ever be collected in Ontario. Informed consent was obtained from all participants. This study was conducted according to the guidelines laid down in the Declaration of Helsinki and all procedures involving human participants were approved by the research ethics boards of Health Canada, University of Northern British Columbia, University of Ottawa and Université de Montréal. Written informed consent was obtained from all participants.
Of the eighteen communities included in the analyses, seven (39 %) were remote (fly-in or winter road only), two (11 %) were rural or ≥60 km away from the nearest urban centre and nine were within 60 km of an urban centre. Of the 1919 households of the participating First Nations communities in Ontario, thirty-one did not have eligible participants (First Nations, 19 years or older, or living on-reserve; without health conditions such as deafness or cognitive impairment) and seventy-nine were vacant. Of the remaining 1809 households, 380 refused to participate or had incomplete interviews. There were 1429 complete interviews; however, after excluding pregnant and breast-feeding women (n 40) and individuals with no food intake the prior day (n 2), the final sample size for the present study was 1387 interviews.
Household food insecurity
A food security questionnaire adapted from the Household Food Security Module used in the USA(Reference Bickel, Nord and Price30) for use in Canada and Indigenous individuals was conducted(Reference Lawn and Harvey31). Households were classified as food secure when they gave no indication of income-related food access. Classifications of marginal (some concern or problem with food access), moderate (compromises in the quality and/or quantity of foods) and severe (reduced food intake due to lack of money) food insecurity were included in estimates(Reference Tarasuk, Mitchell and Dachner32).
Dietary data
For each participant, dietary intake was assessed using a single 24-h recall. Dietary recalls were conducted by trained community interviewers using a three-stage multiple-pass method, i.e. quick list, detailed description and review(Reference Raper, Perloff and Ingwersen33). Three-dimensional food models were used to estimate portion sizes (Santé Québec, Montréal, Québec, Canada). Dietary recalls were entered by research nutritionists at the Université de Montréal using CANDAT (Godin, London, Ontario, Canada), a nutrient analysis software utilising the 2010 Canadian Nutrient File (CNF)(34).
The accuracy of 24-h recall data entry was ensured by cross-checking 10 % of the records and conducting preliminary analyses to detect outlying food and nutrient intakes (defined as ±2 sd of the mean for energy and nutrients)(Reference Batal, Johnson-Down and Moubarac29). All errors were reconciled before data analyses.
All missing nutrients from the 2010 CNF were imputed using the 2015 CNF(35) and the United States Department of Agriculture Food and Nutrient Database for Dietary Studies(36). Nutritional information about TRADFOOD and MARKFOOD that was not available from the CNF was manually added to the database by an FNFNES analyst(Reference Schakel, Buzzard and Gebhardt37).
Food groupings
Diet modelling requires the categorisation of foods into food groupings for input into the program. A total of 1705 foods consumed by the participants were classified into forty-nine food groups (Table 1). Dairy food groups were categorised into high-fat and low-fat versions (low-fat fluid milk, yogurt with ≤2 % milk fat (M.F.) and low-fat cheese with ≤20 % M.F.)(Reference Johnson-Down, Ritter and Starkey38). Since Hg contamination is a concern in certain First Nations communities traditional fish from local lakes and rivers was classified into high and low Hg content based on a cut-off of 0·5 µg/g(39). The mean daily portion size (g/person per d) from the observed diet for each of the forty-nine food groups was obtained from the recalls. The composite nutrient profile of each of the food groups was calculated by weighting the proportional consumption of the foods contained in each food group by the weight (g) of food for thirty nutrients (see list in Table 2). The rationale for this approach is that a food eaten more often would have a greater impact on the nutrient intake(Reference Ferguson, Darmon and Briend40–Reference Marcoe, Juan and Yamini42). Diet beverages (e.g. soda) were included but not other non-energy foods such as coffee, tea and water.
Table 1. Food groups used for modelling intake and proportion of 1387 First Nations individuals from Ontario, Canada consuming each food group
M.F., milk fat.
* Food categories used to define constraints of serving sizes in linear programming optimisation.
† The same hot cereals appear in both the high fibre and low fibre groups because the dry cereals meet the high fibre criterion of greater than 4 g per 100 g whereas the prepared cereals do not.
Table 2. Comparison of nutrient intake for observed and optimised diets in 1387 First Nations individuals from Ontario, Canada

NA, not applicable; AMDR, acceptable macronutrient distribution range; EAR, estimated average requirement; AI, adequate intake.
* Values are less than 100 % observed where there is a minimum and greater than 100 % where there is a maximum.
† Nutrient constraints used Institute of Medicine AMDR, EAR, AI or accepted guidelines.
‡ Observed is the actual observed diet of the participants.
§ Model 1 for both women and men was optimised using only nutrient constraints such as meeting EAR, AI, AMDR except maximum 30 % energy as fat, 10 % energy as free sugars, 25 % as energy of total sugars and 10 % energy as SFA.
‖ Model 2 for women included most nutrient constraints from model 1 except for Ca, fibre, P and K and additional constraints on foods limiting minimums to no less than half and maximums to double for most foods except diet and sweet drinks, coffee whitener, fats, high-sugar foods and processed meats that were limited to a maximum of the same amount as the observed.
¶ Model 2 for men included most nutrient constraints from model 1 with the exception of Ca, fibre, Mg, K and vitamins A and D and additional constraints as for the women.
Food cost
The cost of foods was determined in two different ways. During the initial data collection in 2011–2012, the cost of sixty-seven basic food items contained in Health Canada's 2008 National Nutritious Food Basket Tool (Appendix 1)(43) were collected and averaged across food retailers in the sampled communities. These costs were increased by 9·08 % to account for the cost of living increase(44). Because the food basket did not include many pre-packaged meals consumed by First Nations (such as pizza, canned stew, etc.), spices and condiments, these costs were obtained from the Independent Grocers Alliance online grocery shopping website(45) using a store location in Ottawa, Ontario, Canada recording only regular prices from 2018. To account for the higher costs in remote communities, we compared the cost of items in the Health Canada's 2008 National Nutritious Food Basket in the sampled communities with those in Ottawa and calculated an average price increment of 20·4 % that was applied to the costs obtained from the Independent Grocers Alliance website. Food cost for each of the forty-nine food groups created for this study was then calculated for the gram weight of the edible yield of the food and then weighted by the contribution to the total gram weights of all the foods in a food group(Reference Drewnowski and Darmon25,Reference Darmon, Ferguson and Briend41) .
Diet modelling
Optimal diet models were formulated to identify the dietary changes necessary for First Nations adults to achieve dietary reference intakes recommended by the Institute of Medicine(18–23). Separate models were run for men and women because their dietary patterns and nutritional requirements are different. The models were designed to meet nutrient requirements while remaining as close to the mean observed population diet as possible (as reported in the 24-h recalls of the First Nations) (Table 3). This assumes that a population would be more likely to adopt a recommended diet if the foods were like the observed population diets and did not cost more(Reference Darmon, Ferguson and Briend46).
Table 3. Summary of optimisation model scenarios for 1387 First Nations individuals from Ontario, Canada*
* Models minimising the sum of the absolute difference between the portion size of a food group in a hypothetical modelled diet and the observed diet.
† Nutrient constraints for energy, protein, carbohydrate, fat, SFA, free sugar, Ca, Cu, dietary folate, fibre, Fe, linoleic and linolenic acids, Mg, niacin, P, K, riboflavin, Na, thiamine, vitamins A, B6, B12, C and D, and Zn.
‡ See Appendix 3 for more detailed food group constraints.
§ High Hg defined as greater than 0·5 µg/g.
Objective function
Optimisation by linear programming was used to establish an objective function defined as the ‘total departure from mean food intake’ (TDMI)(Reference Darmon, Ferguson and Briend46). TDMI is the sum of the absolute difference between the portion size of a food group in a hypothetical modelled diet and the observed diet(Reference Briend and Darmon16,Reference Drewnowski and Darmon25,Reference Darmon, Ferguson and Briend41) . Constraints such as meeting nutrient requirements, minimising cost and ensuring that certain foods such as TRADFOOD are either maximised or minimised were utilised in our analyses(Reference Darmon, Ferguson and Briend41,Reference Darmon, Darmon and Maillot47) . If an optimal objective function cannot be achieved, the model is considered infeasible. The program then identifies the infeasible constraints that can then be either relaxed or dropped (see Table 3).
Energy, nutrient and cost constraints
In model 1, energy and cost were limited to being equal to or less than the observed diet or observed amounts; because this was not possible in women, the energy constraint was relaxed (i.e. increased) until a feasible model was obtained (Table 3). Constraints included a minimum of the estimated average requirements (EAR) or adequate intake for Ca, Cu, dietary folate, fibre, Fe, linoleic and linolenic acids, Mg, niacin, P, K, riboflavin, Na, thiamine, vitamins A, B6, B12, C and D, and Zn; the minimum of the acceptable macronutrient distribution range for protein, fat and carbohydrates (see Table 2); the maximum of the tolerable upper intake level (UL) for Ca, Cu, Fe, Na, P, Zn and vitamins A, B6, C and D (see Table 2)(19–23,48) . Some nutrients such as cholesterol, MUFA and PUFA and total sugar had no constraints applied. Other nutrients, i.e. SFA (≤10 %) and free sugars (≤10 %) were limited using accepted guidelines(23,49) . Because nutrient requirements are established by age, these were weighted by the number of participants in each age group as outlined in Table 2.
Because model 1 reduced or increased the intake of some foods to amounts unlikely to be ingested by an average individual, model 2 was designed adding constraints on food consumption. Unhealthy foods or foods that contributed little nutrient value or high fat (i.e. diet and sugar drinks, coffee whitener, salad dressings, oils, butter, margarine, fruit juice, processed meats, salt, table sauces, and savoury and sugary snacks) were limited to no less than half and no more than the amount in the observed diet whereas other foods, the maximum was no more than double the observed amount (Table 3 and Appendix 2). To attain a feasible model (i.e. model 2), we were unable to meet all the nutrient requirements, so it was necessary to remove nutrient constraints for Ca, fibre, linoleic and linolenic acids, K and vitamin D for both sexes, P in the women, Mg and vitamin A in the men (Table 3).
Statistical analysis
All analyses were conducted using PROC OPTMODEL in SAS/STAT software version 9.4 (SAS, 2013).
Results
Study participants
Mean age of the participants was 46·6 (sd 15·5) years for women and 47·4 (sd 16·2) years for men (Table 4). Mean BMI was 31·2 (sd 6·59) kg/m in women and 30·4 (sd 5·51) kg/m in men, with almost 50 % of individuals categorised as obese (BMI ≥ 30 kg/m) (Table 4). Most participants were employed (66 %), with 52 % reporting their main source of income as employment (Table 4). Household food insecurity was reported by 41 % of individuals (Table 4). Only 14 % reported eating TRADFOOD on the day of the recall (Table 4).
Table 4. Demographic and lifestyle characteristics of adults 19 years and older from eighteen on-reserve First Nations communities in Ontario, Canada, 2011–2012*
(Numbers of participants and percentages; mean values and standard deviations)
TRADFOOD, nutrient-dense traditional food.
* Source: First Nations Food, Nutrition and Environment Study. Data are unweighted.
† Workers’ compensation/employment insurance. Employment insurance is an insurance provided by the Canadian government for 1 year after an individual loses their job.
‡ Employment was defined as anyone in the household working for wages either part or full time.
§ Food security established using the income-related Household Food Security Survey Module adapted from food security module developed in the USA and adapted for First Nations households(Reference Bickel, Nord and Price30,Reference Lawn and Harvey31) .
Observed diet
Mean observed energy intake in women and men, respectively, was 7360 and 9422 kJ (1759 and 2252 kcal/d) (Table 2) at a total daily cost of $9·47 and $11·09 (Canadian dollars) for store-bought foods (TRADFOODS were not included in cost estimates) (Fig. 1 and Appendix 4). In women and men, the mean observed energy percenatges from macronutrients was: 47 and 45 % from carbohydrates, 37 and 38 % from fat and 17 and 18 % from protein, with fat being above the acceptable macronutrient distribution range(23). Energy percentage from saturated fat was 12 % in both women and men while that from free sugar was 14 %, both higher than recommended intakes(23,49) . Intake of Na exceeded the UL by 20 and 54 % in women and men, respectively(18). Nutrient requirements as defined by the adequate intake or the EAR were not met for fibre, vitamin D, Ca, Mg and K in both sexes, and P in women (Table 2)(18,19,23,50) .
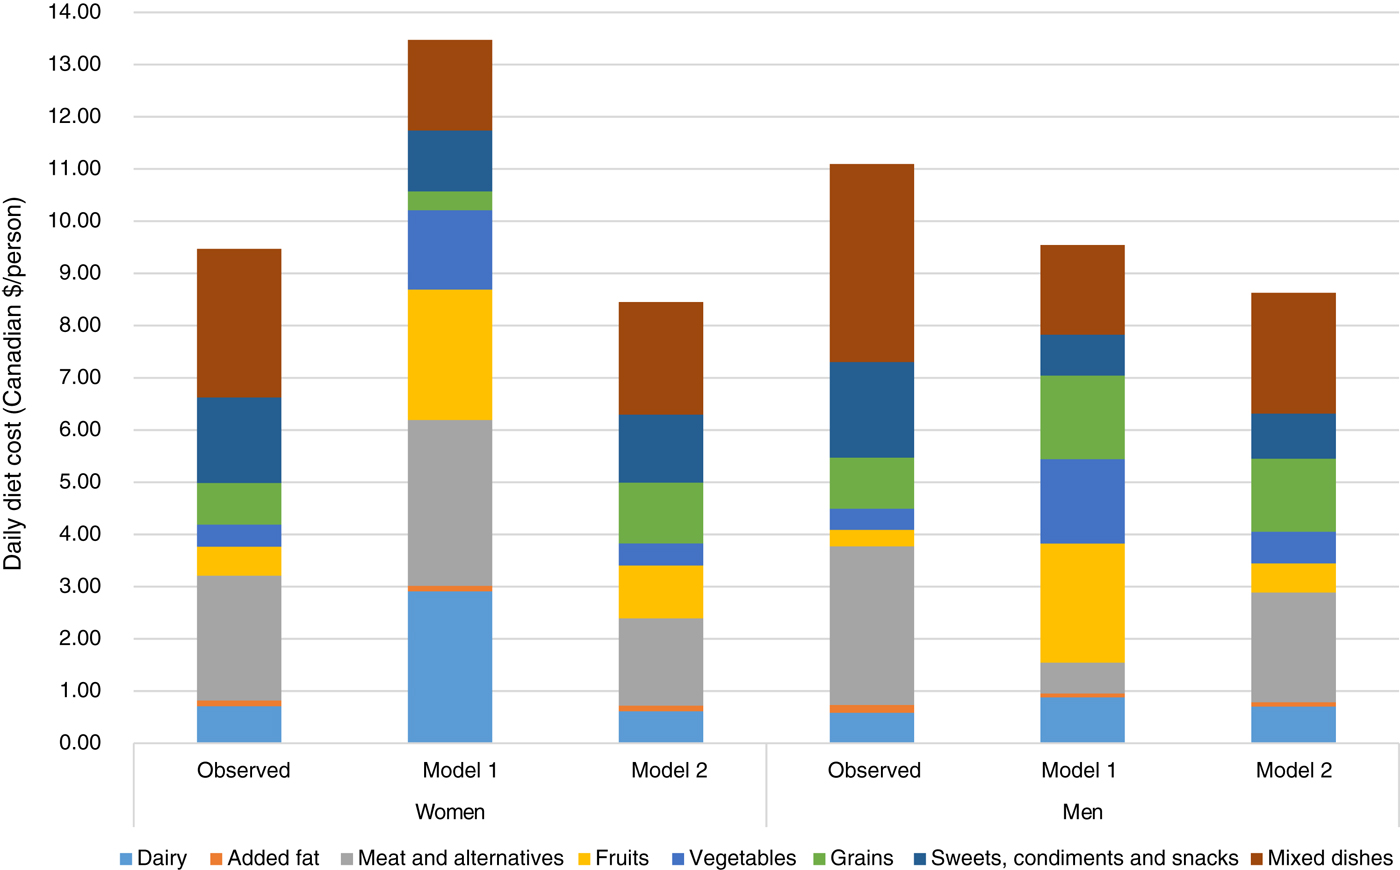
Fig. 1. Comparison of food group costs (Canadian $/d) between the observed population diets for men and women and diets obtained through modelling.
The largest contribution of a food to cost and energy in the observed diet was mixed dishes for women and men (21 and 23 % of total cost and 13 % of total energy) (Appendices 3 and 5): examples of these mixed dishes included beef and vegetarian stew, pizza, lasagne, pierogis or dumplings, hamburgers and macaroni and cheese. These were followed by white bread and sweet desserts in women and beef and sweet drinks in men.
Modelled diets
Model 1 in both women and men met all nutrient constraints but some of the recommended food amounts were more than twice the observed consumed quantities. In women, the modelled diet cost was higher than the observed diet (estimated as $13·47 (modelled) v. $9·47 (observed) in 2018) whereas it was lower for men (estimated as $9·54 (modelled) v. $11·09 (observed) in 2018) (Fig. 1 and Appendix 4). Similarly, energy intake was higher than the observed diet in women (8104 v. 7360 kJ; 1937 v. 1759 kcal) and lower in men (8368 v. 9422 kJ; 2000 v. 2252 kcal) (Table 2). Depending on sex, intakes of diet drinks, evaporated milk, fluid milk, fruit, meat alternatives, traditional and store-bought fish increased by more than 500 % of the observed amounts (Fig. 2). By contrast, foods such as cooking oils, butter, margarine, beef, eggs, pork, poultry and soup were reduced to small impractical amounts, not reflecting observed intake (Fig. 2).
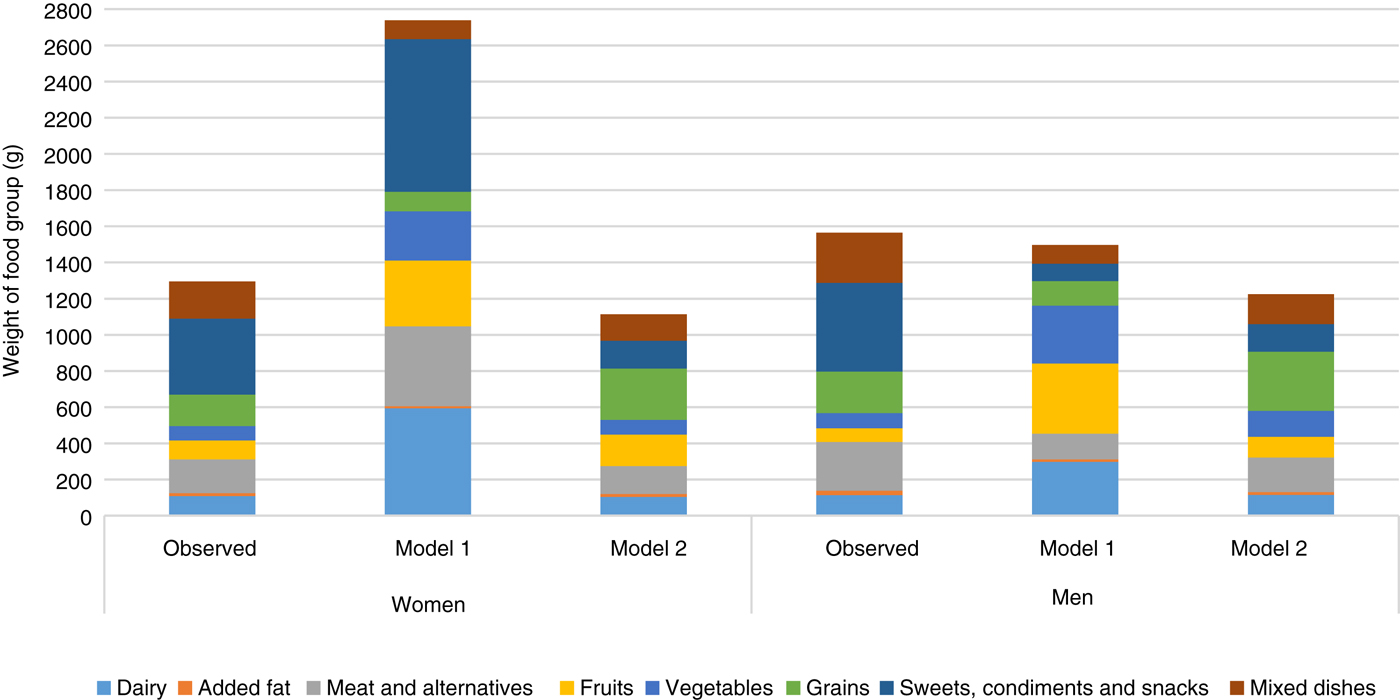
Fig. 2. Comparison of weight of food groups between the observed population diets for women and men and diets obtained through modelling.
Although model 2 was not able to meet all nutrient requirements, suggested food amounts were more reasonable. Energy intake was 7326 kJ (1751 kcal) in women (almost identical to the observed diet) and 8205 kJ (1961 kcal) in men (lower than the observed energy intake of 9422 kJ (2252 kcal)) (Table 2). Food costs were reduced from observed (women, $8·45 v. $9·47 and men, $8·63 v. $11·09) (Fig. 1 and Appendix 4). Because initially the model was infeasible, nutrient constraints were dropped for fibre, linoleic and linolenic acids, vitamin D, Ca and K in both sexes, P in women and Mg and vitamin A in men resulting in a decrease in vitamin D and Ca from observed intake in both sexes, and linoleic acid in men (all below dietary reference intakes). Despite being below recommendations, fibre and K were increased in both sexes, P in women and Mg in men(18,19,23) . Model 2 was able to lower Na to the UL and sugar and saturated fat to within acceptable guidelines(18,23,49) .
To meet most nutrient constraints, it was necessary to increase store-bought fresh or frozen fish to more than the double allowed by model 2 but the resulting amounts were within attainable ranges: for example, model 2 suggests 50 and 56 g of store-bought fresh or frozen fish per week for women and men, respectively (less than the 75 g portion recommended by the 2007 Canada's Food Guide)(51). In both men and women, model 2 allowed some high-sugar items while staying within the free sugar constraint of 10 % of energy. Foods such as hot cereals, pasta and rice, potatoes and meat alternatives were doubled or almost doubled, whereas amounts of high-fat cheese, mixed dishes, soup, eggs, beef and sweet drinks were reduced (Fig. 2). Vegetable and fruit intakes were increased (Fig. 2). Na intake was reduced by the elimination of processed meats and a reduction in the amounts of soup.
Discussion
The FNFNES is the largest Canadian study to look at the nutrition of First Nations living on reserves to date, and it provides a unique opportunity to understand current food and nutrient intakes in this population. Using food intake data (collected via 24-h recalls) from a larger sample than most other studies with First Nations in North America and optimisation modelling, we propose a diet for First Nations men and women based on a modelled dietary pattern (i.e. model 2) with realistic amounts of currently consumed foods including TRADFOOD(Reference Briend, Darmon and Ferguson52). Our data were collected in one season which may have influenced the TRADFOOD intake in the observed diet as TRADFOOD are harvested seasonally, and their intake is thereby influenced by the time of year.
First Nations living on-reserve have grappled with issues of TRADFOOD contamination(Reference Hlimi, Skinner and Hanning53–Reference Willows55). We have taken into consideration the possible contribution of traditional fish to Hg contamination by limiting high-Hg species in our modelling, but we do not know whether the availability or palatability of these fish alternatives would influence consumption. Also, our modelling did not consider other possible contaminants, such as persistent organic pollutants, nor did it consider species availability and environmental impacts of much increased reliance on TRADFOOD in general.
The dietary patterns were modelled using EAR, adequate intake and UL as constraints whereas other investigators have used more stringent criteria such as the RDA or RDI(Reference Brimblecombe, Ferguson and Liberato56–Reference Lluch, Maillot and Gazan59). Our decision to use the EAR was conservative but it is justified because Institute of Medicine guidelines suggest the EAR as a cut-off for groups as the RDA/RDI require meeting requirements for 97 % of a healthy population(60). Despite using the lower nutrient objectives, the modelled diet was not able to meet all the nutrient requirements for this population; however, most of the nutrient intakes increased from observed amounts. Supplementation with fibre, vitamin D, Ca, Mg, K, P and linoleic acid would allow individuals to meet their dietary requirements if the modelled diet were adopted; ideally, individuals should aim to meet their nutrient needs through healthy eating patterns that include nutrient-dense foods. On the other hand, and unlike an Australian study of Indigenous individuals(Reference Brimblecombe, Ferguson and Liberato56), the modelled diets were able to reduce Na to the UL without increasing cost and as a result, the prevalence of high blood pressure, a risk for CVD, could be lowered(Reference Lawes, Vander Hoorn and Rodgers61,Reference Zhang, Cogswell and Gillespie62) . Higher intakes of SFA have been associated with higher risk of CVD and diabetes, so lowering this could also help improve the health of this at-risk population(Reference Chowdhury, Warnakula and Kunutsor63–Reference Micha and Mozaffarian65).
Using linear programming, our model reduced food costs by 22 % in the men and 11 % in the women, while improving or meeting nutrient requirements. This is an important consideration because First Nations individuals have lower incomes than other Canadians(11) and there is a concern that a healthier diet may be prohibitively expensive(Reference Marty, Dubois and Gaubard58,Reference Darmon and Drewnowski66–Reference Williams, Johnson and Kratzmann68) . Food costs in this study were influenced by the remoteness of communities; these were averaged over all communities sampled but would have been considerably higher in the more remote communities; for example, depending on the region, the weekly cost for a family of four ranged from $175 to $344 (Canadian dollars)(Reference Chan, Receveur and Batal27). We probably underestimated the cost of a healthy diet because the expense of harvesting TRADFOOD is a barrier to obtaining it(Reference Laberge Gaudin, Receveur and Girard69–Reference Chan, Fediuk and Hamilton71). In our study, the modelled diet did not include the cost estimates for TRADFOOD or the expense of obtaining them.
Proposing a modelled diet requires a shift away from certain commonly consumed foods (for example, processed meats where intake was reduced to zero in the present study) and a likely shift in the food system supporting the food choices, but it can reinforce TRADFOOD intake as this can be include in the constraints. Communication with health workers, dietitians and store managers in communities is important to promote the healthier alternatives with individuals while also making them more available (that is, increased physical and economic access) in community stores.
Conclusion
A typical approach to encouraging behavioural change has been the provision of information about how and why one should choose a healthy diet; however, this has not always been successful in modifying eating behaviours because it requires the consumers to translate dietary guidelines into eating patterns(Reference Guthrie, Mancino and Lin72). This is a difficult task in First Nations communities where many foods are too expensive to purchase or are not available(Reference Willows, Iserhoff and Napash13). A more suitable approach would be to recommend a diet as similar as possible to the existing one in terms of cost and food availability. Linear programming allowed us to do this by designing a hypothetical diet that is similar in content to the existing diet(Reference Darmon, Ferguson and Briend41); however, we found that it may not be possible to obtain a feasible diet that meets all nutrient requirements in this Indigenous population based on the current intakes that reflect the availability/accessibility/familiarity of foods in this population. Therefore, where nutrients requirements were not met, supplementation would be required which goes against recommendations for individuals to meet their nutrient needs through healthy eating patterns that include nutrient-dense foods that are fresh or minimally processed and from meals that are prepared from scratch using these foods.
Modelling diets in this fashion allows us to suggest a modified intake using existing consumption while considering the cost of these proposed changes. This allows more practical recommendations that include important TRADFOOD. Identifying food patterns that provide needed nutrients at an affordable cost can go a long way towards mitigating social inequalities such as those that exist in First Nations peoples(11,Reference Darmon and Drewnowski66) . This, however, does not preclude the important endeavour of understanding and addressing the underlying causes of food insecurity and dietary inadequacy in First Nations peoples, foremost among them the eradication of poverty.
Acknowledgements
We would like to thank all the participants and staff of the FNFNES without which none of these analyses would have been possible.
Funding for this analysis was provided by an operating grant from the Canadian Institutes for Health Research (CIHR) for the research project ‘Pulling Together for Health Research: Food Security in First Nations Communities’, grant no. 348833 and 334049. The data used in this article originate from the First Nations Food, Nutrition and Environment Study (FNFNES) funded by Indigenous Services Canada.
M. B., H. M. C., T. S., A. I. and K. F. designed and conducted the research; T.-A. K., M. B., N. W. and L. J.-D. designed the analysis; L. J.-D. analysed the data and wrote the manuscript; N. W. edited the manuscript; M. B. and N. W. had primary responsibility for final content. All authors read and approved of the final manuscript.
There are no conflicts of interest.
Appendices
Appendix 1. List of foods used to calculate the cost of a nutritious food basket
Appendix 2. Constraints on food amounts
Appendix 3. Cost and weight of foods from optimisation modelling of diet in 1387 First Nations individuals from Ontario, Canada
Appendix 4. Comparison of cost and percentage cost for foods in observed and optimised diets in 1387 First Nations individuals from Ontario, Canada
Appendix 5. Comparison of energy and energy percentage for foods in observed and optimised diets in 1387 First Nations individuals from Ontario, Canada


 Open access