


INTRODUCTION
In the past decade, emergency department (ED) visits for children have increased to more than 25 million annually in the United States.Reference McCaig and Nawar 1 According to the Canadian Institute for Health Information, children less than 5 years old constituted the most frequent visitors of Canadian EDs, with 8.7% of total ED visits. The number of visits at a Canadian pediatric hospital ED between 2002 and 2011 increased by 30%.Reference Doan, Genuis and Yu 2
The increased use of ED services is recognized as a contributor to crowding. Other factors include delays in patient transfer from the ED, limited primary care access, and ED staff training limitations.Reference Doan, Genuis and Yu 2 ED crowding can be defined as a situation where the need for emergency services exceeds the available resources for patient care 3 and can lead to compromised quality and access to health care.Reference Hoot and Aronsky 4 Improvement in adult ED crowding has been associated with decreased mortality rate among admitted patients,Reference Geelhoed and de Klerk 5 and ED crowding has been associated with increased costs, adverse outcomes, and overflow in hospital.
The etiology of pediatric emergency department (PED) crowding is multifactorial, attributing to input, throughput, and output factors of the PED. Whereas the delay of admitted patient transfer is recognized as the leading determinant of adult ED crowding, patient volume represents a stronger contributor of PED crowding. Frequent ED use and non-urgent visits are thought to significantly contribute to the high volumes of patients seen in PED.Reference Hoot and Aronsky 4 Pediatric studies reveal that up to 72% of PED visits were accounted for by frequent users.Reference Geelhoed and de Klerk 5 - Reference Cabey, MacNeill and White 8
Children who frequently use the ED have notably had a poorer quality of life and more school absenteeism.Reference Neuman, Alpern and Hall 6 , Reference Boulet, Belanger and Lajoie 9 , Reference Ben-Isaac, Schrager and Keefer 10 Improvement in adult ED crowding has been associated with decreased mortality rate among admitted patients.Reference Geelhoed and de Klerk 5 Factors that can lead to ED crowding, such as frequent ED use, merit more attention in pediatric emergency medicine research. Further studies exploring the organization, delivery of services, and cost-effectiveness are needed to improve pediatric emergency evidence-based practice.
Frequent ED use is defined as recurrent ED use over a period of time by certain individuals.Reference Locker, Baston and Mason 11 ,12 The cut-off number of ED visits required to be classified as a frequent ED user varies from 2-12 times per year.Reference Zuckerman and Shen 13 - Reference Kroner, Hoffmann and Brousseau 16 The most widely used definition of frequent ED users includes patients who present repeatedly due to non-random events of five or more times per year.Reference Locker, Baston and Mason 17
The U.S. literature reveals that patients of younger age, of black, Hispanic, or Native American ethnicity and covered by public insurance and known for chronic conditions are more likely to have recurrent ED visits.Reference Alpern, Clark and Alessandrini 18 This literature may not be applicable in Canada where the PED population seems to be healthier, as shown by a recent publicationReference Salois 19 that revealed that in 2012-2013, 83% of PED visits were for ambulatory care.
A better assessment of frequent ED user characteristics is essential to offer evidence-based primary care interventions tailored for these patient populations. From the current pediatric literature, little is known about the demographics, diagnoses, and acuity level of the patients who frequently use the PED in Canada.
STUDY OBJECTIVES AND HYPOTHESIS
Our primary objective is to characterize the frequent PED user population. Our secondary objective is to examine risk factors for frequent PED use.
We hypothesize that children younger than 1 year of age, of low socioeconomic status, and with higher acuity at first presentation are more likely to frequently use the PED.
METHODS
Study design and setting
We conducted a retrospective cohort study of PED visits at a single tertiary care hospital. The institutional research ethics board approved the study.
We included all patients ages 0-18 years who presented to the ED of the Montreal Children Hospital from January 1, 2013 to December 31, 2014. Following the index visit in 2013, we recorded return visits during the following 365 days. We excluded patients who died within the study period. The term frequent user was defined as a patient with five or more visits to the PED within 1 year following the index visit.
Data were abstracted from the SIURGE electronic database (Logibec Groupe Informatique Inc., Montréal), the ED patient tracking database of the Montreal Children’s Hospital. Data were collected and entered in the SIURGE database on a daily basis by the treating emergency physicians, residents, nurses, and administrative clerks. The SIURGE database is a Montreal Children’s Hospital internal computerized patient tracking system, which features a triage module based on the Canadian Triage and Acuity Scale (CTAS) categories. It has been in use in our institution since 2000. Pre-set data were collected on the individual patients. Patients were given International Classification of Diseases (ICD)-10 diagnoses based on the physician’s understanding of the illness at the time of discharge or transfer from the unit.
Demographic and clinical variables
Variables recorded in the SIURGE database were included and data were extracted. Recorded demographic characteristics include age, sex, and a six-digit postal code. Clinical characteristics include level of acuity, length of stay, and the diagnoses at each ED visit. Level of acuity is assessed based on the CTAS. There are five CTAS levels designed, such that level 1 represents the critically ill patient requiring immediate medical attention, and level 5 represents the least ill patient.
The primary diagnoses are classified according to the ICD-10, then further grouped into the ten most frequent diagnosis grouping system subgroups based on data previously published by PECARN in 2014Reference Alpern, Clark and Alessandrini 7 as described in the paragraph on diagnosis grouping system subgroups.
The area level socioeconomic status is obtained using the material and social deprivation index developed by Pampalon and Raymond in 2000,Reference Pampalon, Hamel and Gamache 20 - Reference Pampalon and Raymond 22 derived from six-digit postal codes. The deprivation index is based on the dissemination areas (DAs), which are the smallest available geographic units from the national census for which data are available from Statistics Canada, with a population varying between 400 and 700 people. These DAs are considered relatively homogeneous in socioeconomic composition and are linked to the six-digit postal codes available in the REPACQ registry (Registre de la Paralysie Cérébrale au Quebec) using the postal code conversion file from Statistics Canada. The deprivation index is derived from six indicators, three for material and three for social components. The material component is composed of the 1) proportion of the population ages 15 years and over without a high school diploma or equivalent, 2) employment-to-population ratio for the population, and 3) average income of the population ages 15 years and over. The social component is composed of the 1) proportion of individuals ages 15 years and older living alone, 2) proportion of the population ages 15 years and over who are separated, divorced, or widowed, and 3) proportion of single-parent families. Five of these six indicators are adjusted for age and sex, except for the proportion of single-parent family indicator. The deprivation indices provide deprivation scores for each DA. These scores are divided into quintiles, with Quintile 1 representing the most privileged group and Quintile 5 representing the most disadvantaged group. This deprivation index is used as the final area-level measure of socioeconomic status.
Diagnosis grouping system subgroups
In the SIURGE database, the primary diagnosis is entered based on ICD-10 coding. ICD-10 coding now includes a total of 71,924 codes for procedures and 69,823 codes for diagnoses. We based the classification on the top 10 most frequent diagnosis grouping system subgroups published by the PECARN group in 2014.Reference Alpern, Clark and Alessandrini 7 The 10 subgroups include asthma, infectious ear/nose/sinus disorders (including upper respiratory infection), fever, viral illnesses, other respiratory diseases, other gastrointestinal diseases, infectious respiratory diseases, noninfectious skin/dermatologic/soft-tissue diseases, gastroenteritis, and non-infectious neurological disorders.
The number of visits for each patient is calculated to classify frequent users. Demographic and clinical characteristics at baseline are summarized by proportions for categorical data and by median (interquartile range) for continuous data, stratified by frequent users versus non-frequent users. A logistic regression is used to assess the impact of the baseline demographic and clinical characteristics (determined as a priori, as described in the section on demographic and clinical variables), and the Quebec deprivation index on the frequent users. A negative binomial model is also used to assess the impact of these variables on the recurrent visit. All data analyses were carried out using SAS version 9.4 (SAS Institute, Cary, NC).
RESULTS
During the study period, a total of 52,088 patients accounted for 94,155 visits. In this cohort of 52,088 patients, patients had between 0 and 24 ED visits within a year: 58.4% of patients had no recurrent visits, 22.7% had one, 9.8% had three, 4.4% had four, and 4.7% had five or more recurrent visits. Those 2,474 (4.7%) patients with five and more recurrent visits accounted for 16.6% (15,612 visits) of the total PED visits. The demographic and clinical characteristics of this cohort are shown in Table 1.
Table 1 Demographic and clinical characteristics among frequent versus non-frequent users at the index visit

* Median (interquartile range) for continuous data. N=52,088.
The distribution of primary diagnosis at each visit is outlined in Table 2. Overall, ear, nose, and sinus disorders were the most common subgroup across all numbers of recurrent visits. Infectious respiratory diseases, asthma, and non-infectious neurological disorders accounted for other frequent diagnosis subgroups in frequent ED users.
Table 2 Distribution of primary diagnosis at each visit (%)

* Indicates the three groups of diagnosis most often encountered in frequent users.
Predictors of frequent ED use
The association between demographic and clinical variables and the number of recurrent visits is depicted in Figures 1 and 2. Figure 1 demonstrates that younger age is associated with increased recurrent visits. The number of visits decreases significantly by school age. Figure 2-A depicts the association between higher level of acuity at initial presentation and increased ED recurrent visits. Figure 1-B and 1-C outlines the association between a lower socioeconomic status (higher material and social deprivation index) and higher number of recurrent visits.
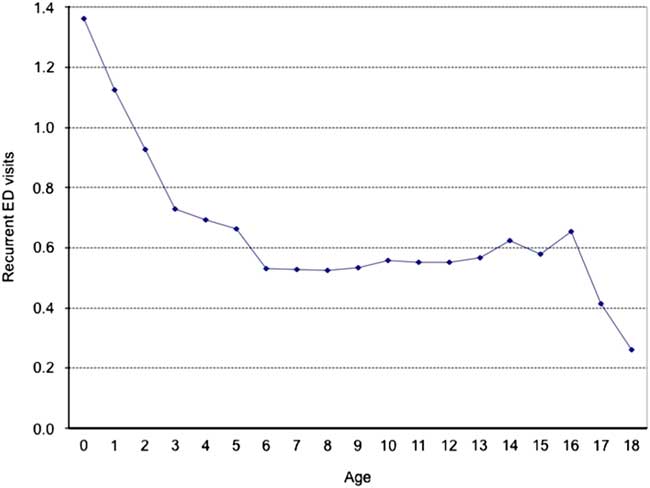
Figure 1 Recurrent emergency visits according to age. The Y axis is the mean number of recurrent emergency department visits.
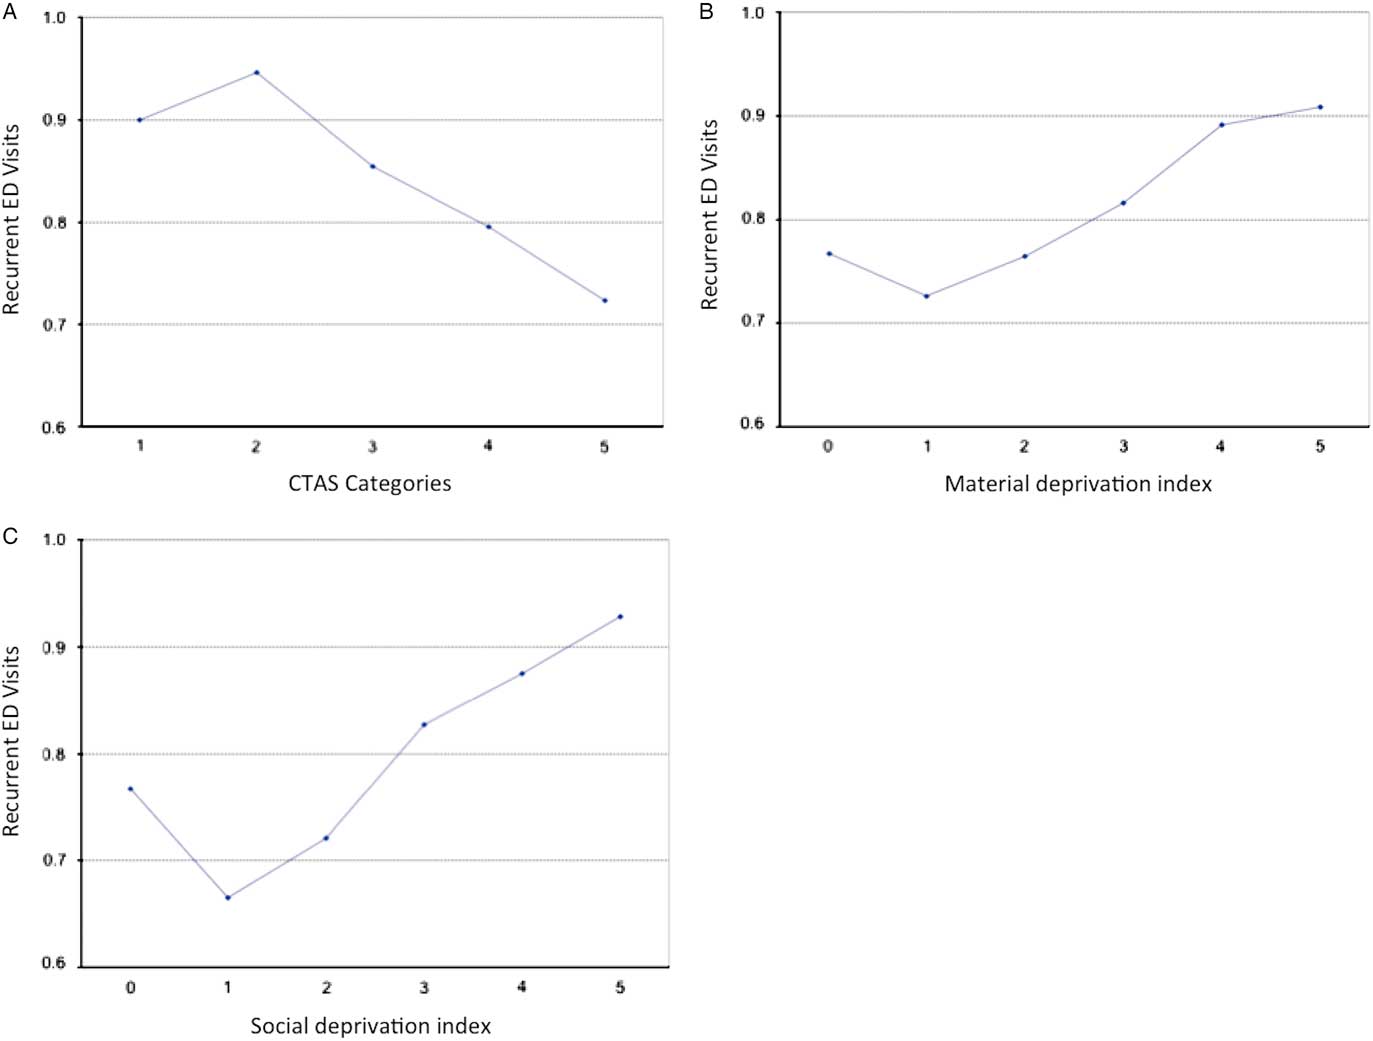
Figure 2 Recurrent emergency visits according to the A) Canadian Triage and Acuity Scale (1-5), B) material deprivation index (0-5), and C) social deprivation index (0-5). The Y axis is the mean number of recurrent emergency department visits.
A logistic regression model was performed to assess independent predictors of frequent ED use (Table 3). Lower age, higher Quebec deprivation index (social and material), and a lower triage and acuity scale at the index visit were all independent predictors of recurrent ED visits. We also identified that the top three index visit diagnoses – asthma, infectious ear/nose/sinus disorders, and other respiratory disorders – were independently associated with a higher incidence of frequent ED visits within the year following the index visit. A negative binomial regression model was used to assess the impact of these variables on recurrent ED visits and yielded similar results.
Table 3 Relative risk of frequent ED use within one year of index visit

CI=confidence interval.
DISCUSSION
To our knowledge, this is the first Canadian study to look at characteristics of frequent PED users in a tertiary care institution. The large catchment area, the multicultural, and social diversity of our patient population as well as the urban setting of our institution are characteristics shared by many other PEDs across North America, and, although our study was single-centred, these similitudes render our findings interesting to these institutions. Moreover, ED crowding is being recognized as a global public health problem, affecting patients and hospital staff.Reference Boyle, Abel and Raut 23 The etiology of this problem is multifactorial and depends largely on health care system characteristics and services in place. Limited access to primary care, lack of continuity of care, and long delays in getting appointments are known risk factors for non-urgent emergency use.Reference Cabey, MacNeill and White 8 , Reference Brousseau, Bergholte and Gorelick 24 , Reference Christakis, Mell and Koepsell 25 In the province of Quebec, a study of adult patients revealed that accessibility, perception of need, familiarity, and trust in the department were the main reasons explaining why patients did not seek primary care prior to visiting the ED. In fact, only 20% of patients had been referred by their physician.Reference Afilalo, Marinovich and Afilalo 26 In the literature, the inappropriate use of ED has been shown to account for up to 40% of PED visits.Reference Benahmed, Laokri and Zhang 27
On the other hand, our results identify that children with a higher severity score on the index visit are more likely to re-present to the ED. This finding suggests that critically ill patients are more likely to appropriately use the PED more often.Reference Alpern, Clark and Alessandrini 7 Our study also agrees with earlier findings that young children are more frequent users. This population tends to be more high risk with admission rates in neonates reported as high as 38%.Reference Perry, Caviness and Allen 28 Such patient groups require emergent medical attention and appropriately use the ED more often. Indicators such as CTAS score at triage and hospital admissions are helpful in determining the “appropriateness” of an ED visit. The inability to include information on ED discharge disposition in our study population limits our ability to characterize the preventability of certain ED visits. Of note, a Canadian retrospective study on PED use in British Columbia reports that during a period where annual PED visits increased by 30%, visits triaged CTAS 1 and CTAS 3 remained constant (<10% increase), whereas CTAS 2 doubled, CTAS 4 increased by 30%, and CTAS 5 nearly quadrupled.Reference Quynh Doan 29
We identified that 4.7% of our population had five or more visits to the PED. This group of patients accounted for 16.6% of the total ED visits. This number, although significant, is lower than what has been published in the pediatric literature, where up to 72% of visits were accounted for by frequent users.Reference Alpern, Clark and Alessandrini 7 , Reference Cabey, MacNeill and White 8 , Reference Baquiran, Webber and Appel 30 , Reference Calado, Pereira and Santos 31 We suspect that the presence of two tertiary care hospitals within the city of Montreal is a major contributor to this low number. Certain diagnoses are associated with an increased emergency service use. We identified that asthma, infectious ear/nose/sinus disorders, and other respiratory disorders were independently associated with a higher incidence of recurrent visits within the year following the index visit. Non-infectious neurological disorders as well as gastrointestinal disorders other than gastroenteritis, respectively, account for the fourth and fifth most common primary diagnoses and predicted frequent PED use.
Asthmatic children are known to frequently visit the ED for exacerbations. Known contributing factors include poor compliance, insufficient knowledge of medical management, ineffective application of management action plan, and limited access to an asthma care provider.Reference Bartlett, Lukk and Butz 32 , Reference Lawson, Carroll and Gonzalez 33 Key interventions, such as preprinted order sheets and access to a pediatrician for consultation, have been shown effective in diminishing utilization of emergency services.Reference Guttmann, Zagorski and Austin 34 Our data did not reveal an increase use of services for the adolescent population, which has very different needs, including mental health and psychological care.Reference Brennan, Chan and Hsia 35 - Reference Mapelli and Doan 37
Multiple USA-based studies have shown that children who are publicly insured use the ED more frequently when compared with privately insured patients.Reference Alpern, Clark and Alessandrini 7 , Reference Boulet, Belanger and Lajoie 9 , Reference Adekoya 38 Despite that Quebec has a public health care system accessible to all, we found that children of lower socioeconomic status are more likely to be frequent ED users. This finding may suggest that other social determinants of health, beyond health insurance status, may lead to increased PED use.
LIMITATIONS
Our study has several strengths, as well as limitations. The data are entered in the SIURGE database in a prospective and systematic fashion for all patients cared for at the PED of the Montreal Children’s Hospital. This provides data for a large cohort of patients over time. However, these data are collected by various health care professionals (i.e., staff, fellows, residents, students, clerks), introducing the risk of heterogeneity and report bias. Moreover, we would ideally assess ED reliance, which is the ratio of ED visits to primary care provider visits. Unfortunately, the SIURGE database does not allow us to know whether a given patient has an identified primary care provider or the extent of visits at other health care facilities. Given that within the Montreal area, there are two tertiary pediatric care centres, we may underestimate the number of recurrent visits. We were also unable to assess for comorbidities because this was not recorded in the SIURGE database. Given our sample size and resources, it was not feasible to use alternative data sources such as electronic medical records or patient interviews. Nevertheless, we believe that this large scale characterization of the frequent users is a crucial step that will allow us to narrow future analyses and allow us to characterize further the smaller groups identified.
CONCLUSION
Evidence-based, innovative strategies are needed to minimize frequent PED use. This, in turn, could lead to improved health outcomes, optimized provision of both urgent and non-urgent care, and less potentially avoidable, high-cost ED encounters. Future studies evaluating interventions tailored for the frequent user population and optimization of outpatient ambulatory care services are needed to develop sustainable solutions.
Competing interests: None declared.
Financial support: Dr. Maryam Oskoui received an operating grant from the Research Institute of the McGill University Health Centre (no grant number).


