


1. Introduction
Cosmological N-body simulations are a powerful and well-established tool for studying theories of cosmic structure formation and for making predictions that can be compared directly to observations. By modelling the discretised dark matter density field, these N-body simulations solve for the dynamical evolution of dark matter particles under the influence of their mutual gravity and, in particular, track the formation and evolution of gravitationally bound condensations of dark matter known as halos. The currently favoured paradigm of galaxy formation predicts that galaxies form within these dark matter halos and that their subsequent evolution is shaped by the growth of their host halos (White & Frenk Reference White and Frenk1991). Consequently, quantifying accurately how halos assemble over cosmic time is a fundamental requirement of cosmological N-body simulations.
One of the key predictions that affect simulations of galaxy formation is the merging of halos and, consequently, the merging of galaxies. The timing of the merger and the dynamical evolution of the dark matter halo are important in determining galaxy properties, for example, stellar mass, galaxy colour, and morphology (Boylan-Kolchin,Ma & Quataert Reference Boylan-Kolchin, Ma and Quataert2008). In particular, the merging of halos and the galaxies contained within are intrinsically linked processes in semi-analytical models (SAMs; for review see Baugh Reference Baugh2006; Benson Reference Benson2010; Somerville & Davé Reference Somerville and Davé2015). SAMs populate dark matter halos in cosmological simulations by using analytical approximations to self-consistently model the evolution of galaxies through cosmic time. This enables them to efficiently simulate large volumes of interacting galaxies that are in turn hosted by dark matter halos (White & Frenk Reference White and Frenk1991; Lacey & Silk Reference Lacey and Silk1991; Cole Reference Cole1991). Because of the intrinsic coupling of galaxies and dark matter halos, the algorithms used to identify the halos and connect them across time are critically important. Desired characteristics are that they are robust (insensitive to small changes in the underlying simulation or parameter choices) and accurately track the halos across cosmic time through complex stages of halo interactions.
In essence, this means halos must be both recovered within individual simulation epochs and tracked (or linked) between different simulation epochs. These algorithms are, respectively, known as halo finders and tree builders. The two most common halo finder algorithms are the spherical overdensity (SO) method (Press & Schechter Reference Press and Schechter1974) and Friends-Of-Friends (FOF) method (Davis et al. Reference Davis, Efstathiou, Frenk and White1985). The former groups particles into halos by locating density peaks and growing a spherical volume until the mean enclosed density drops below a threshold value; the latter groups particles into halos by setting a linking length and connecting particles separated by a distance smaller than the linking length (Knebe et al. Reference Knebe2011).
Halos identified by halo finders are then connected across simulation outputs, known as snapshots, using a tree builder (e.g. Lacey & Cole Reference Lacey and Cole1993). Tree builders use a variety of properties to connect halos across snapshots, for example, the ID of the particles inside the halo, halo trajectories, and binding energies of the halos (see Srisawat et al. Reference Srisawat2013 for a discussion on these approaches). Together, the combination of the halo finder and tree builder allows us to build halo merger trees, which trace halos across snapshots and the capture merger and interactions between neighbouring halo(s) (Lacey & Cole Reference Lacey and Cole1993; Roukema et al. Reference Roukema, Peterson, Quinn and Rocca-Volmerange1997).
Ideally, halos should be traced until they completely merge with another halo or are tidally disrupted. However, this is not always the case, ultimately coming down to the ability of the halo finder to identify halos deep inside the dense environment of the host (parent) halo (see Avila et al. Reference Avila2014), and of the tree builder to link them across time, even when the halo is being disrupted (see Srisawat et al. Reference Srisawat2013). Therefore, objective comparisons of halo finders and tree builders ensure that they produce well-behaved merger trees.
Merger trees that are well behaved do not suffer from problems such as:
Flip-flopping: The tree builder mixes up links between two halos but corrects it in subsequent snapshot(s) (Behroozi et al. Reference Behroozi2015; Poole et al. Reference Poole, Mutch, Croton and Wyithe2017). This can lead to large change in the halo properties in the snapshots where it happens.
Branch swapping: This is similar to flip-flopping except the tree builder does not correct it and so the halos continue their independent evolution.
Truncation: The halo finder cannot find the halo for one or more snapshots which can lead to no good links being found so the halo is left unconnected (Srisawat et al. Reference Srisawat2013; Poole et al. Reference Poole, Mutch, Croton and Wyithe2017).
To add a further complication the desired characteristics of a merger tree are at least partially subjective, and there is no theoretical approach that trivially predicts exact trees to calibrate against.
Typically, comparisons of halo finders are done by analysing how they perform in certain, pathological, situations, such as multiple halo merger events; or how well they recover global summary statistics, for example, halo and subhalo mass functions (Knebe et al. Reference Knebe2011; Onions et al. 2012, Reference Onions2013; Knebe et al. Reference Knebe2013; Elahi et al. Reference Elahi2013); or how well a particular class of major merger is tracked (Behroozi et al. Reference Behroozi2015). Tree builder comparisons are more challenging and are typically done by considering global performance statistics, for example, the degree of mass fluctuations present in the merger tree (the number of large changes in halo mass across snapshots) (Srisawat et al. Reference Srisawat2013), or the length of the tree (how long halos have existed for in the simulation) (Avila et al. Reference Avila2014; Wang et al. Reference Wang2016). Although useful, they do not easily reveal what is physically happening in the simulation and, more importantly, what the dynamics of the systems look like. Also, it is often unclear what a desirable metric is, that is, neither the longest nor shortest trees are likely to be the preferred outcome. More broadly, previous comparisons have had low information density. Orbital properties, for example, can be easily overlooked when examining a particular merger event or the overall statistics of the halos. This motivates the need for a new analysis tool, and we focus on a novel visualisation method to capture the evolution of halos, their growth, interactions, and tidal disruption.
In this work, we present the merger tree dendrograms, a novel visualisation tool that captures the evolution of a halo across the full simulation. These dendrograms intuitively present any interactions or tidal disruption halos have experienced, in addition to interacting halo orbits and the distance at which a merger occurs. These dendrograms can be used not only as a diagnostic tool for halo finders and tree builders but also for comparison projects between different codes. Pathological problems are very easy to uncover, and the high information density guides the user towards potential causes and remedies.
Using dendrograms, we have been able to identify problematic events that caused serious artifacts in the halo finder VELOCIraptor (Elahi, Thacker & Widrow Reference Elahi, Thacker and Widrow2011; Elahi et al. Reference Elahi, Welker, Power, Lagos, Robotham, Canas and Poulton2018; Cañas et al. Reference Cañas, Elahi, Welker, Lagos, Power, Dubois and Pichon2018; Elahi, in preparation) and its corresponding tree builder TreeFrog (Srisawat et al. Reference Srisawat2013; Elahi, in preparation) merger trees, which could not be detected using more traditional quality metrics. Their detection utilising the dendrograms has guided us towards significant improvements in the codes and the resultant merger trees which are now being used to run SAMs on our suite of N-body simulations (SURFS; Elahi et al. Reference Elahi, Welker, Power, Lagos, Robotham, Canas and Poulton2018).
The structure of this paper is as follows. In Section 2, we specify the terminology that will be used. Section 3 describes the input halo catalogues that we use. In Section 4, we describe the merger tree dendrograms, what information they provide, and how they have been useful. For completeness, we also show merger density plots in Section 5 showing how overall statistics can highlight a problem but not suggest a solution. Finally in Section 6, we discuss and summarise the usability of these plots and highlight their usefulness in comparison projects.
2. Terminology
For clarity, the following terminology will be used in this paper. A visual representation is shown in Figure 1.
Halo: The condensation of dark matter returned by a halo finder.
Subhalo: A halo which is not at the top of its spatial hierarchy (lies within one or more halos). For clarity, only subhalos of the main branch are shown in the dendrograms.
Descendant: The (sub)halo that the tree builder has determined in the next snapshot(s) that the current (sub)halo goes into. Typically tree builders do not allow fragmentation so a halo can only have one descendant.
Progenitor: The (sub)halo in the previous snapshot that a (sub)halo at the current snapshot has come from, as determined by the tree builder.
End/Root Descendant: The last/root (sub)halo which the tree builder has determined the (sub)halo at the current snapshot has ended up within the simulation.
Start/Leaf Progenitor: The first/leaf (sub)halo which the tree builder has determined the (sub)halo at the current snapshot has started within the simulation.
Main Progenitor: The (sub)halo which the tree builder has determined to be the main (sub)halo that the (sub)halo has come from in the previous snapshot and share the same Start/Leaf Progenitor. The identification of the Main Progenitor is dependent on the tree builder used (and its configuration); therefore, it can be ambiguous.
Branch: The halos that are connected across snapshot which share a unique Start/Leaf Progenitor.
Main branch: This is the branch of the merger tree that contains the main progenitors for the halo in the final snapshot across cosmic history, used to build the merger tree. The evolutionary history of a main branch can be dependent on the tree builder used (and its configuration), particularly in branches with multiple mergers. These halos are connected by the green line in Figure 1.
Merged branch: These are branches which share the same End/Root Descendant as the main branch but have a different Start/Leaf Progenitor, indicating they have merged with the main branch at some point along the main branches history (travelling from Start/Leaf Progenitor to End/Root Descendant). These are the halos connected with purple line in Figure 1.
Merged branch depth: The depth indicates the number of times when walking a branch forward in time (from Leaf/Start Progenitor to End/Root Descendant) that a branch ‘merges’ with another branch, that is, instances where a halo points to a descendant that does not point back to its Start/Leaf Progenitor.
Interacting branch: Branches that do not share the main branch’s End/Root Descendant but become a subhalo of the main branch for at least one snapshot. These are halos that are connected by the yellow line in Figure 1.
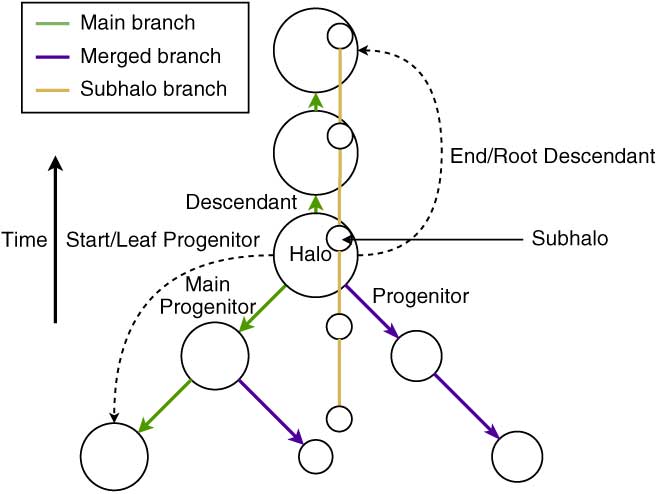
Figure 1. This is a representation of the terminology used in this paper. This figure shows an example of main branch, subhalo branch, and two merged branches of depth 1.
3. Input catalogues
This work uses data from Synthetic UniveRses For Surveys (SURFS), a suite of N-body/Hydrodynamical simulations (Elahi et al. Reference Elahi, Welker, Power, Lagos, Robotham, Canas and Poulton2018), spanning ranges of cosmological volumes to address both galaxy formation and cosmological surveys. The simulations assume a ΛCDM universe and use Planck cosmological parameters (Planck Collaboration 2015). All simulations are run with a memory-lean version of the gadget2 code with a range of box sizes from 40 to 900 Mpc/h, containing up to 10 billion particles. Here we focus on a small volume, moderate resolution simulation: a 40 Mpc/h box with 5123 particles. For more details see (Elahi et al. Reference Elahi, Welker, Power, Lagos, Robotham, Canas and Poulton2018).
The halo merger trees are built with three different halo finders—AHF (Gill, Knebe & Gibson Reference Gill, Knebe and Gibson2004; Knollmann & Knebe Reference Knollmann and Knebe2009), Rockstar (Behroozi, Wechsler & Wu Reference Behroozi, Wechsler and Wu2013a), and VELOCIraptor (Elahi et al. 2011, Reference Elahi, Welker, Power, Lagos, Robotham, Canas and Poulton2018; Cañas et al. Reference Cañas, Elahi, Welker, Lagos, Power, Dubois and Pichon2018; Elahi, in preparation)—along with their respective tree builders—MergerTree, Consistent Trees (Behroozi et al. Reference Behroozi, Wechsler, Wu, Busha, Klypin and Primack2013b), and TreeFrog (Srisawat et al. Reference Srisawat2013; Elahi, in preparation)—to link halos across snapshots.
We test two types of halo finders—configuration space and phase space halo finders. Configuration space halo finders generally use either density or position information to find halos; this enables them to easily pick out halos, but they have difficulty identifying substructure. Phase space halo finders use both position and velocity information to identify substructure; the extra information enables a much more robust identification of subhalos.
All of the treebuilders used here are particle correlators, which use particles bound to halos to link them across snapshots, effectively identifying all possible connections for every halo. They then maximise a merit function(s) to find a single descendant and main progenitor [for further details see (Srisawat et al. Reference Srisawat2013)]. Both Consistent Trees and TreeFrog have corrections to account for missing halos, which are discussed in the following sections.
3.1. AHF and MergerTree
AHF first finds local overdensities in an adaptively smoothed density field to find possible halo centres. Then particles that are gravitationally bound to density peaks are identified to construct the halo (Knollmann & Knebe Reference Knollmann and Knebe2009). MergerTree is a particle correlator, as discussed previously. MergerTree only identifies connections one snapshot in the past and by default will give a graph, but a merit can be used to create a MergerTree.
3.2. Rockstar and Consistent Trees
Rockstar is a phase-space halo finder that uses an adaptive hierarchical refinement of six Dimensional Friends-Of-Friends (6DFOF) and one time dimension, which enables explicit tracking of merged structure. Its tree builder, Consistent Trees, corrects for missing halos by using halo trajectories from gravitationally evolving positions and velocities of halos between time steps. By making use of information from surrounding snapshots, it can correct for missing or extraneous halos (Behroozi et al. Reference Behroozi, Wechsler, Wu, Busha, Klypin and Primack2013b). This is required in the case when Rockstar can no longer find the subhalo because it is too close to its host’s centre, but it is not fully merged so correction is needed to allow the subhalo to merge.
3.3. VELOCIraptor and TREEFROG
VELOCIraptor is a 6DFOF halo finder that first uses the 3DFOF algorithm to identify halos and then identifies substructure using the full 6DFOF information to robustly identify not only subhalos but also tidal streams from disrupted halos (Elahi et al. Reference Elahi2013). Its tree builder TreeFrog has the additional capability to link halos over more than one snapshot, which enables a halo to be linked even if it is not found by the halo finder in one or more snapshots away (Srisawat et al. Reference Srisawat2013; Elahi, in preparation). After testing, the linking is set to connect up halos over four snapshots in both the old and new VELOCIraptor and TreeFrog catalogues.
3.4. Mass definitions
Different halo finders use different definitions for virial mass (M vir). AHF uses M 200,crit (mass contained within the region with  $\bar{\rho} = 200 \rho_{\textrm{crit}}$); VELOCIraptor uses all of the definitions of M vir, so we select M 200,crit; Rockstar uses the definition from Bryan & Norman (Reference Bryan and Norman1998), which corresponds to M 360,crit (mass contained within the region with $\bar{\rho} = 360 \rho_{\textrm{crit}}$) times the background density at z = 0. A visual representation of the differences as they change with halos concentration is shown in Figure 2, which demonstrates that the two definitions vary by only 10–20% depending on the concentration. All masses in this paper will be inclusive, so they include the mass of any subhalo that lies within the halo’s virial radius (R vir, the radius containing M vir); see Appendix C for an example of a merger tree with exclusive masses.
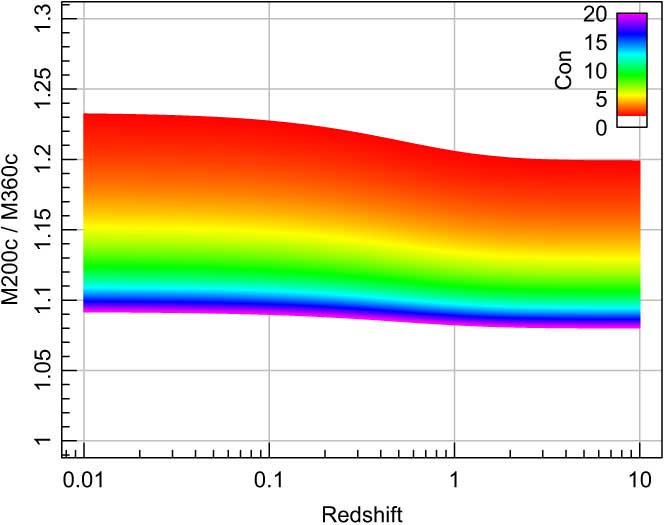
Figure 2. Visual representation of how the different definitions of M vir change as a function of redshift and the halos concentration.
4. Merger Tree Dendrograms
The traditional way of showing merger trees is shown in Figure 3 (see Roukema et al. Reference Roukema, Peterson, Quinn and Rocca-Volmerange1997). This diagram only shows the rough merger history of a single halo in the final snapshot and does not convey the mass evolution, a critical piece of information. A common improvement is the addition of the halo masses in the tree (see, e.g. De Lucia & Blaizot Reference De Lucia and Blaizot2007; Tweed et al. Reference Tweed, Devriendt, Blaizot, Colombi and Slyz2009; Hirschmann et al. Reference Hirschmann, Naab, Ostriker, Forbes, Duc, DavÃl’, Oser and Karabal2015;McAlpine et al. Reference McAlpine2016; Naab & Ostriker Reference Naab and Ostriker2017). However, it is not possible to extract further information, for example, the separation the merger occurred at, or the orbit of the merging halo.
Figure 3. An example of how merger trees are typically represented. This plot shows the merger history for a single halo in the final snapshot, showing the main branch (the halos directly beneath it) and the merging branches. However, it does not give an insight of how the halos are interacting or how far away a merger happens.
For this reason, we propose the merger tree dendrogram, which contains the entire merger history of a single halo, including any halo it has ever interacted with across cosmic history. The plot contains information on:
Interaction and merger history: The standard merger history of a single halo in the final snapshot (known as the main branch), and other halos it merged or interacted with and their respective merger history (known as merged branches).
Evolution of mass (or other quantities such as V max): The mass evolution of the main and merged branches throughout the simulation.
Orbits: The orbits of merged branches and subhalos around the main branch.
Lifetimes: How long a (sub)halo exists before it merges.
Radial distance: How far away the merged branches merge with the main branch.
A pedagogical example of the information content is presented in Figure 4, which shows how the main branch can interact with its merged/subhalo branches. The left subpanel of each panel shows a projection of the halos in the simulation, while the right subpanel shows the corresponding dendrogram. We show different scenarios from a flyby (leftmost) to a merger event (rightmost). This shows how the dendrograms can simplify 3D orbits into a 1D plot.
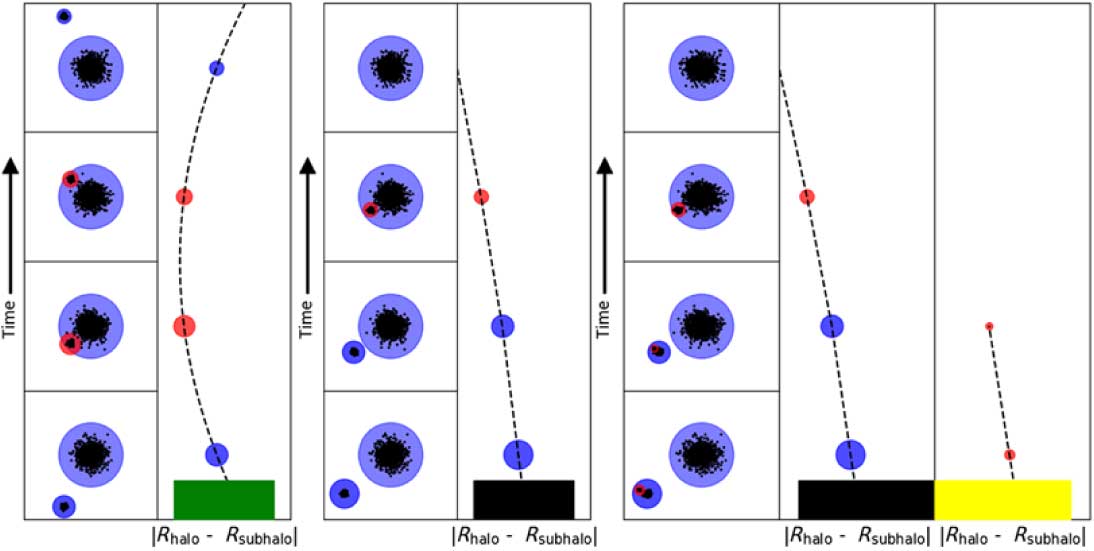
Figure 4. This diagram shows how the right subpanels condense the orbits and interactions of halos presented in the left subpanels. The black points are the halo particles, while the blue and red circles correspond to halos and subhalos, respectively, with the size of the circle representing the mass of the (sub)halo at each time step. The dashed black line shows a quadratic (left panel) and linear (middle and right panel) splines of the halo position, demonstrating the path that the halo would most likely take. Here we show from left to right: a fly-by (shown by the green block); single merger event (shown by the black block); and multi-merger event with a small (merged branch of depth 2) halo merging with a larger halo (shown by the yellow block connected with the black block).
An example dendrogram tracing the full interaction history of a halo from a full cosmological simulation is shown in Figure 5. Its history is reconstructed using an older version of VELOCIraptor + TreeFrog halo catalogue from the 40 Mpc/h, 5123 particles SURFS simulation (Elahi et al. Reference Elahi, Welker, Power, Lagos, Robotham, Canas and Poulton2018).
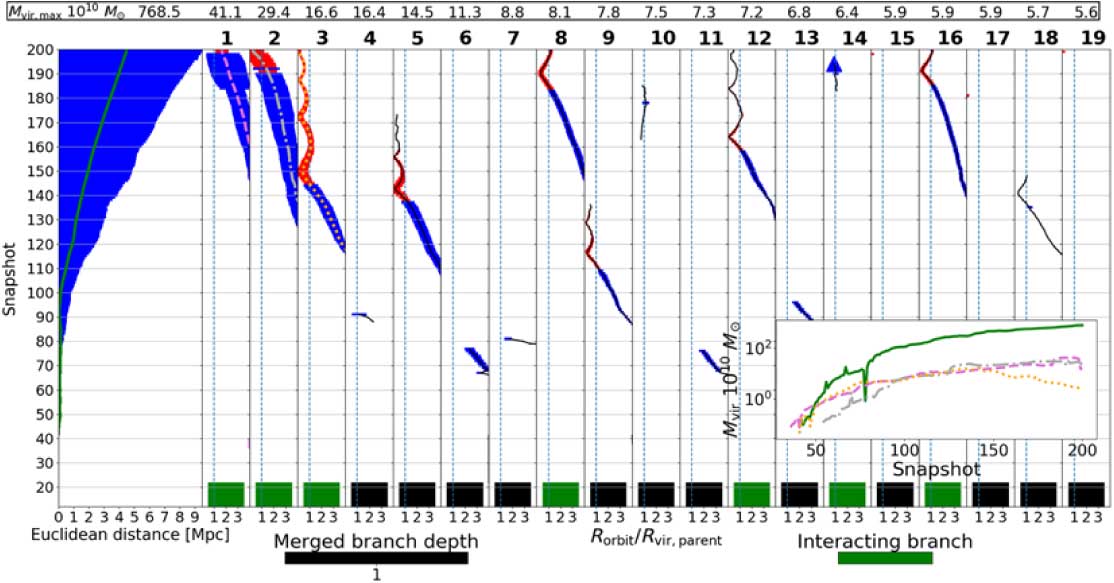
Figure 5. An example merger tree dendrogram from the old VELOCIraptor + TreeFrog catalogue, here on referred to as HALO1. The Euclidean distance shown for the main panel shows the comoving distance it has travelled with reference to its formation position. The inset plot in the figure shows the mass history for the four largest branches, which are represented by the different coloured lines/line styles in the branch. The blue and red points correspond to halos and subhalos, respectively. The triangle shows that this branch has become a subhalo of the branch of interest for at least one snapshot, but then has merged with another branch. In this case it has merged with branch 2 shown in this plot.
The dendrogram traces the full interaction and merger history of a single halo in the final snapshot. This plot only shows a merged branch depth of 1, as displayed by the ‘Merged branch depth’ indicator. The left-most panel shows the evolution of the main branch and the panels on the right show interacting or merged branches. The size of the line by default represents M vir at each snapshot, and the colour represents the type of halo: blue for a halo at the top of the spatial hierarchy (i.e. the central halo) or red for a subhalo. The y-axis shows the snapshot number in the simulation. For the left-most panel, the x-axis shows the Euclidean co-moving distance that the main branch halo has moved in the simulation and for the rest of the panels on the right, the x-axis shows the ratio of the radial distance to the main branch (R orbit) to the virial radius of the main branch (R vir,parent). The colour of the bar at the bottom indicates if it is a merged branch (black), if it has submerged branch (yellow), or a subhalo branch (green). The dashed line in the panels represents one R vir,parent and the panels are plotted up to 2.5 R vir,parent. The number on top of each of the panels is the maximum M vir within each branch in 1010 M⊙. Many intuitive characteristics jump out from this high information density plot. For example, as you might expect, most halos (blue) become subhalos (red) very close to the virial radius of the parent halo they merge into (dashed line). Also, the parent halo (left blue) increases in mass fairly monotonically, whilst subhalos (red) decrease in mass fairly monotonically due to dynamical friction within the R vir,parent.
The dendrogram code is written in Python 3 and is able to read a variety of halo merger tree catalogue formats. The code (Appendix A) requires that trees are in efficient tree format (ETF), which is a reduced version of the SUSSING MERGER TREE format (Thomas et al. Reference Thomas2015), and so a conversion tool has to be built to convert the data into this formatFootnote a. Conversion tools already exist for VELOCIraptor + TreeFrog (Elahi et al. Reference Elahi2013, Reference Elahi, Thacker and Widrow2011); AHF + MergerTree (Knollmann & Knebe Reference Knollmann and Knebe2009); Millennium (Springel et al. Reference Springel2005); and Rockstar + Consistent Trees (Behroozi et al. Reference Behroozi, Wechsler and Wu2013a, Reference Behroozi, Wechsler, Wu, Busha, Klypin and Primack2013b). The code also accepts the SUSSING MERGER TREE format (Thomas et al. Reference Thomas2015). Details of the code are in Appendix A and the ETF is in Appendix B.
4.1. As a diagnostic tool
The dendrogram allows for a visual inspection of the orbital and mass accretion histories of halos, providing an insight into the interaction history of the main branch with its merged/subhalo branches. It can be used to identify the problems occurring due to the particular code used, in addition to the frequency of the problems occurring. It has been useful in identifying problems with the old version of VELOCIraptor and TreeFrog which include:
1. The merging of halos with their host well outside of the host R vir,parent.
2. The identification of the incorrect Main Progenitor/Descendant, causing an abrupt change in the M vir of the halo.
3. The halo not being identified by VELOCIraptor, leaving a break in the existence of the halo.
The identified problems can be seen in the dendrogram in Figure 5. The key problem is that some merged branches do not become a subhalo before merging since they are well outside of their R vir,parent (see branches 4, 6, 7, 11, and 13), and so they suffer from the first and third problems identified previously. This is most likely an issue with either VELOCIraptor being unable to identify the halo or TreeFrog not connecting the halos up across snapshot. The ‘over-merging’ problem occurs during some major mergers but it is not immediately evident if one focuses on the statistical median and scatter of the halo occupation.
Furthermore from the inset plot in Figure 5, the main branch (green line) shows a large change in mass in snapshot 80. This large change in mass occurs because of a merger of comparable masses that happens at that snapshot, which makes it difficult to reconstruct the halo’s mass. This can be traced to the old version of VELOCIraptor struggling in such cases. Moreover there are halos that have a short existence in branches 10, 14, 15, 17, and 19, indicating that either VELOCIraptor cannot accurately reconstruct these halos histories or TreeFrog is having issues in connecting up these halos.
Upon identification of these problems, modifications were made to the VELOCIraptor and TreeFrog algorithms. These changes have improved the halo tracking in merger events, improving the reconstructed orbital evolution of subhalos. These improvements also enable a detailed study on the dynamical friction timescales for the merging halo, which will be left for a future paper (Poulton, in preparation). The detailed discussion of the optimisations/improvements has been left for a future paper (Elahi, in preparation; Elahi, in preparation).
Figure 6 shows an example of the same merger tree as shown in Figure 5 after the optimisations have been implemented. Panels in Figure 6 have a different ordering to those in Figure 5, which is due to VELOCIraptor’s improved ability to pick out substructure in the updated version and its subhalo classification. This leads to reduced masses being assigned to the main branch in Figure 6 because it is not assigning the subhalo’s mass to the host’s overdense region.
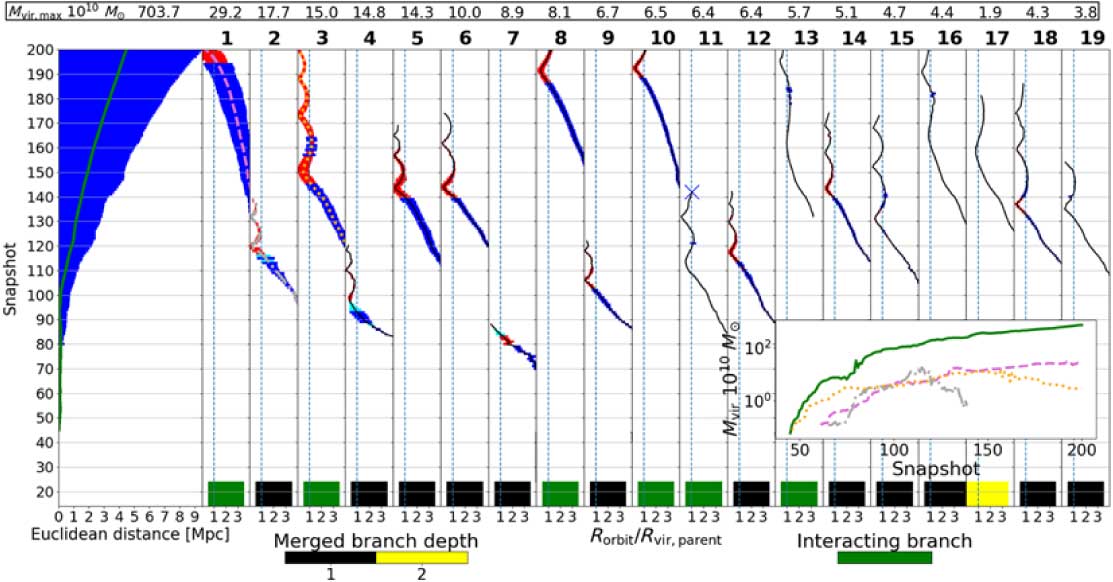
Figure 6. HALO1 merger tree reconstructed by the updated VELOCIraptor + TreeFrog + WhereWolf catalogue. The cyan points are the WhereWolf halos that are inserted into the catalogue. For clarity, the branches with a merged branch depth of 2 are only shown if they exist 80 snapshots before they merge with a merged branch depth of 1.
The cyan lines in Figure 6 show the corrections made based on a code under development known as WhereWolf (Poulton, in preparation). This code was developed because TreeFrog’s ability to link up halos across snapshots is limited, even with optimised merit schemes, and this can leave gaps in halo evolution. WhereWolf fills those gaps by tracking halo particles from the snapshot in which the halo was lost. WhereWolf performs a bound calculation and uses the most bound particles to define the position in the next snapshot; it also tracks a halo until it is dispersed or until a match to a VELOCIraptor halo that was previously unlinked is found (shown in the fourth and seventh branches on Figure 6). This enables a further tracking of the subhalos even when VELOCIraptor can no longer find them. A detailed description of the code will be available in Poulton (in preparation).
Compared to the inset plot in Figure 6, the main branch has a much smoother mass accretion history in the inset plot in Figure 5. The large mass loss in Figure 5 at snapshot 80 has become an increase in mass in Figure 6. This happens because the updated VELOCIraptor can recover both of the halos and also includes the mass of other merging subhalos not present on this plot.
These dendrograms show that most of the problems listed above have been addressed. However in Figure 6, the 13th, 16th, and 19th branches undergo a large change in mass. This is a result of the halo changing from a subhalo to halo. A subhalo mass is exclusive, but as a halo its mass is inclusive (includes the mass of its own subhalos). This is the same case as in Figure 5 in the 10th and 18th branches where it undergoes a large change in mass and does not affect the mass exclusive to the halo.
4.2. As a comparison tool
4.2.1. Tree with a simple merger history
To compare different code families, we create dendrograms using both AHF and Rockstar merger trees, following the same halo shown in Figures 5 and 6 so that a direct comparison can be made with VELOCIraptor merger tree.
An example of a Rockstar merger tree is shown in Figure 7. Rockstar does a good job of tracking that halo, showing similar halo evolution to the one seen in results from the updated VELOCIraptor + TreeFrog dendrogram. In snapshot 49, the main branch is temporarily hosted by a merged branch, as indicated by the circle at the bottom of the panel. This occurs because as the main branch undergoes a rapid loss in mass Rockstar cannot reconstruct the mass of the halo for this snapshot because of the similar mass merger happening with few particles. The main branch halo grows in mass again in snapshots 50 and 51, causing the merged branch to be well within R vir,parent at snapshot 51. Note that the third branch, at snapshot 90, also undergoes a large growth in mass which is lost in the next snapshot. The inset plot of Figure 7 shows this sudden growth. This happens just as the halo is moving outward, indicating that it has included some of the mass of the main branch’s halo.
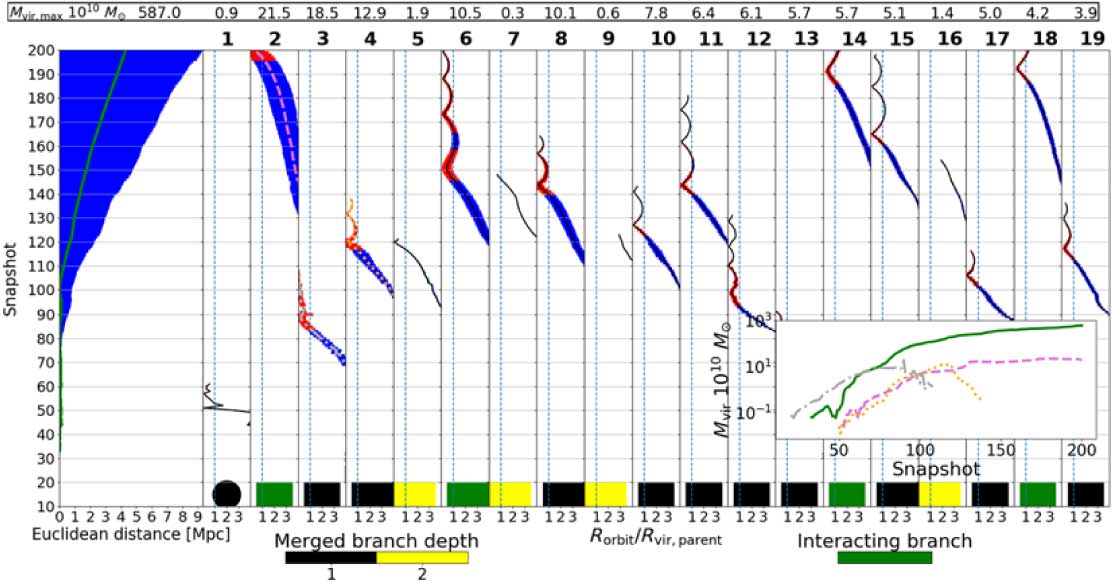
Figure 7. HALO1 merger tree reconstructed by Rockstar + Consistent Trees. The circle at the bottom of the first merged branch shows that this branch temporally hosted the main branch for at least one snapshot.
The AHF + MergerTree dendrogram in Figure 8 shows a smoother mass evolution of the main branch than the dendrograms produced by VELOCIraptor and Rockstar. However, subhalos shrink as they move inward and then grow again as they move outward, a known artifact of configuration space halo finders (Muldrew et al. Reference Muldrew2012). A further issue shown in this dendrogram is that branches 3, 7, 15, and 17 have no connection to infalling halos and first appear inside the halo. These seem to be halos from branches 2, 4, 8, and 13, respectively, that have gone through pericentric passage; AHF, being a configuration space halo finder, can no longer pick them out from the background distribution and so they are lost for a few snapshots. Because MergerTree can only link halos one snapshot apart, (sub)halos that are not identified by the halo finder for more than two snapshots will not be linked and so two separate branches are created. This can lead to problems within SAMs; the halo will be assumed to have merged—and hence, so do the galaxies hosted by the halo with the timing of the galaxy merger dependent on the SAM—even though the halo have yet to merge with the host halo. The SAM would then incorrectly assume that another halo has formed, which it may populate with a new galaxy, and this can have a large effect on the central galaxy it was going to merge with. This is a well-known shortcoming of configuration space halo finders (see Knebe et al. Reference Knebe2011; Onions et al. Reference Onions2012; Knebe et al. Reference Knebe2013; Cautun et al. Reference Cautun, Hellwing, van de Weygaert, Frenk, Jones and Sawala2014; Poole et al. Reference Poole, Mutch, Croton and Wyithe2017; Elahi et al. Reference Elahi, Welker, Power, Lagos, Robotham, Canas and Poulton2018).
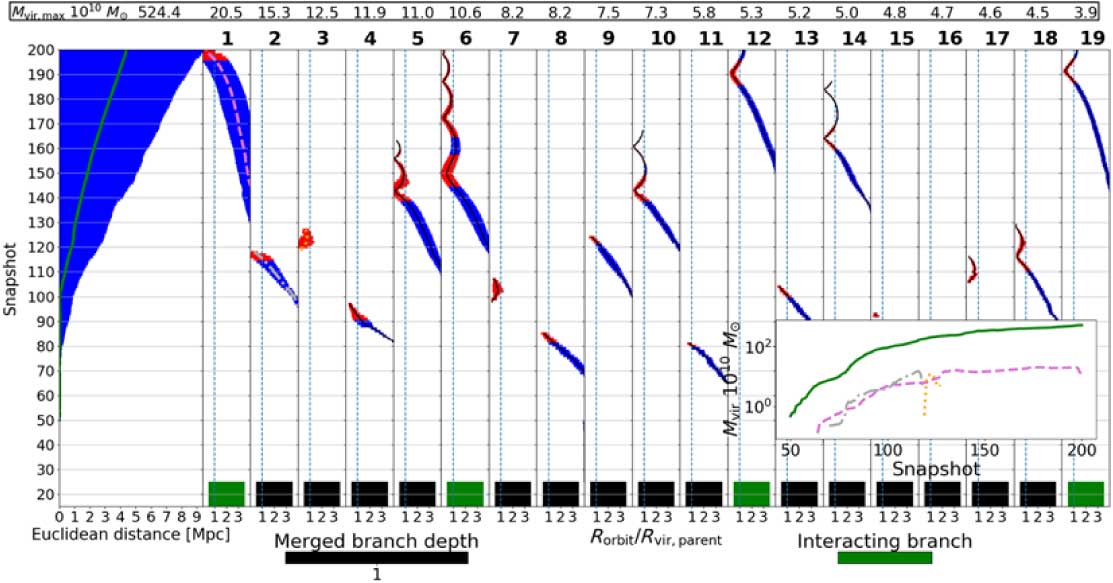
Figure 8. HALO1 merger tree reconstructed by AHF +MergerTree.
4.2.2. Tree with a violent merger history
We now test how different halo finders + tree builders perform in the challenging case of a quadruple merger event, which we refer as QUAD1. This is shown in Figure 9, where we see several halos with similar masses merge in a short period of time. During this event, it is difficult, both objectively or subjectively, to determine the particles belonging to each halo.
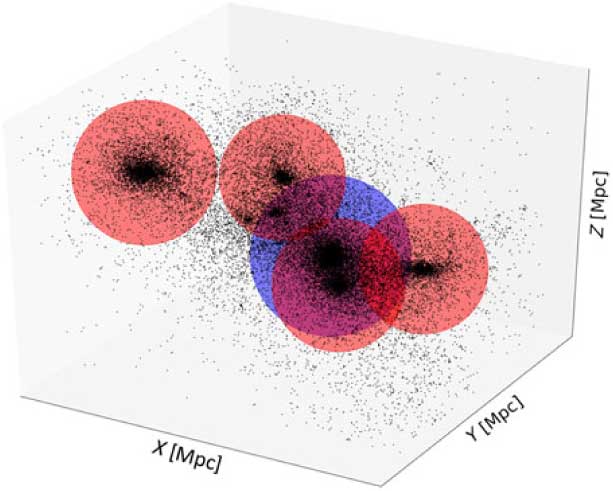
Figure 9. This 3D plot shows the event of a quadruple merger (QUAD1). Only the five largest halos from VELOCIraptor are shown in this plot at snapshot 190 in the simulation. The blue halo represents the halo from main branch and the red ones are the halos from the subhalo branches associated with the main branch.
The dendrogram for QUAD1 constructed using the older version of VELOCIraptor is shown in Figure 10. Here it is clear that the old VELOCIraptor has problems tracking merging halos because they never become subhalos, instead disappearing (i.e. merging) well outside R vir,parent. The early merging of halos is the same problem identified in Figure 5, indicating that it is a recurring problem with the old VELOCIraptor. When early merging happens, the main branch does not have the mass of the ‘merged’ branch associated with it because the merger happens outside R vir,parent. The main branch in Figure 10 also undergoes a large change in mass from snapshots 192–200, which is caused by VELOCIraptor associating the mass of the merging branches with itself. This seems to be due to the halos lying within the same overdensity envelope. However, a few snapshots later this connection are broken which causes the rapid decrease in mass. Branch 18 also undergoes a large increase in mass, suggesting that these halos may be the incorrectly connected halos from branch 6. In addition, branches 14 and 17 have no connection to infalling halos, which is the same in Figure 5, further indicating that there is a recurring problem with TreeFrog in connecting up the halo correctly. These seem to be the halos from branches 1 and 11, respectively. Finally, the eighth branch is connected up to the wrong halo—as shown by the large change in its mass as shown in the inset plot—demonstrating that this is a problem caused by TreeFrog identifying the incorrect progenitor/descendant, which is the second problem discussed in Section 4.1.
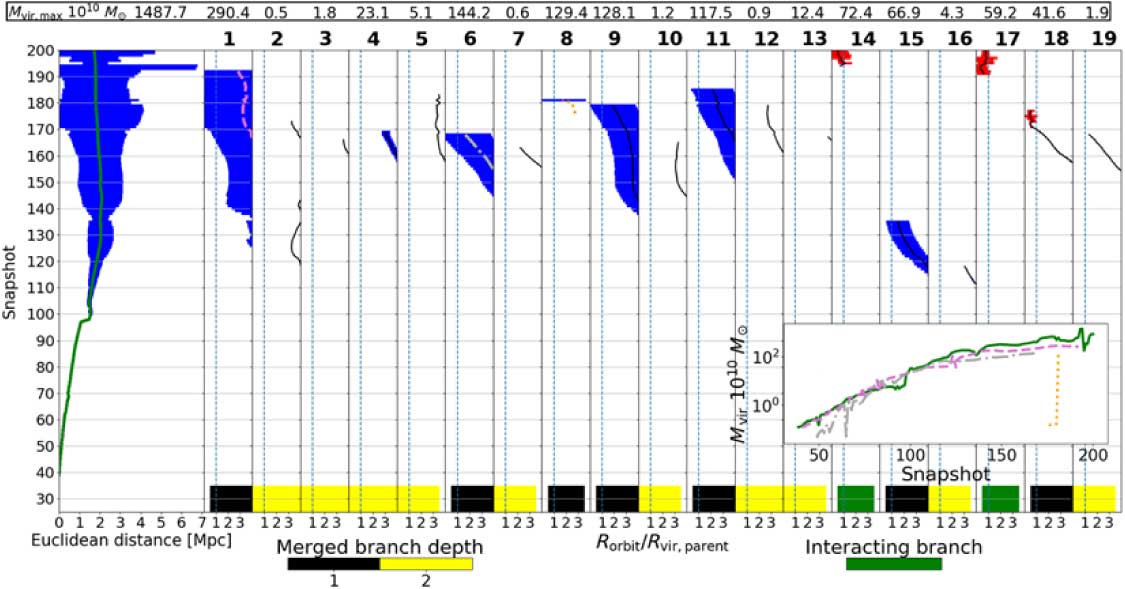
Figure 10. QUAD1 merger tree from the old VELOCIraptor + TreeFrog catalogue.
For comparison, the updated VELOCIraptor + TreeFrog along with WhereWolf is shown in Figure 11. It can be seen that the main branch fluctuates in mass. The fluctuation is caused by the mass being inclusive and the halo’s mass swaps from being a halo to being a subhalo (see Appendix C for the dendrogram with just exclusive masses and also before WhereWolf has been run on the catalogue). The mass fluctuation happens just as the third branch passes within R vir,parent, and so its mass is associated with the main branch. Similarly, the large decrease of mass at snapshot 195 happens just as the third branch moves out of R vir,parent, and so its mass is not associated with the main branch. In the next snapshot, the fifth branch then passes within R vir,parent, and so its mass gets associated with the main branch leading to the large increase in mass in snapshots 196–200.
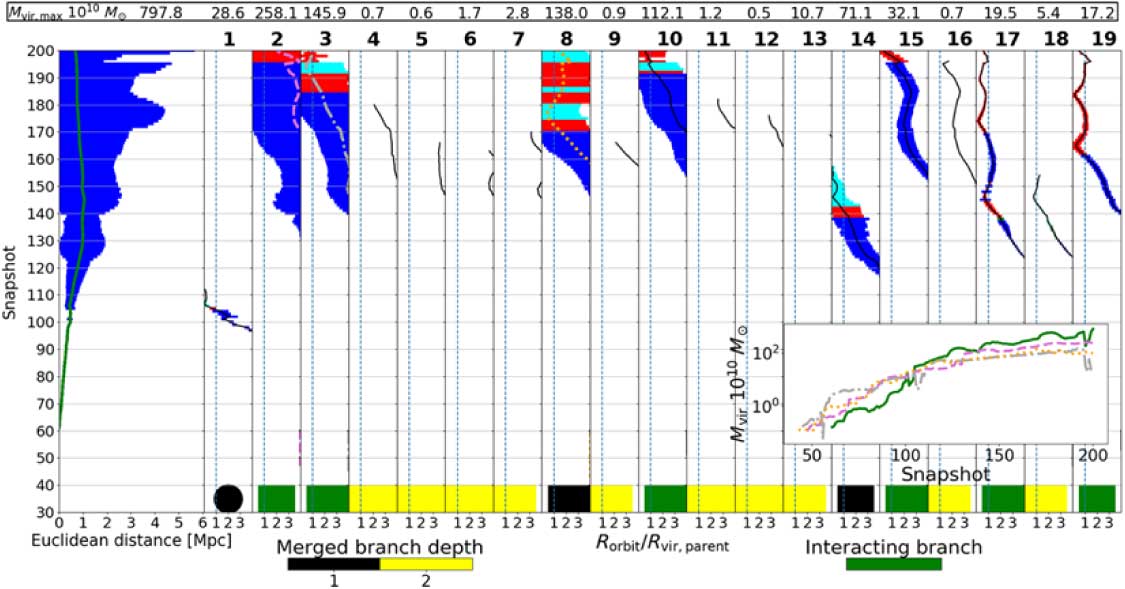
Figure 11. QUAD1 merger tree from the updated VELOCIraptor + TreeFrog + WhereWolf catalogue.
Compared to the old VELOCIraptor, the updated VELOCIraptor + TreeFrog along with WhereWolf tracks halos well, but there are some large fluctuations in mass in the 3rd and 10th branches even when the halo is a subhalo (so its mass will be exclusive). This large fluctuation in mass arises because it is ambiguous as to which (sub)halo particles should be assigned to.
Comparison of Figures 10 and 11 shows that most of the issues with the old VELOCIraptor have been addressed with the updates to VELOCIraptor and TreeFrog, and the implementation of WhereWolf. WhereWolf tracks halos until they completely merge with the main branch; this means that halos do not suddenly disappear because VELOCIraptor cannot find them. However, some branches do suffer from rapid changes in mass, even when the branch is a subhalo; this is because of the difficulty of tracking the systems during the multiple massive merger events.
The dendrogram for QUAD1 from the Rockstar and Consistent Trees catalogue is shown in Figure 12. The major merging branches have been tracked well and undergo smooth evolution as shown in the inset plot.
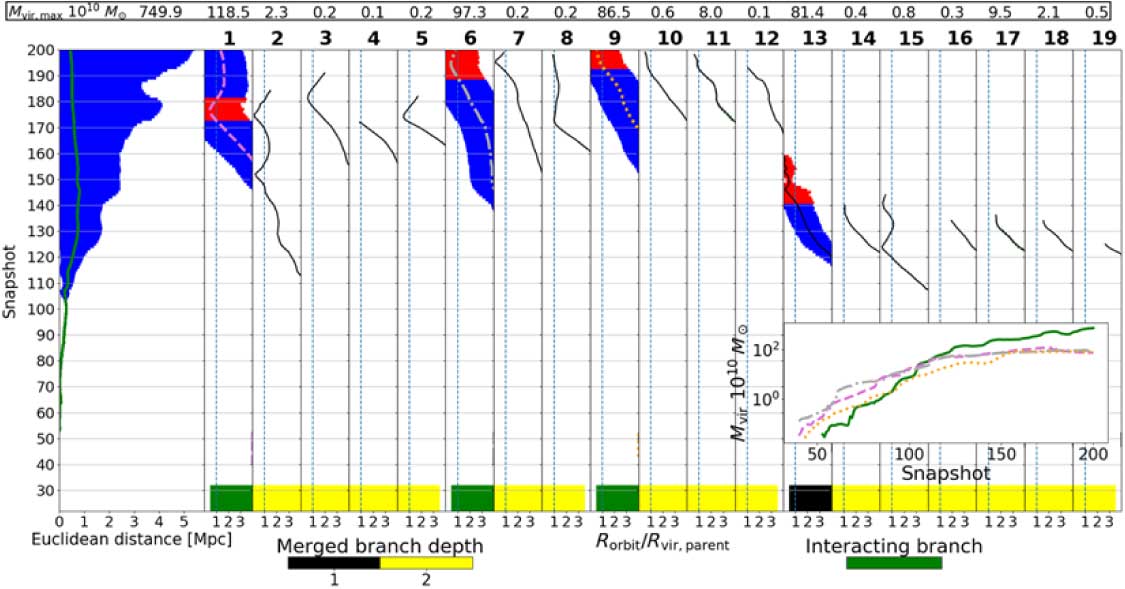
Figure 12. QUAD1 merger tree from Rockstar and Consistent Trees.
However, the Rockstar and Consistent Trees algorithm is still not perfect. The 12th branch in Figure 12 does fluctuate in mass as it comes into merge, suggesting that Rockstar is unbinding the particles too quickly. Particles that are not completely unbound become bound again, causing the growth of the halo after snapshot 150. The halo could also be picking up some of the loosely bound main branch halo’s particles; this is what seems to happen in the third branch of Figure 7. This can lead to problems in a SAM where the galaxy inside these halos grows due to the growth of their host dark matter halo; however, because the dark matter mass of the system remains the same, it leads to an increase in the baryon mass, potentially increasing it above the cosmic baryon fraction.
The dendrogram constructed from AHF + MergerTree is shown in Figure 13. Overall AHF manages to capture the evolution of the large branches coming into merge, where the large change in M vir,parent corresponds to one of the large branches passing within R vir,parent. Nonetheless from the figure it is clear that branches 7 and 8 suffer from the same problem identified in Figure 8, where halos that are lost in pericentric passage are found again when it starts to exit the halo.
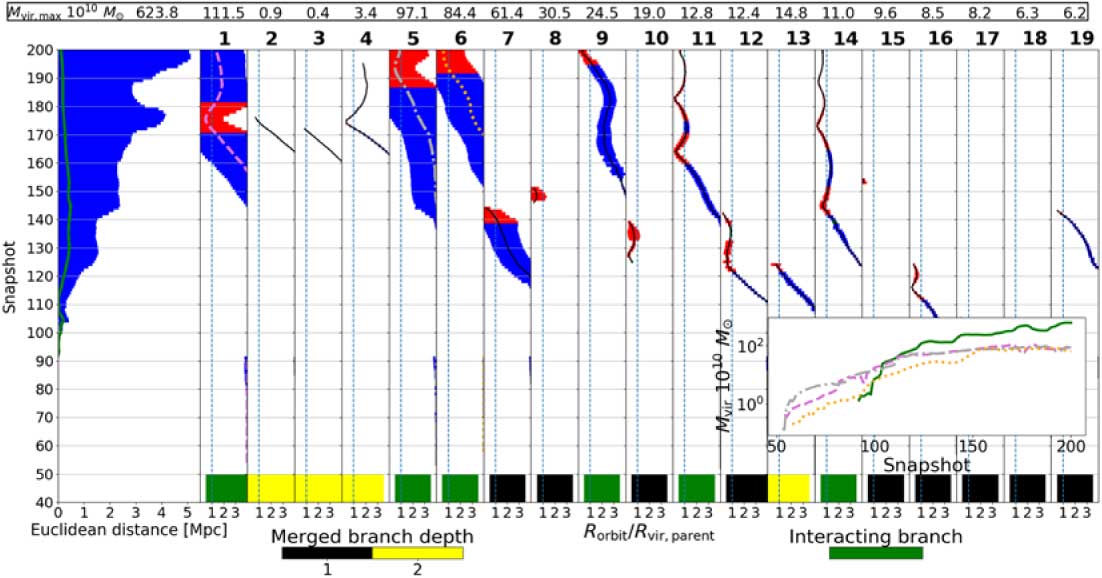
Figure 13. QUAD1 merger tree from the AHF and MergerTree catalogue.
Moreover, branch 10 in Figure 13 seems to be a continuation of branch 13, but it is connected to the wrong halo. This happens because the large increase in mass in branch 13 at snapshot 124 means it has a poor link with the lower mass halo in branch 10 at the next snapshot. Furthermore, there is a large exchange of mass between branches 10 and 12, where branch 10 hosts the branch 12 temporarily before they merge.
5. Merger density plots
Another novel way of comparing global merger tree properties of two different catalogues is merger density plots shown in Figures 14–16. These plots show the distance at which (sub)halos merge with their larger parent halo and the number of particles comprising the (sub)halo when it was last found. These plots probe completeness of the samples and complement the dendrograms. The plots show a 2D histogram of the number or particle in merging halos against the ratio of the merger radius (R merge) to the virial radius of its parent halo it is merging with (R vir,parent). The colours represent the volumetric counts of halos within bins along each axis.
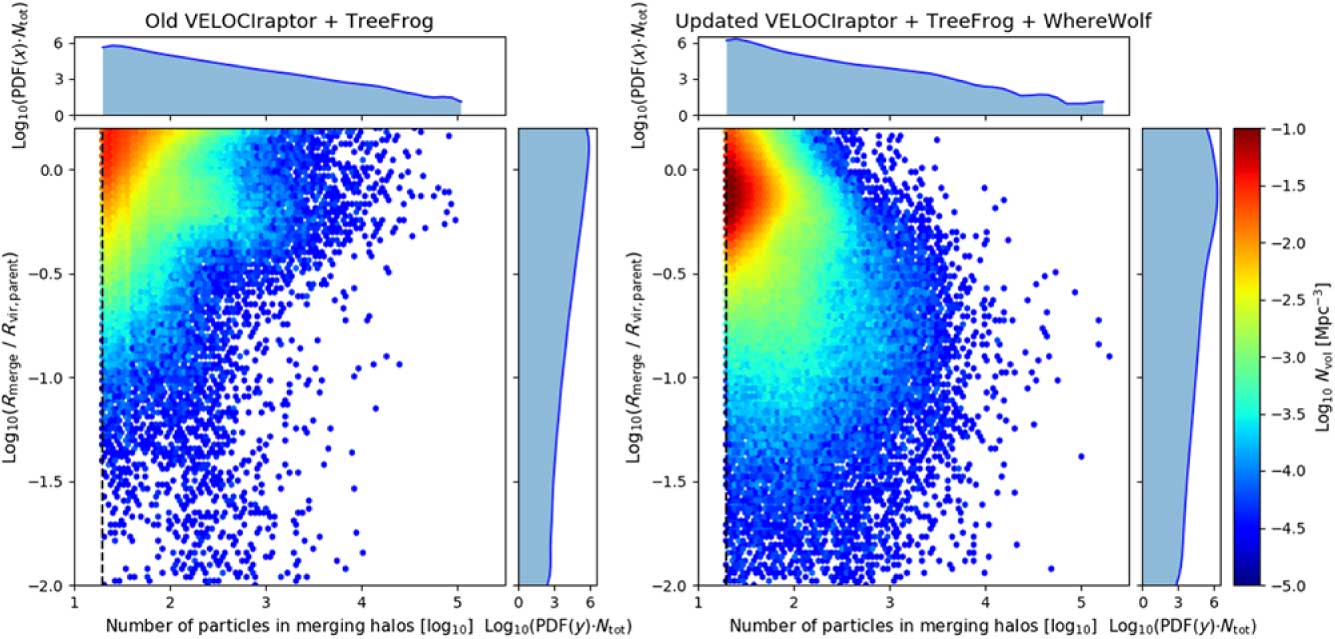
Figure 14. This shows the merger density plots for the old VELOCIraptor and TreeFrog (left) and the updated VELOCIraptor and TreeFrog catalogues (right). The black dashed line in the plots is for halos with 20 particles, which is the smallest halo stored for all halo finders. The colours represent the log of volumetric counts of the halos. The side plots show the probability density function (PDF), found by using a kernel density estimator (Rosenblatt Reference Rosenblatt1956; Parzen Reference Parzen1962) along each axis, multiplied by the total number of halos present in the figure.
Ideally, the merging (sub)halos would preferably be in the bottom left-hand corner of the merger density plots, where the halos have merged well within the parents R vir,parent and are left with very few particles. Halos in the top right are halos that have merged with many particles and are far away from their parents R vir,parent, which means that the halo has not been well tracked until its disruption.
The merger density plots for the old and updated VELOCIraptor are shown in Figure 14. By studying the old/updated VELOCIraptor merger density plots, we can see that the updates have shifted the majority of halos to be merged within their parents R vir,parent. The addition of WhereWolf tracking missing halos means that halos merge much deeper into their parents R vir,parent. The difference can be seen clearly in Figure 16, which shows the merger density plot for the updated VELOCIraptor and TreeFrog before WhereWolf has been run on it. The addition of WhereWolf allows for a more careful and complete tracking of halo and subhalo orbits.
The merger density plots for both AHF and Rockstar are shown in Figure 15. From the plots we can see that AHF struggles to identify halos well inside the parents’ R vir,parent, primarily because AHF struggles to identify (sub)halos in overdense backgrounds. In contrast Rockstar performs much better because it is a phase space halo finder, like VELOCIraptor and Consistent Trees gravitationally evolve the position of the halo once it had been lost.
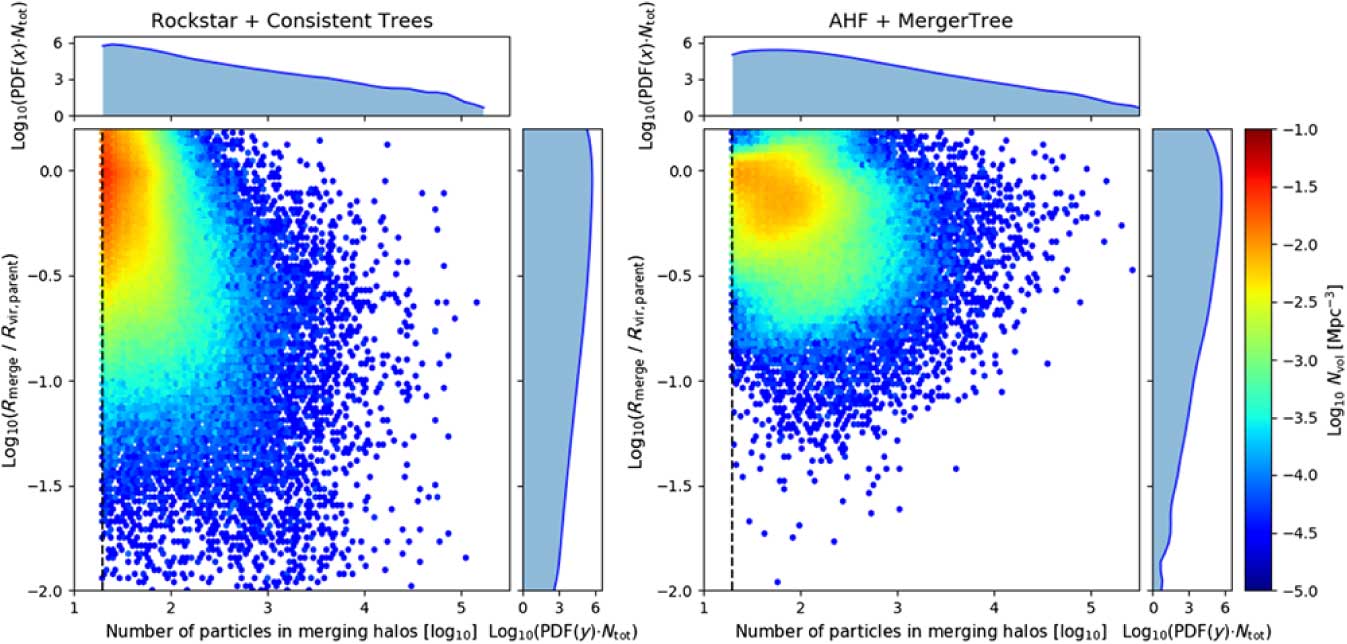
Figure 15. The merger density plots for the Rockstar (left) and AHF (right) catalogues.

Figure 16. The merger density plots for the updated VELOCIraptor and TreeFrog catalogue, before WhereWolf has been run.
By comparing the merger density plots in both Figures 14 and 15, it can be seen that, overall, the number density of halos is less in the AHF and Rockstar. In the case of AHF, it cannot pick out as many objects in dense environments. Rockstar does have more than AHF which is due to it being a phase space halo finder, but not as many merged (sub)halos as VELOCIraptor. This is because Consistent Trees gravitationally evolves positions of some (sub)halos for up to four snapshots (Behroozi et al. Reference Behroozi, Wechsler, Wu, Busha, Klypin and Primack2013b), which means that if something evaporates within the last four snapshots, it will not merge. In addition, the algorithm also removes any subhalo that does not exist for more than 10 snapshots, effectively discarding any subhalo which is fluctuating around the particle limit and also any subhalo that may have undergone fragmentation on infall.
Ideally, we expect halos to slowly lose mass until their pericentres are a small fraction of the virial radius and only truly vanish when they are near the resolution limit of the simulation. These figures indicate this is not always the case, with some halo finders and tree builders implying that halos merge well outside the virial radius of their host while still resolved by thousand of particles. Halos merging while still having a large number of particles and being outside R vir,parent suggests a problem with the codes, but the solution is not immediately apparent from the merger density plots. The dendrograms provide a clearer picture of what happens in these situations, therefore presenting possible solutions to these halos merging at large radii.
6. Discussion
The merger tree dendrogram plots are high information density visualisations of the lives of (sub)halos extracted using halo finders and tree builders. This enables not only a detailed examination of how the halo finders and tree builders are performing, but also for other researchers to find the best merger trees for their desired project. The dendrograms provide a comparison tool for the merger tree builders and a novel visualisation of what the merger trees look like.
These dendrograms have been useful to help identify cases where either the halo finder has not properly identified the halo or tree building algorithm has not correctly connected up the halos across snapshots. In addition, the dendrogram can be used to identify exactly where the problems arise enabling a much quicker refinement process for either the halo finder or the tree builder.
Utilising these dendrogram we hope to address what has been a root problem within SAMs: how to treat merging satellite galaxies within simulations. While ideally these codes should trace galaxy mergers from first infall to complete coalescence, halo finders and tree builders are not always able to provide such a picture. This comes down to the ability of the halo finder to track halos well inside the virial radius of the host halo (see Pujol et al. Reference Pujol2017 for more information).
Typically, it is assumed that the satellite galaxy associated with the halo does not merge when its host halo is lost. SAMs use a few different methods to determine the trajectory and lifetime of these ‘orphaned’ galaxies (Guo et al. Reference Guo2011; Lagos et al. Reference Lagos, Tobar, Robotham, Obreschkow, Mitchell, Power and Elahi2018). One approach is where the galaxy is merged immediately when its halo has been lost; another approach is where an analytical orbit is determined from when its halo is lost and is continually decreased until it is merged; a further approach is where the trajectory is determined from its most bound particles of its host halo. Some approaches even use a combination of these methods (Pujol et al. Reference Pujol2017). These different methods can have varying effects on the abundances of galaxies produced due to the underlying assumptions such as mass loss rate, dynamical friction timescale, etc. Robotham et al. (Reference Robotham2011) demonstrate issues with this approach in modern SAMs finding more satellites on close orbits than exist in the observational GAMA survey data.
While plots like the merger density plots are useful since they indicate the possible presence of ‘orphaned’ galaxies, it is not clear what is happening in each situation from the plots. Using the dendrograms, it will be clear when these sorts of events happen and how the halo finder/tree builder deals with the situation. By highlighting when these events happen, we hope to address this problem and improve merger trees built by these codes.
The dendrograms will also be useful when comparing between different halo finders and tree builders. In this paper we have shown the dendrograms for three different halo finders and their respective tree building algorithms, giving an idea of how these plots can be used for future comparison projects. This work will also give researchers a better understanding of what to expect when they use merger trees from a particular halo finder.
We believe that the dendrograms will not only be useful for tracking dark matter halos in a simulation but also for tracking baryonic galaxies. The colour of the points could be changed depending on the requirements, for example to show stellar/gas mass content. There are many other possibilities, but care should be taken not to trade information density for comprehensibility. When developing the code, we found it was difficult to add much more complexity to the dendrograms without compromising their accessibility. That said, the code is hosted on an open source repository in order to encourage community uptake and adaptation. Furthermore, a web interface could be created for the dendrograms, whereby clicking on each branch shows another dendrogram displaying everything that has merged with it.
Author ORCIDs.
Rhys J. J. Poulton, http://orcid.org/0000-0003-2049-520X, Aaron S. G. Robotham, http://orcid.org/0000-0003-0429-3579, Chris Power, http://orcid.org/0000-0002-4003-0904, Pascal J. Elahi, http://orcid.org/0000-0002-6154-7224
Acknowledgements
We would like to thank Greg B. Poole and Ainulnabilah B. Nasirudin for their clear and constructive comments. R. P. is supported by a University of Western Australia Scholarship. A. R. acknowledges the support of ARC Discovery Project grant no. DP140100395. C. P. is supported by ARC Future Fellowship FT130100041. P. J. E. is supported by the Australia Research Council (ARC) Discovery Project Grant No. DP160102235 and ARC Centre of Excellence ASTRO 3D through project no. CE170100013. Part of this research was undertaken on Raijin, the NCI National Facility in Canberra, Australia, which is supported by the Australian commonwealth Government. Parts of this research were conducted by the Australian Research Council Centre of Excellence for All Sky Astrophysics in 3 Dimensions (ASTRO 3D) through project no. CE170100013.
Appendix A. How the dendrogram builder code works
The code requires the tree information be in efficient tree format (ETF), this is where every halo knows the halo that it started the simulation in (Root Progenitor), the halo which it ended the simulation in (End/Root Descendant), in addition to knowing where it was in the previous snapshot (Progenitor) and where is going to be in the next snapshot (Descendant). This format makes processing the trees and building the dendrograms much faster, once this initial ETF pre-processing is done. The header of the ETF catalogue contains all the required simulation information.
Next, the indexes of the trees which are to be plotted needs to be selected. By default this is done in size order of the halos in the final snapshot. Then by using the End/Root Descendant and Root Progenitors, the full merger tree can be extracted for a halo. In addition, using identity of the halo’s host, a full interaction tree can be built to plot in the dendrogram. These data are then used to create the plotting arrays, these are:
xposData: A N snaps × N branches array of the distance moved for the main branch and radial position for the deeper branches;
sizeData: A N snaps × N branches array of the size of the data points;
colData: A N snaps × N branches array of the colour of the data points;
sortIndx: A 1 × N branches array of the sorted index from the sizeData array for each branch;
branchIndicator: A 1 × N branches array of the index of which branch this branch merges with and also indication if the branch is a subhalo;
depthIndicator: A 1 × N branches array of the temporal depth of each from the main branch;
where N branches is the number of branches which have a unique Root Progenitor, and the N snaps is the number of snapshots in the simulation. These arrays are then used to plot the dendrogram from the specified options in the plotting config file; a sample config file is provided with the publicly available code.
A flow chart summarising how this code works is shown in Figure A1; for more details, please see the MergerTree-Denograms repository.
Figure A1. How the dendrogram builder code works. Format is the format of the merger tree, convToETF.cfg is the configuration file used to create the ETF from the format given. Num plot is the number of dendrograms to plotted, output directory is the directory where the dendrograms will be placed, and plot_config.cfg is a config file which provides all the information for plotting.
Appendix B. Efficient Tree Format (ETF)
Table B1 shows the required format of the input HDF5 file to create the dendrogram plots, and Figure 1 shows a diagram of the merger tree information available in ETF format. With the header containing the required information for the simulation. The IDs in the format are given by
 $$\text{HaloID}=\text{snapshot}\ \times \ \text{HALOIDVAL}\ +\ {{i}_{\text{halo}}}\ +\ 1,$$
where i halo is the index of the halo within the current snapshot. The IDs follow this format as this enables a quick parsing of the tree to create the plotting arrays needed to build described in appendix A to create the dendrograms.
Table B1. Table showing the minimum amount of data available in ETF for version 1.0
This format is required since it enables a quick traversal of the halo merger trees, enabling for a much quicker building of the merger tree for the dendrogram. Table B2 shows the timings to convert the VELOCIraptor, Rockstar, and AHF halo catalogues—built using the 40Mpc/h 5123 particle SURFS simulation—into ETF. This format is very similar to the VELOCIraptor (Elahi, in preparation), with only different field name; hence why the conversion takes virtually no time. Rockstar and AHF IDs do not contain information such as the halo snapshot and the index (where they are located in the snapshot catalogue). Both VELOCIraptor and Rockstar have catalogues that contain the merger tree along with the halo properties whilst AHF does not. This means for AHF it has to be found in both the halo and merger tree catalogues. AHF (MergerTree) does not have an efficient way of reporting whether a halo has no progenitors, except if it does not exist in the catalogue. These reasons are why AHF takes longer than any of the other formats to convert to ETF, but a parallel conversion tool has been built to convert AHF to reduce the real time taken to convert.
Table B2. Timing to convert different formats into ETF
Appendix C. Example exclusive mass dendrogram
This example shows the same case as in Figure 11 but where the mass is exclusive, so the mass for a halo is just the mass of the halo itself and does not contain the masses of any subhalos of the halo. The changes in parent halo mass are much smoother than for the inclusive dendrogram. This is due to not being affected as much when halos become a subhalo of the parent halo. The dendrogram is also shown before WhereWolf was run on the updated VELOCIrator and TreeFrog catalogues, so the improvement can clearly be seen. From Figure 11, it can be seen that WhereWolf is able to connect up the halo that was assigned to the wrong branch in the fifth branch due to the missing of halo for over 10 snapshots.
From Figure C1, it can be seen that VELOCIraptor merges most of the large branches with the main branch since it can no longer track them. In comparison, WhereWolf is able to track continuously these branches and accurately reconstruct their masses until they are completely dispersed or the simulation ends. This can vastly change the evolution of the main branch and what happens to its central galaxy.
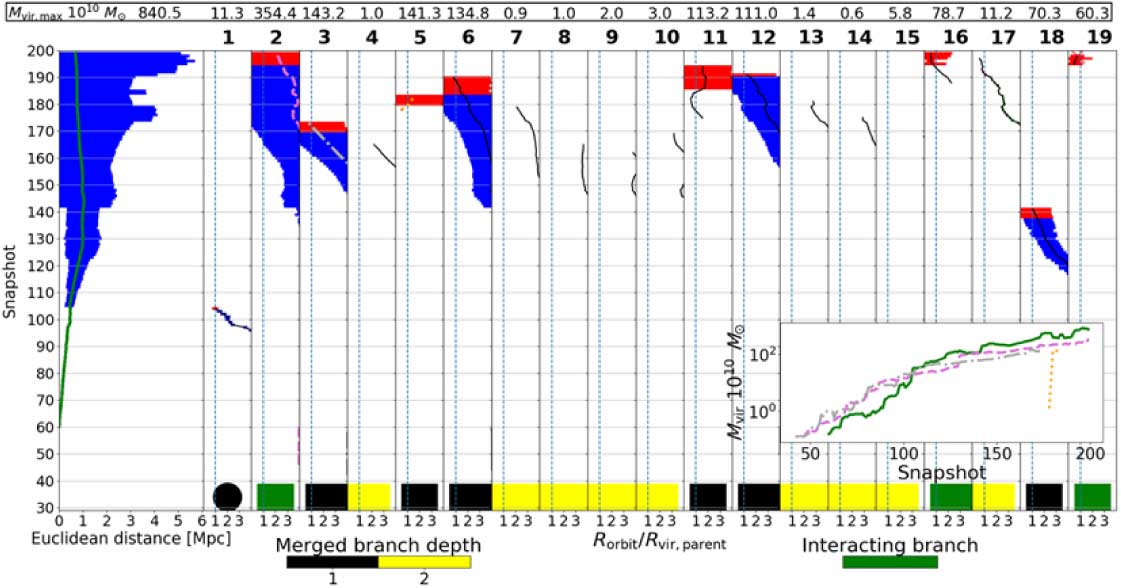
Figure C1. QUAD1 merger tree from updated VELOCIraptor + TreeFrog catalogue where the masses are exclusive, before WhereWolf has been run.


