


1. Introduction
Acoustic waves play a significant role in jet dynamics. In addition to determining the far-field noise, they also provide feedback paths to trigger instabilities. Therefore, a crucial benefit in understanding different aspects of jet dynamics and exploring flow control accrues if the jet acoustic content can be filtered from the rest of the turbulent flow field. This is not a trivial process in the turbulent core or the near-acoustic field, since the acoustic energy forms only a tiny fraction of the total energy contained in a jet.
Nevertheless, the acoustic component in the jet near-acoustic field exhibits certain unique characteristics (Jordan & Colonius Reference Jordan and Colonius2013) that facilitate the capture of the near-field acoustic footprint with signal-processing techniques. Arndt, Long & Glauser (Reference Arndt, Long and Glauser1997) performed a proper orthogonal decomposition (POD) of pressure fluctuations measured along the outer edge of a jet shear layer and argued that near-field pressure spectra in a subsonic jet can be segregated into a low-frequency hydrodynamic and a high-frequency acoustic regime. This idea was expanded to incorporate phase speeds by Tinney & Jordan (Reference Tinney and Jordan2008), who applied a wavenumber-frequency bandpass filter on near-field pressure measurements, obtained from a similar line array, to separate the convecting and radiating pressure components in coaxial subsonic jets. Selective frequency filtering was extended to supersonic jets by Kuo et al. (Reference Kuo, Buisson, McLaughlin and Morris2013), who applied an empirical modal decomposition to separate the near-field pressure spectra into intrinsic mode functions, which were then combined to represent the contribution of hydrodynamic and acoustic components. Grizzi & Camussi (Reference Grizzi and Camussi2012) leveraged the intermittent nature of the near-field pressure fluctuations to develop a wavelet-based approach to reconstruct the time series of hydrodynamic and acoustic components from a two-dimensional array of pressure measurements. The method was further advanced by Mancinelli et al. (Reference Mancinelli, Pagliaroli, Di Marco, Camussi and Castelain2017) to rely on minimal data by incorporating probability density functions, and cross-correlations with far-field measurements to extract the acoustic component from each pressure probe.
Although the above-mentioned methods have been successful, they generally require specification of thresholds that depend on the jet operating condition. An alternate method that has proven effective in extracting the acoustic component is momentum potential theory (MPT) (Doak Reference Doak1989). As summarized in § 2, an acoustic component, defined as the irrotational-isentropic part of the ‘momentum density’,  $\rho \boldsymbol {u}$ (density times velocity) may be extracted through a Poisson equation with a source term that depends on primitive variable fluctuations. The other two components, hydrodynamic (vortical) and thermal (irrotational-isobaric), may also be suitably extracted. The formulation is exact regardless of the size of turbulent fluctuations or the presence of other complicating factors such as shock-cells, because it leverages the linearity of the mass conservation equation in $\rho \boldsymbol {u}$.
MPT-derived components offer significant insights into jet dynamics, which are difficult to obtain with the more commonly used primitive variables. Recent efforts have successfully used MPT to understand exchange mechanisms by which the chaotic turbulence energy in a free jet is converted into sound (Unnikrishnan & Gaitonde Reference Unnikrishnan and Gaitonde2016, Reference Unnikrishnan and Gaitonde2018), to predict far-field noise based on a simple linear wave propagator from the edge of the turbulent jet and superior wavepacket models (Unnikrishnan, Cavalieri & Gaitonde Reference Unnikrishnan, Cavalieri and Gaitonde2019), to investigate noise reduction mechanisms of fluid inserts in over-expanded heated military jets (Prasad & Morris Reference Prasad and Morris2019, Reference Prasad and Morris2020, Reference Prasad and Morris2021) and to analyse receptivity and generation processes in an under-expanded impinging jet (Prasad, Stahl & Gaitonde Reference Prasad, Stahl and Gaitonde2021). These examples highlight the versatile nature of the MPT procedure, which poses no restrictions on the complexity of the problem that can otherwise present an additional challenge to traditional signal-processing techniques.
Despite its effectiveness, the application of Doak's MPT to date has been mostly predicated on the availability of rich numerical databases generated with substantial computational resources. In fact, a complete application of MPT, as shown in § 2.1, requires a simultaneous space–time description of momentum density, pressure and density field, which is currently beyond the scope of experimental techniques. Although the computational cost is significantly relaxed when the MPT-derived components are obtained as instability modes about the mean flow as in Prasad & Gaitonde (Reference Prasad and Gaitonde2021), there is an inherent advantage in extending this procedure to experimental measurements, which generally contain significantly longer time-series data than numerical simulations. This facilitates better statistical convergence and excellent resolution of low-frequency phenomena, which are very computationally demanding to capture. Measurements are, however, often limited by their sampling resolution and the number of quantities that can be measured simultaneously.
The present work extends crucial elements of the MPT procedure to experimental measurements by suitably interpreting and processing time-resolved high-speed schlieren data, whose resolution and fidelity has seen rapid improvement in recent years. Schlieren imaging is a widely used flow visualization technique that can provide an accurate space–time description of the density-gradient field, and therefore forms the basis of the present study. We show that the original MPT procedure (§ 2.2) can be modified to incorporate the pixel intensities extracted from schlieren images. Since schlieren images provide only the density gradients in the flow, the decomposition is partial and essentially extracts the combination of irrotational isentropic and isobaric components. However, the isobaric component is not critical outside the turbulent core, and thus the resulting wavepacket structures from schlieren-derived MPT accurately capture the observed near-field acoustic characteristics. This is demonstrated for both free and impinging jets in § 3 using configurations selected based on their relevance to practical jet noise problems and the availability of high-quality large-eddy simulations (LES) and experiments. The numerical test cases serve as truth models; for these, numerical schlieren images are constructed from the 3-D LES flow field by performing line-of-sight integration using the procedure laid out by Yates (Reference Yates1993). The procedure has been demonstrated to provide accurate one-on-one comparisons between experiments and computations for general 3-D flow fields. The resulting wavepackets from the schlieren data are validated with those obtained from the full LES data using spectral proper orthogonal decomposition (SPOD) (Towne, Schmidt & Colonius Reference Towne, Schmidt and Colonius2018). For the experimental test case, the SPOD modes are validated using available near-field measurements. A summary of the present findings is presented in § 4.
2. Method
This section provides pertinent details of MPT and its implementation to both LES and schlieren data.
2.1. General formulation
Momentum potential theory comprises a Helmholtz decomposition of the momentum-density  $(\rho \boldsymbol {u})$ flow field into its solenoidal and irrotational components:
 \begin{equation} \rho \boldsymbol{u} = \bar{\boldsymbol{B}} + \boldsymbol{B}' - \boldsymbol{\nabla} \psi', \quad \boldsymbol{\nabla} \boldsymbol{\cdot}\bar{\boldsymbol{B}}=0, \quad \boldsymbol{\nabla} \boldsymbol{\cdot}\boldsymbol{B}'=0, \end{equation}
where  $\bar {\boldsymbol {B}}$ is the mean solenoidal component, $\boldsymbol {B}'$ is the fluctuating solenoidal component and $\psi '$ is the fluctuating irrotational scalar potential. Equations (2.1a–c) when substituted into the continuity equation yield
 \begin{equation} \nabla^2 \psi'=\frac{\partial \rho'}{\partial t}. \end{equation}
The irrotational scalar potential can be further split into its acoustic and thermal components,  $\psi '=\psi '_a + \psi '_t$, where the acoustic component is described by
 \begin{equation} \nabla^2 \psi_a'=\frac{1}{c^2}\frac{\partial p'}{\partial t},\end{equation}
where  $p'$ and c denote pressure fluctuations and the speed of sound, respectively. The procedure (Unnikrishnan & Gaitonde Reference Unnikrishnan and Gaitonde2016) requires the solution of the two Poisson equations (2.2) and (2.3) to obtain $\psi '$, $\psi _a'$ and $\psi _t'$. Since the outer boundaries in a numerical solution are often far away from the jet, these are taken as purely acoustic; this results in $(\rho \boldsymbol {u})'=-\boldsymbol {\nabla } \psi ' = -\boldsymbol {\nabla } \psi '_a$ which is integrated along the boundaries to provide a Dirichlet boundary condition to the Poisson solver. Once $\psi '$ is known, the fluctuating solenoidal component is obtained from (2.1a–c). This solution procedure has been extensively validated for a wide array of flow configurations including both free and impinging jets at on- and off-design conditions (Unnikrishnan & Gaitonde Reference Unnikrishnan and Gaitonde2018; Prasad & Morris Reference Prasad and Morris2020; Prasad et al. Reference Prasad, Stahl and Gaitonde2021).
2.2. Application to schlieren data
A key feature in MPT-based investigations is the use of the streamwise gradient of the acoustic potential,  $-\partial \psi '_a/\partial x$, as a representation of the acoustic content in the jet shear layer. In free jets, $-\partial \psi '_a/\partial x$ exhibits a highly coherent wavepacket structure that scales with pressure fluctuations away from the jet shear layer (Unnikrishnan et al. Reference Unnikrishnan, Cavalieri and Gaitonde2019; Prasad & Morris Reference Prasad and Morris2020), whereas in impinging jets, $-\partial \psi '_a/\partial x$ accurately captures the upstream radiating component of the feedback loop (Prasad et al. Reference Prasad, Stahl and Gaitonde2021). This information is leveraged when applying the MPT procedure to schlieren data in the following manner.
Schlieren images are created by passing collimated light through a 3-D flow field, where they undergo angular deflection. The rays exiting the flow are then focused at a point where a portion of the light is blocked by a knife edge before refocusing the remaining light onto an image plane. The image essentially captures the deflection of light in the direction perpendicular to the knife edge. Figure 1(a) shows a schematic of a light ray passing through a jet. The jet flow is directed along the  $x$-direction whereas the light rays propagate along the $z$-direction as shown in figure 1(a); this coordinate system is consistent across all test cases presented in this investigation. The total angular deflection of the light ray can be obtained by integrating functions of the refractive index ( $n$) along lines of sight:
 \begin{equation} \epsilon_x = \int \frac{1}{n} \frac{\partial n}{\partial x} \,\text{d}s, \quad \epsilon_y = \int \frac{1}{n} \frac{\partial n}{\partial y} \,\text{d}s, \end{equation}
where  $\epsilon _x$ and $\epsilon _y$ are the angular deflections in the $x$- and $y$-direction, respectively, and $s$ denotes the path travelled by the light ray. For ideal and non-reacting gases, the refractive index $n$ is simply
 \begin{equation} n = 1 + \kappa \rho, \end{equation}
where  $\kappa$ is the Gladstone–Dale constant ( $\kappa = 2.23 \times 10^{-4}\ \text {m}^{3}\ \text {kg}^{-1}$ for air). Following this relation, the total angular deflection in the streamwise direction may be rewritten as
 \begin{equation} \epsilon_x = \int \frac{\partial}{\partial x}\ln(1 + \kappa \rho) \,\text{d}s \approx \int \kappa \frac{\partial \rho}{\partial x} \,\text{d}s. \end{equation}
The pixel intensities from a schlieren image therefore provide a scaled surrogate for the flow density gradient integrated along the line of sight. Although the present method is valid for gradients in any direction, for reasons stated earlier, we only consider a vertical orientation of the knife edge throughout this investigation, i.e. all the pixel intensities considered are proportional to streamwise density gradients.

Figure 1. (a) Schematic showing the deflection of a light ray cutting through a jet. (b) Instantaneous numerical schlieren image for test case 1.
Due to the linearity in  $\psi '$, (2.2) can be modified to directly obtain
 \begin{equation} \nabla^2 \left( \frac{\partial \psi'}{\partial x}\right) = \frac{\partial}{\partial t}\left(\frac{\partial \rho}{\partial x}\right)' \end{equation}
or
 \begin{equation} \nabla^2 \left( \varTheta' \right) = \frac{\partial \sigma'}{\partial t}, \end{equation}
where  $\sigma$ is the pixel intensity obtained directly from schlieren without any calibration (proportional to $\partial \rho /\partial x$) and $\varTheta$ is the resulting image intensity which is representative of $\partial \psi /\partial x$, the gradients of the irrotational MPT component integrated along the line of sight of the schlieren image. Equation (2.8) therefore provides a direct means to filter out the line-of-sight integrated $\partial \psi /\partial x$ when applied to a time-resolved sequence of schlieren images. The solution procedure and the boundary conditions are documented in the next section.
The resulting  $\varTheta '$ from the schlieren images, however, contains contributions due to both the acoustic and thermal components. Previous numerical investigations have shown that the thermal component ( $-\partial \psi '_t/\partial x$), similar to its acoustic counterpart ( $-\partial \psi '_a/\partial x$), exhibits a coherent wavepacket-like structure, which is non-radiating even for highly heated supersonic jets (Prasad & Morris Reference Prasad and Morris2021). This enables the primary-noise-radiating mechanisms to be extracted from the schlieren-derived $\varTheta '$, as demonstrated in the test cases below.
3. Test cases
3.1. Test case 1: numerical schlieren of a heated over-expanded Mach 1.36 jet
A model-scale GE-F404 military-style, faceted nozzle (diameter,  $D=0.0254$ m) is considered first at Mach $1.36$, a nozzle pressure ratio (NPR) of $3.0$ and a total temperature ratio (TTR) of $2.5$. The LES database has been previously validated extensively against experimental measurements (Prasad & Morris Reference Prasad and Morris2019, Reference Prasad and Morris2020). A total of 1500 portable network graphic, grey-scale (8-bit) numerical schlieren images ( $1280 \times 720\ {\rm pixels}$) are generated from the 3-D LES snapshots sampled at $200$ kHz by integrating the expression for $\epsilon _x$ in (2.6) following the procedure of Yates (Reference Yates1993). The numerical schlieren domain extends up to $10D$ downstream of the nozzle exit and $2.5D$ in the radial direction to represent a practical field of view obtainable with experiments. In contrast, the LES domain extends up to $65D$ downstream and $25D$– $40D$ radially depending on the streamwise location.
Figure 1(b) shows an instantaneous simulated schlieren image at an arbitrary time instance. The schlieren image clearly shows the turbulent structures in the jet shear layer and the shock-cells due to the over-expanded nature of the jet. In addition, the strong downstream Mach wave radiation signature characteristic of heated supersonic jets is also captured by the simulated schlieren. The grey-scale pixel intensities in the schlieren image are used to calculate the source term in (2.8). Even though this yields a space–time description of the source term, a simultaneous measurement of  $\rho \boldsymbol {u}$ is not available. This constraint, along with the smaller extent of the schlieren domain relative to the computations, prohibits a specification of a purely acoustic boundary condition for the Poisson solver, unlike for application to LES data.
This limitation is overcome by incorporating a sponge zone to gradually damp the acoustic waves to zero as they reach the outer boundaries using a hyperbolic tangent function; this results in a  $\varTheta '=0$ boundary condition for the Poisson solver. Figure 1(b) highlights the sponge zone as the region between the outer boundaries and the yellow box. Due to the limited field of view of the numerical schlieren, the sponge zone width is an important parameter. Based on convergence tests, a minimum sponge zone width of $0.35D$ is found to be appropriate to avoid spurious noise from the boundaries without sacrificing the accuracy of the solution; this minimum sponge zone width is used for all the test cases in this investigation. Equation (2.8) is then discretized to a second-order accuracy and solved using the BiCGSTAB algorithm (Van der Vorst Reference Van der Vorst1992) to obtain a corresponding $\varTheta '$ for each snapshot.
The resulting  $\varTheta '$ snapshots are subsequently processed with SPOD. The Fourier transform is performed by arranging the snapshots into blocks of $256$ with a $50\,\%$ overlap. A Hamming window is applied to each of these blocks to minimize spectral leakage. Following Stahl, Prasad & Gaitonde (Reference Stahl, Prasad and Gaitonde2021), statistical symmetry across the jet centreline axis is exploited by mirroring and appending the snapshots to the data matrix, thus doubling the number of blocks used. These SPOD parameters are consistent across all cases.
Figure 2 compares the leading SPOD modes of  $\varTheta '$ obtained from the schlieren images with those of $\partial \psi '_a/\partial x$, the pure acoustic component obtained from the LES, as a function of Strouhal number ( $St=fD/U_j$), where f is frequency in Hz and U j is the fully expanded jet exit velocity. To mimic the procedure used when experimental schlieren is available, the $\varTheta '$ values are computed using a single 2-D plane. In contrast, the truth model values are the $\partial \psi '_a/\partial x$ obtained by solving the Poisson equation for $\psi '_a$ (2.3) in the full 3-D LES domain, followed by SPOD on a 2-D azimuthal slice.

Figure 2. Leading SPOD modes of  $\partial \psi '_a/\partial x$ from LES (a–c) compared with those of $\varTheta '$ obtained from schlieren (d–f) at ${St}=0.34$ (a,d), ${St}=0.63$ (b,e) and ${St}=1.02$ (c, f). The x and y directions are defined in figure 1(a).
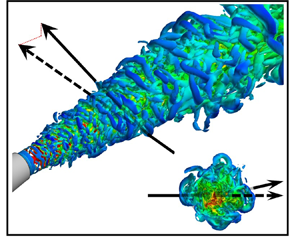
As expected, the leading SPOD modes from the LES consist of a Kelvin–Helmholtz (K–H) wavepacket (Schmidt et al. Reference Schmidt, Towne, Rigas, Colonius and Brès2018) with a strong downstream noise radiation signature analogous to a supersonically travelling wavy-wall (Tam Reference Tam2009). With an increase in frequency, the wavelength of the radiation and the streamwise extent of the radiating region become shorter (highlighted with a red oval) and a secondary Orr wavepacket (Schmidt et al. Reference Schmidt, Towne, Rigas, Colonius and Brès2018) appears downstream (marked with a blue rectangle). These features are accurately captured by the leading SPOD modes of  $\varTheta '$ extracted from the schlieren images. Figure 3 compares the streamwise variation of the normalized SPOD modes at $St =0.34$ and $St =0.63$ along $r/D=0.5$ and $r/D=2.0$, respectively. Along the jet lip line, despite containing contributions from both acoustic and thermal components, the schlieren-derived $\varTheta '$ SPOD modes accurately capture the spatial amplitude modulation associated with the LES-based $\partial \psi '_a/\partial x$ SPOD modes in the Mach-wave-emitting region of the jet. At certain higher frequencies, where the Mach-wave-emitting region is confined closer to the jet exit, the downstream components of $\varTheta '$ SPOD modes mimic non-radiating aspects of the LES-based $\partial \psi _t/\partial x$ modes (not shown).

Figure 3. Comparison of leading  $\partial \psi '_a/\partial x$ SPOD modes from LES with leading $\varTheta '$ SPOD modes from schlieren: (a) $St=0.34$ at $r/D=0.5$, (b) $St=0.63$ at $r/D=0.5$, (c) $St=0.34$ at $r/D=2.0$ and (d) $St=0.63$ at $r/D=2.0$.
3.2. Test case 2: numerical schlieren of an unheated under-expanded Mach 1.27 impinging jet
This flow field consists of a  $D=0.0254$ m circular nozzle exit, located at $x/D=0.5$, exhausting perpendicular to a ground plate located $4D$ downstream at Mach 1.27. This database has also been extensively validated against experimental measurements including near-field pressure and shadowgraphs in Prasad et al. (Reference Prasad, Stahl and Gaitonde2021) and Stahl et al. (Reference Stahl, Prasad and Gaitonde2021).
Figure 4(a) shows an instantaneous numerical schlieren image obtained from line-of-sight integration of the 3-D LES flow field, extending  $5D$ radially on either side of the jet centreline. The flow field can be notionally divided into three regions that collectively constitute components of a feedback loop. The free jet region consists of a thin boundary layer emanating from the nozzle exit that rolls up into coherent structures due to the K–H instability. The turbulent structures impinge on the ground plate and are diverted along the wall jet region. The potential core of the free jet, that consists of shock-cells due to the under-expanded nature of the jet, is terminated by a stand-off shock near the wall marking the beginning of the impingement zone. The interaction of the coherent structures with the stand-off shock and the ground plate results in the generation of upstream travelling acoustic waves, which provide a periodic forcing of the thin shear layer at the nozzle exit. The feedback process results in two high-intensity tones at ${St}=0.43$ and ${St}=0.55$ (Stahl et al. Reference Stahl, Prasad and Gaitonde2021).

Figure 4. Test case 2: Instantaneous numerical schlieren snapshot with the sponge zone location (a). Comparison of  $\partial \psi '_a/\partial x$ and $\varTheta '$ SPOD modes at $St=0.43$ (b–d) and $St=0.55$ (e–g).
A sequence of 1600 schlieren images is generated at  $54.1$ kHz and subjected to the same procedure as above, with a sponge zone (figure 4a). For the LES data, the MPT procedure is applied to the full 3-D flow field. Figures 4(b)–4(g) compare the leading SPOD modes of $\partial \psi '_a/\partial x$ from the LES with those of $\varTheta '$ at the two feedback frequencies. The ${St} =0.43$ tone is associated with an asymmetric mode shape, as evident from the opposite colour pairs of wavepackets on either side the jet centreline in figure 4(b), whereas the ${St} =0.55$ tone comprises an axisymmetric mode as shown in figure 4(e). These mode shapes are accurately captured by the $\varTheta '$ SPOD modes obtained from the schlieren as shown in figures 4(c) and 4( f), respectively. Figures 4(d) and 4(g) compare the streamwise variation of these SPOD modes along $r/D=0.5$. Similar to the previous test case, the schlieren-based $\varTheta '$ SPOD modes accurately capture the behaviour of the LES-based $\partial \psi '_a/\partial x$ SPOD modes along the jet lip line. This demonstrates the robust nature of the present method, as a change in test case from a free to an impinging jet, does not require any modifications to the solution procedure.
3.3. Test case 3: experimental schlieren of unheated over-expanded Mach 1.35 twin rectangular jets
This experimental twin rectangular jet (TRJ) configuration (Esfahani, Webb & Samimy Reference Esfahani, Webb and Samimy2021) consists of two identical sharp-throat, military-style rectangular converging-diverging nozzles at an aspect ratio of two. The nozzle exit width and height are  $24.13$ mm and $12.06$ mm, respectively. The centre-to-centre spacing between the nozzles is $2.25 D_e$, where $D_e = 19.25$ mm is the area-based equivalent diameter.
The jets are operated at an NPR of 2.97 and a TTR of 1.0, resulting in over-expanded jet operating conditions at Mach 1.35. The flow field is characterized by an in-phase coupling between the two jets, resulting in a screech tone at  $St=0.41$ that dominates the minor axis (defined as the plane bisecting the longer edge of the nozzle). Figure 5(a) shows an instantaneous schlieren image along the minor axis of the TRJ configuration obtained from a standard $Z$-type schlieren system (Esfahani et al. Reference Esfahani, Webb and Samimy2021). Since the jets are coupled in-phase, a field of view along the minor axis shows only one of the two jets. The MPT procedure is applied to a sequence of 2000 such images sampled at $40$ kHz in the same manner as before. The location of the sponge region is highlighted in figure 5(a). The points in the dark regions near the corners of the sponge zone are excluded from the Poisson solution. Figures 5(b) and 5(c) show the leading SPOD modes of $\varTheta '$ at two frequencies corresponding to the peak shallow angle far-field noise ( $St=0.30$) and the screech frequency ( $St=0.41$), respectively.

Figure 5. Test case 3: (a) Experimental schlieren image along the minor axis for the TRJ configuration with the sponge zone; the inset compares the autocorrelations of  $\sigma '$ and $\varTheta '$ at the marked point; leading SPOD modes of $\varTheta '$ at (b) $St=0.30$ and (c) $St=0.41$. (See Figure 1a for coordinate system definition.)
As expected, with an increase in frequency, the wavepacket represented by  $\varTheta '$ is confined closer to the jet exit. This is consistent with known noise source characteristics of jets, where the higher frequencies are radiated from further upstream. Additionally, the SPOD mode at $St=0.30$ is symmetric about the jet axis and shows a clear downstream radiation pattern. This is representative of the super-directive nature of the jets which dominates the peak noise radiation direction. The SPOD mode at $St=0.41$, on the other hand, shows an anti-symmetric behaviour as evident from the opposite colour pairs of wavepackets on either side the jet centreline, and exhibits both upstream and downstream radiating waves. The former are indicative of the screech phenomenon at this frequency, whereas the out-of-phase nature of the wavepacket on either side of the jet centreline is consistent with the near-field measurements and coherence calculations at the same operating conditions (Esfahani et al. Reference Esfahani, Webb and Samimy2021). The inset in figure 5(a) shows the autocorrelation of the instantaneous schlieren pixel intensities ( $\sigma '$) and $\varTheta '$ values as a function of time delay ( $\tau _d$) at a point marked near the jet exit. The auto-correlation of the $\varTheta '$ values shows clear peaks and valleys where $\Delta \tau _d$ between successive peaks corresponds to ${St} \approx 0.40$, the screech frequency. In contrast, the unfiltered $\sigma '$ values show a steady decay in correlation with $\tau _d$ without any indication of screech. These observations demonstrate the capability of the present method to accurately capture the different roles played by the acoustic waves in TRJ dynamics.
4. Conclusion
A method is developed to extract acoustic content from time-resolved schlieren images through Doak's MPT, which is not constrained by flow geometry or problem-dependent parameters. Three test cases, including single free and impinging round jets and a free rectangular twin jet in imperfectly expanded condition, demonstrate the robustness of technique. Irrotational wavepacket structures are filtered from the schlieren images by solving a Poisson equation derived from MPT. When combined with SPOD, the resulting modes of the filtered irrotational component accurately capture the primary roles played by acoustic waves in the flow field, irrespective of the configuration.
The present technique has the potential to provide real-time tracking of the jet acoustic content in the near field which can be leveraged for feedback control. The technique offers new avenues of simulation-experiment fusion analogous to Berry et al. (Reference Berry, Stack, Magstadt, Ali, Gaitonde and Glauser2017), who projected POD spatial basis functions from particle image velocimetry data onto a corresponding LES flow field to calculate time coefficients. A similar fusion between numerical and schlieren-derived MPT-derived wavepackets, such as for instance using the former to overcome the 2-D nature of the latter, could greatly expand the information derived from relatively sparser data. Finally, although the test cases presented in this investigation are focused on jet dynamics, the procedure is also valid for other flow fields of aerodynamic interest such as airfoils and cavity flows, among others, where flow-acoustic interactions are crucial.
Acknowledgements
The authors are grateful for the use of the experimental data collected by the Ohio State research team led by Professor M. Samimy, including Mr A. Esfahani and Dr N. Webb.
Funding
This work was performed in part under the sponsorship of the Office of Naval Research with Dr S. Martens serving as Project Monitor.
Declaration of interests
The authors report no conflict of interest.


 Open access