


NOMENCLATURE
- C D,p
pressure drag coefficient
- C f
skin friction drag coefficient
- C p
pressure coefficient
- h
wedge height, mm
- h blw
estimated height (thickness) of the undisturbed boundary-layer at the wedge foot (mm)
- l
wedge length (mm)
- M ∞
freestream Mach number
- Rex
Reynolds number per unit length
- S
surface
- t
wedge span or width (mm)
- x
distance along the flat plate from the leading edge (mm)
- x s
x distance to the plate centre plane boundary-layer separation location (mm)
- x w
x distance to the wedge foot (mm)
- y
distance in the plate wall normal direction (mm)
- z
spanwise distance from the plate centre plane (mm)
Greek symbols $\gamma$
specific heat ratio
- $\delta$
wedge angle (°)


1.0 INTRODUCTION
Aerodynamic fairings are used on the external surface of rocket and missile fuselages to protect sensitive equipment and structures from the effect of high-speed flows. This is particularly important for the supersonic flight regime where the effects include high heating rates as well as relatively large aerodynamic forces. Figure 1 shows examples on a couple of well-known space launchers of the locations of these fairings, many of which have wedge-like geometries. Each of these fairings contributes to the overall vehicle drag force, and together, they represent a significant drag increment over the equivalent smooth surface body. The recent trend in the private development of rocket launch vehicles (SpaceX and Blue Origin in the USA, RocketLab in New Zealand, etc.) has driven a resurgence in interest in supersonic and hypersonic aerodynamics. The ability to rapidly and accurately predict the drag increment on such vehicles during the early conceptual design stage, where rapid semi-empirical design methods are used rather than high-fidelity methods, is of timely importance. This paper presents an experimental and computational study aimed at identifying a simple theoretical approach to the prediction of the drag increment for wedge-like fairings. This will allow design engineers to quickly and accurately predict the full configuration drag within existing semi-empirical design codes, which have not traditionally included excrescence drag estimations. It will also allow excrescence drag to be estimated in higher fidelity methods more efficiently. Computational Fluid Dynamics (CFD) calculations of the drag of the smooth surface baseline geometry could be performed, and then the accumulated drag increment, obtained using the semi-empirical method, can be calculated without the need to resolve each fairing in the geometry mesh. It is estimated, based on an unpublished study undertaken by on the Saturn V configuration, that the hybrid computational mesh for a smooth configuration could be up to one-third of the cell count of a corresponding mesh where all of the fairings are resolved.

Figure 1. Examples of wedge-like fairings on Saturn V and Ariane V launch vehicles (NASA/ESA).
2.0 HIGH-SPEED FLOWS PAST FINITE-SPAN WEDGE FAIRINGS
High-speed flows about wedge-like fairings on the side of cylindrical bodies, where the wedge width is much smaller than body diameter, is approximately equivalent to that of the flow past finite span wedges mounted on a flat plate. This class of flow has been studied in the past(Reference Burbank, Collins and Newlander1–Reference Cooper7), and involves a complex interaction between the wedge shock wave and the oncoming boundary layer, which can separate ahead of the wedge, generating a shock-induced bow vortex, depending on the boundary-layer state and the wedge angle. The flow pattern typical of a case where the wedge angle is high enough to cause an upstream separation is shown in Fig. 2. Here the upstream separation causes an effective shock wave detachment (separation shock), lambda shock interaction and large shock-induced bow vortex. The flow will also feature separations from the sharp edges of the wedge, which result in vortices being shed.
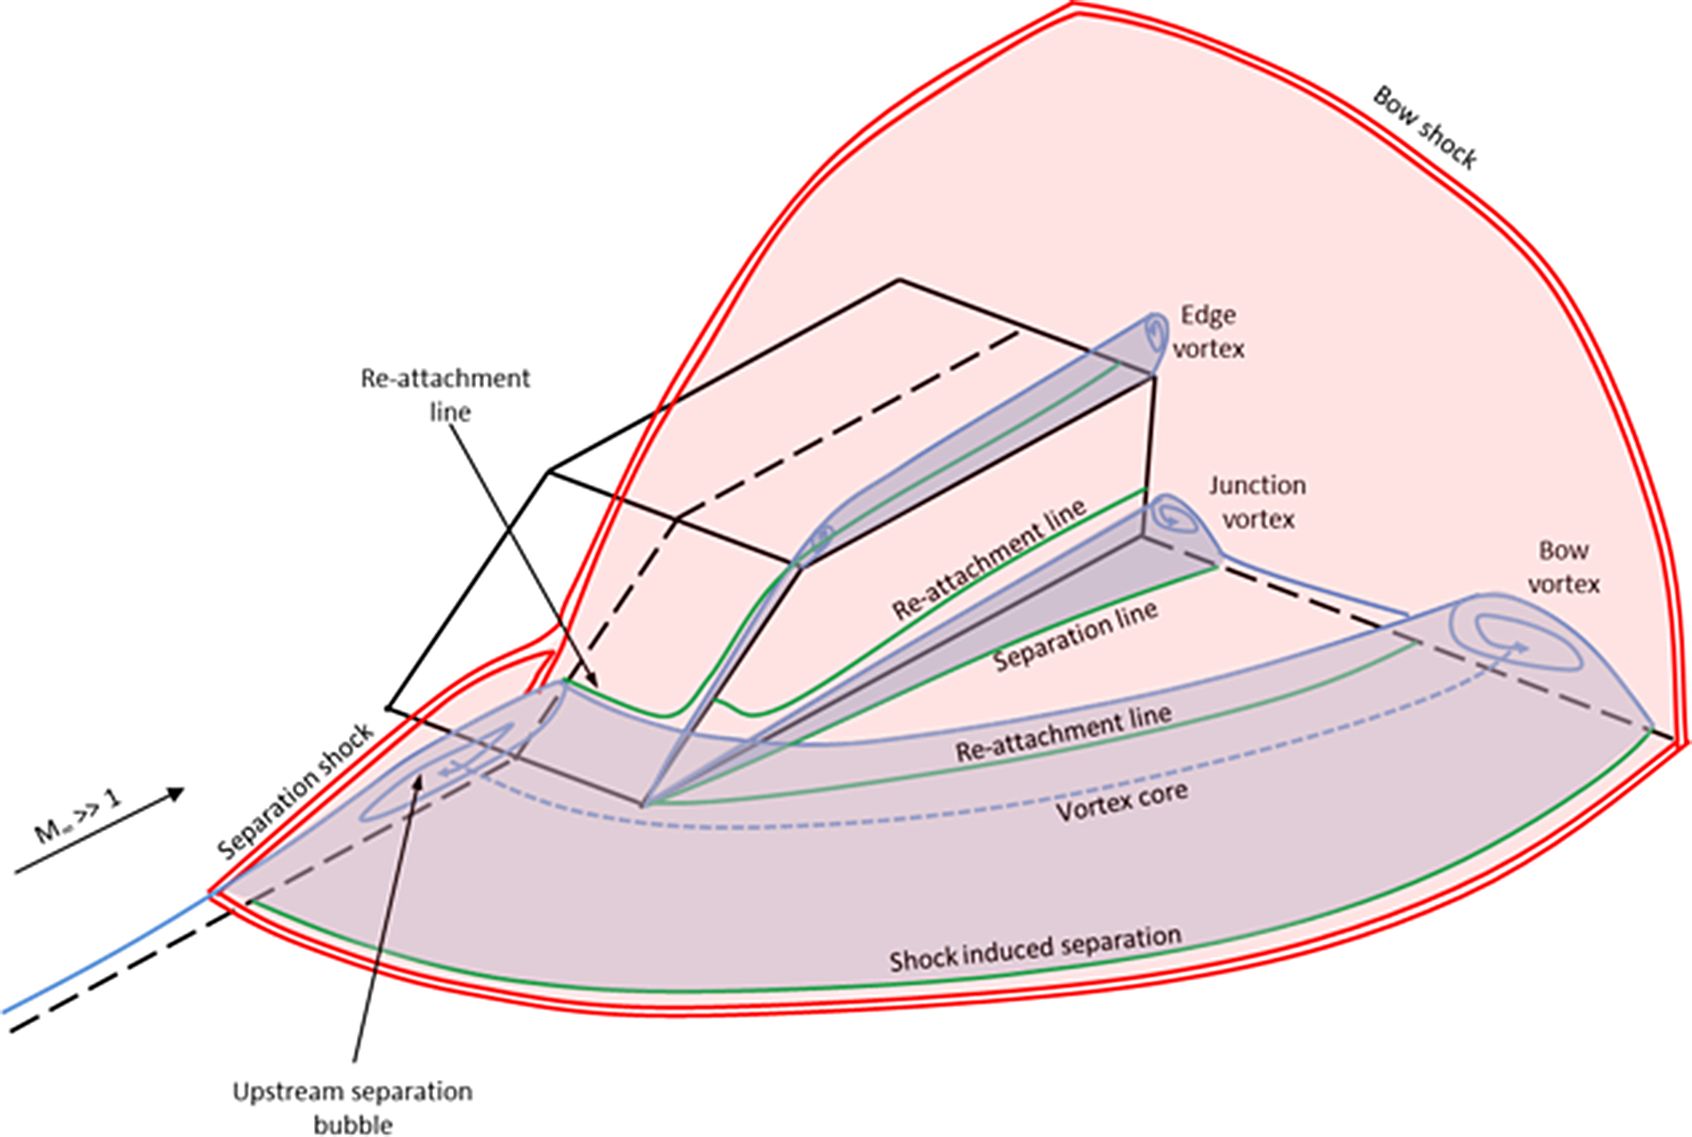
Figure 2. Schematic of the typical 3D flow features observed with supersonic flow past finite-span wedges.
This lambda shock wave pattern is characteristic of a hypersonic shock wave/boundary layer interaction. If the wedge is wide enough, the flow experienced by the forward face will correspond with that seen with the supersonic flow past a Two-Dimensional (2D) ramp compression corner, which has been extensively studied(Reference Haas, MacManus and Estruch-Samper8–Reference Prince, Vannahme and Stollery19). The flow physics for the purely 2D single-surface wedge is well understood, but more recently much work has been published for the case of a 2D double-wedge compression corner(Reference Schrijer, Caljouw, Scarano and van Oudheusden20–Reference Reinert, Candler and Komives24). Figure 3 shows the flow structure typically seen in the interaction of an oncoming boundary-layer with a ramp compression corner, where the adverse pressure gradient imposed by the ramp deflection causes an upstream separation and an associated separation shock wave and underlying separation bubble, together with a second shock wave associated with reattachment of the separated shear layer.
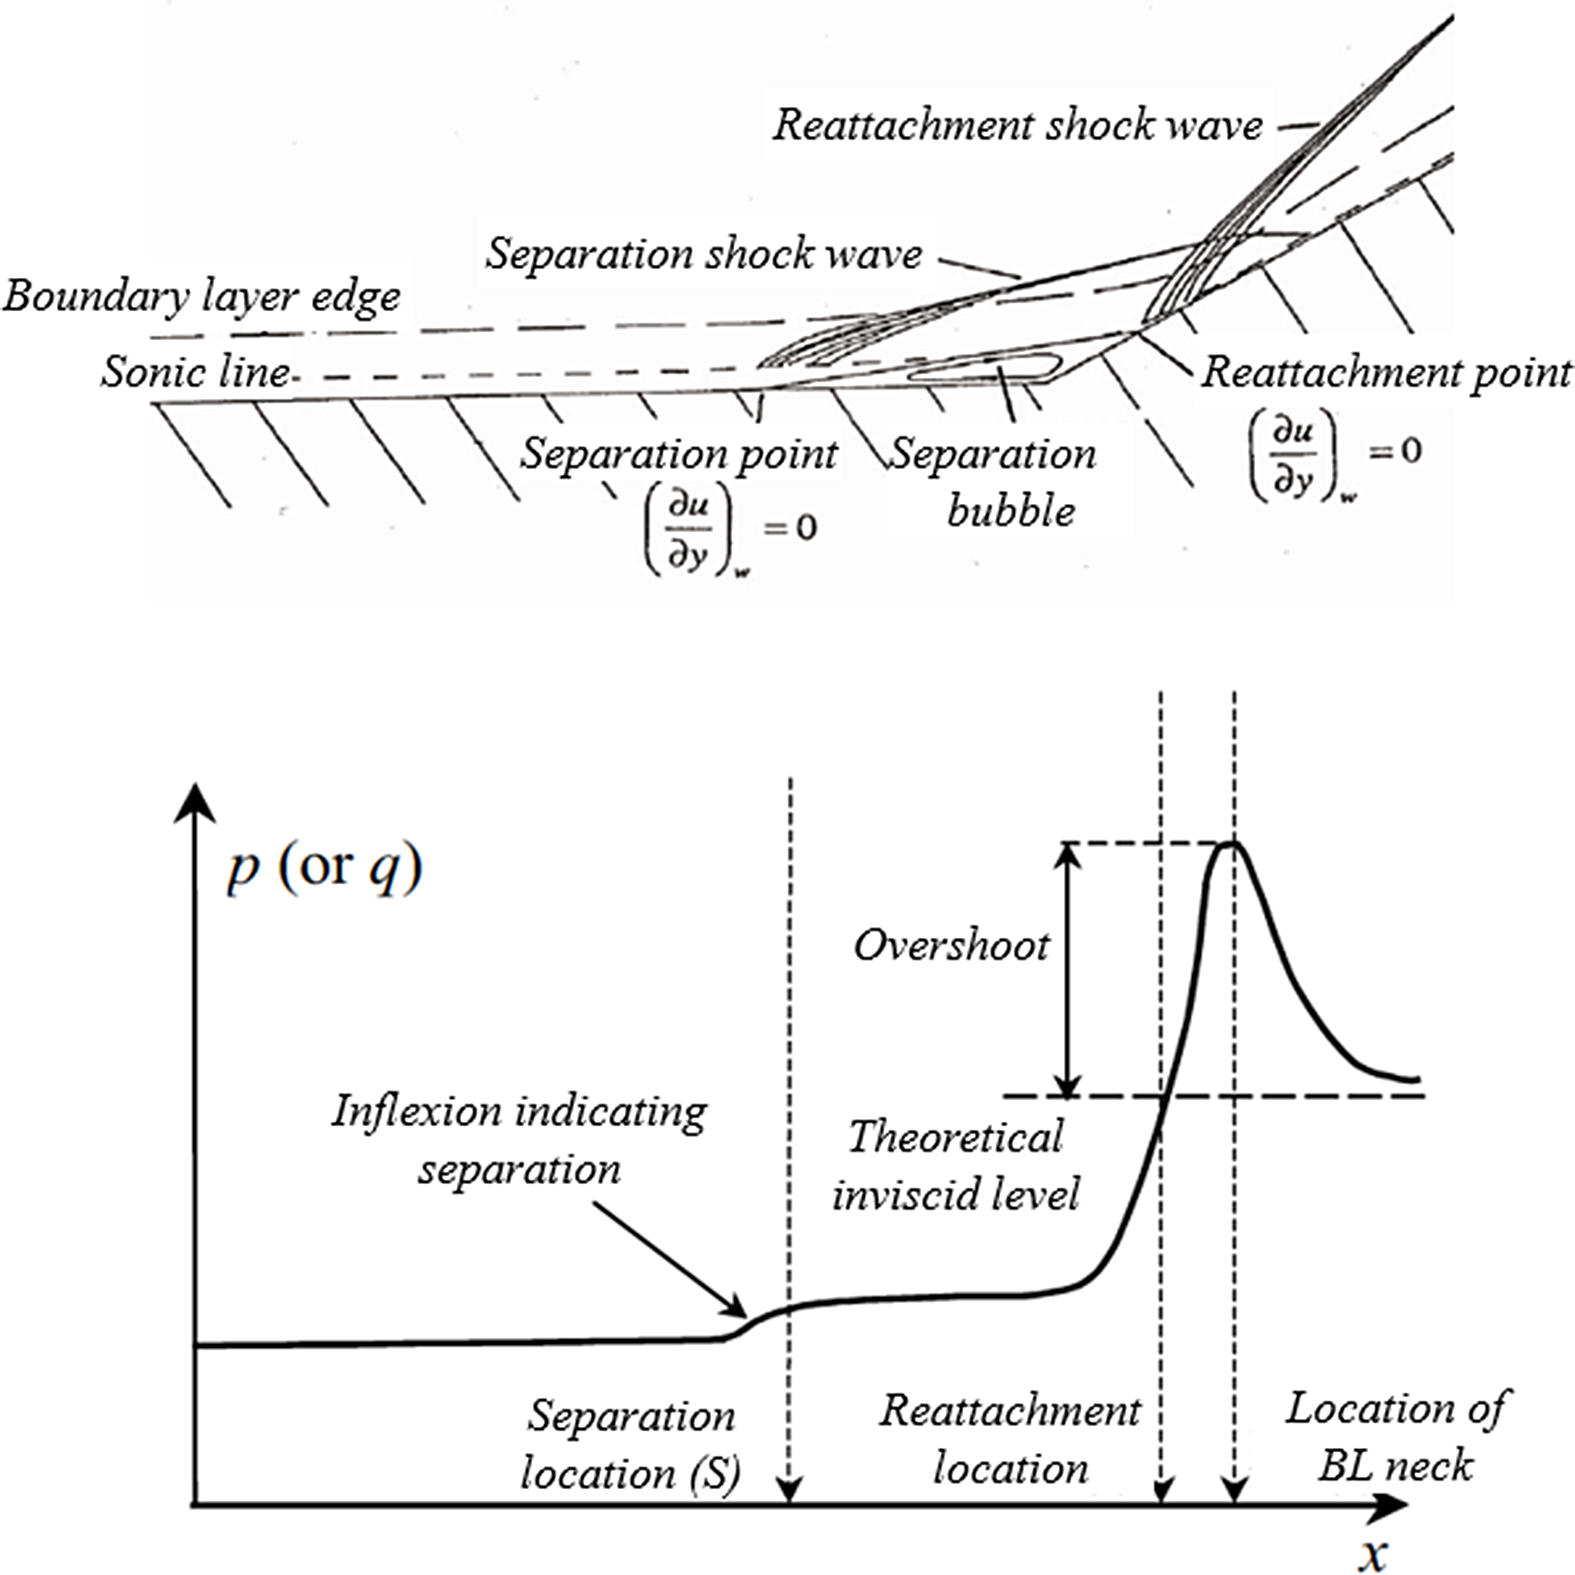
Figure 3. Schematic of the shock-wave–boundary-layer interaction flow structure, and associated surface pressure variation for a ramp compression corner.
A typical surface pressure distribution is also presented, which is characterised by the appearance of a pressure plateau under the separation bubble, and a pressure overshoot, beyond the level expected of a theoretical inviscid flow, which occurs due to the appearance of the reattachment shock wave.
3.0 THEORETICAL MODELLING
A simple theoretical drag estimation method is proposed, for the first time, for a wide range of finite span wedge fairing geometries in supersonic/hypersonic flows can be derived using a simple inviscid theory, surface friction prediction methods and empirically derived relations for the separation bubble characteristic. The wedge width is much smaller than body diameter so that the local surface flow can be assumed to approximate that on a flat surface. If the effect of flow three-dimensionality, as the flow field progressively departs from that expected of a purely 2D interaction, can be described in a simple relation, a practical drag prediction model may be developed which can be used for a wide range of wedge geometries.
Figure 4 shows a simplified model for the 2D flow structure of interest, together with the surface pressure distribution typically observed, and a simplified theoretical model. The theoretical model assumes an instantaneous jump in surface pressure at the upstream boundary-layer separation location, a subsequent pressure plateau up to the wedge foot and a linear rise in pressure from the ramp corner up to the theoretical 2D inviscid post-shock level to the reattachment point, with a constant pressure beyond this point, up to the top edge of the forward wedge face. For the case of an attached boundary-layer flow, the theoretical surface pressure would rise instantaneously at the wedge corner, from the flat plate level to the theoretical 2D inviscid post-shock level.

Figure 4. Notation used in describing the induced separation bubble and the simplified 2D surface pressure model.
Figure 5 shows the surface numbering convention used in this study, whereby the pressure and skin friction forces are estimated for each surface such that the total drag force on the fairing can be obtained from the addition of the contribution from each one.

Figure 5. Wedge surface numbering convention.
3.1 Pressure distribution on the forward wedge surface, S 1
The pressure force on the forward wedge surface was estimated using a number of theoretical approaches. The method of Boger and Aiello(Reference Boger and Aiello25) was used to predict the surface pressure level. This method is based on the theory of Cheng et al. (CT)(Reference Cheng26), combining the Three-Dimensional (3D) effect of nose bluntness (blast wave theory) and the boundary-layer displacement (strong interaction theory).
If the effects of the three-dimensionality of the flow is neglected, Shock-Expansion theory (SE) and Hypersonic Slender Body theory (HSB) can be employed to obtain the inviscid pressure level. The 2D hypersonic slender body relation for pressure coefficient for a given flow deflection,  $\delta$ (in radians), is given by
 \begin{equation}\frac{{{C_{p2}}}}{{{2^2}}} = \;\frac{{\gamma + 1}}{4} \pm \;\sqrt {{{\left( {\frac{{\gamma + 1}}{4}} \right)}^2} + \;\frac{1}{{{{\left( {\beta \delta } \right)}^2}}}}\end{equation}
where  $\beta = \sqrt {M_\infty ^2 - 1}$. In all three cases, the pressure level in the vicinity of the upstream separation bubble is estimated by use of the following empirical relations, which were obtained by analysis of, and trend fitting for, all the available experimental data on static pressure in the separated region on the plate:
for laminar flow(Reference Estruch-Samper10)
 \begin{equation}{C_{{\rm{p}}1}} = 3\sqrt {{C_{{\rm{f}}\left( {xs} \right)}}} M_\infty ^{ - 3/4}\end{equation}
for turbulent flow(Reference Bogdonoff11)
 \begin{equation}{C_{{\rm{p}}1}} = \frac{{1.91{{\left( {M_\infty ^2 - 1} \right)}^{ - 0.309}}}}{{{\rm{Re}}_{xs}^{0.1}}}\end{equation}
All three of these theoretical approaches were used and compared with the experimental drag measurements to assess their practical validity for this class of flow. The skin friction contribution on the inclined wedge surface, S 1, was calculated and its contribution in the x-direction (the drag component) determined. This was, however, neglected for the case of a significant separation bubble, where this component will be negative below the reattachment line, and positive above it, and so is expected to be relatively much smaller than that on the side surfaces S 2 and S 3.
3.2 Skin friction prediction models for surfaces S 2 and S 3
Two methods were employed for the surface skin friction estimations. The first was the standard theoretical model for compressible boundary-layers developed by van Driest(Reference Van Driest27,Reference Van Driest28) . This method has been widely employed in industrial aerodynamics design codes. The other method assessed was that developed by Eckert, and based on the reference temperature concept(Reference Eckert29). It is assumed that there is no contribution to the drag force of the wedge from the pressure acting on surfaces S 2 and S 3 for the case studied in this paper, of purely head-on freestream flow with no side-slip component. For cases with components of the flow velocity in the transverse axis (the z-axis in this case), the pressure contribution would need to be included in the same manner as has been done for the forward-facing wedge surface.
3.3 The treatment of base pressure for surface S 4
A significant contribution to the total drag of a wedge-like fairing with a rear-facing base surface is that due to the pressure on this surface, where the flow behind the fairing is likely to be fully separated. This base drag contribution is estimated in this analysis by employing the empirically derived equation for 3D base pressure of Love et al.(Reference Love30), which forms the basis for base drag predictions in most missile design codes, and has been found to be a reliable method when compared with experimental measurements for supersonic and hypersonic base flows. As shown in later sections, pressure returns to freestream levels (p) in fully separated flows in configurations with no boat-tailing and yaw, and where the extent of pressure recovery decreases with wedge span. Table 1 summarises the various combinations of the methods tested in this study.
Table 1 Six combinations of the theories determine the total drag acting on the wedge fairing by adding pressure and skin friction contributions on surfaces S 1–S 4

4.0 EXPERIMENTAL MEASUREMENTS
Experimental measurements for the assessment and validation of the six theoretical models were obtained for a Mach 8.2, Re=9.0 × 10⁶ per meter, freestream flow in the Cranfield Hypersonic Gun Tunnel. The gun tunnel is an intermittent, free-piston, blow-down facility with a run time, having steady hypersonic core flow, of about 40ms. Details of the facility are found in references(Reference Estruch-Samper10,Reference Chapman, Kuehn and Larson12,Reference Needham and Stollery13) .
The sting balance system measured three components of force/moments – normal and axial forces as well as pitching moment, with quoted accuracy of 5% at full scale. The Schlieren system was of a Z-pass design and employed a CREE Q5 LED light source, and a Photron APX high-speed camera which provided flow videos at 8,000fps with a resolution of 1,024×256 pixels.
The experimental wedge models were attached, via a rear-mounted sting balance system, 1.2mm above a sharp leading-edge flat plate model of 100mm span and 200mm length, as shown in Fig. 6. The wedge model was therefore isolated from the flat plate so that the sting balance measured only the forces acting on the model itself. A number of tests were done to assess the influence of the small gap between the model and the plate. If the gap is too large, a significant through flow between the model and the plate develops, and the plate boundary layer/shock wave flow is no longer representative of the flow where no gap exists. If the gap is too small, the small deflections of the sting result in the model hitting the plate, thereby invalidating the drag measurements. Detailed scrutiny of the Schlieren images showed that the clear differences in flow structure (shock location and boundary-layer separations) between the case with the model firmly screwed to the plate and those with large gaps between the wedge and the plate became negligible with gaps of about 1.2mm (0.6h blw for the laminar case), or less. The measured downforce on the wedge also became gap independent below a gap height of about 1.4mm. Since gap heights of less than 1mm resulted in the wedge hitting the plate, a 1.2mm gap was chosen for all experiments.

Figure 6. The geometry of the flat-plate/wedge fairing configurations.
The model was mounted in the working section as shown in Fig. 6, which presents both the geometric details as well as details of the nozzle and plate tip Mach cones for the M = 8.2 freestream, indicating the extent of downstream disturbances. The wedge model was located in a central position away from the plate edge effects.
Ten different wedge fairing configurations were tested, as listed in Table 2. Wedge angles of 25° (below the incipient separation wedge angle for a turbulent interaction(Reference Elfstrom15)) and 40° were chosen, along with four span lengths, while the overall length and height of the model was kept constant. The principal dimension of interest in this study was therefore the span, or aspect ratio, of the wedge.
Table 2 Wedge model configurations model

5.0 NAVIER–STOKES CFD SIMULATIONS
Along with the experimental test campaign, a numerical simulation study was also performed to provide more physical insight into this complicated flow, and to provide data for lower Mach numbers at which no experimental data was available. While Reynolds-Averaged Navier–Stokes (RANS)-based solvers are known to be capable of resolving the large-scale flow structure, and therefore the shock-dominated drag levels for this type of hypersonic flow, a higher fidelity time accurate large-eddy simulation-based method, which can resolve much smaller flow features is more desirable.
For the numerical simulation study, the FLUENT commercial Navier–Stokes solver was employed. The flow was assumed to follow perfect gas behaviour as the flow temperatures and densities were not expected to result in any significant molecular vibrational effects. The static freestream temperature was 89.3K for the highest Mach 8.2 case. Shock-wave theory and the results of the CFD analysis showed that, for this freestream temperature, the maximum static temperature in these highly 3D flows was just lower than the value of around 800K at which molecular vibrational excitation begins in air. Structured multiblock grids were used, whereby a grid sensitivity assessment was made with three progressively finer grids being tested, the finest having 3 million cells. A symmetry boundary condition was used on the plane passing through the z-centreline (through the centre of the wedge span), while the flat plate sharp leading edge and side edges were modelled, with far-field boundary surfaces located ten plate lengths away on all sides. The freestream boundary condition was set to match the gun tunnel flow properties during the period of the run when these were at their stabilised condition.
The first cell height on all wall surfaces was set at 1×10⁻³mm, while the cell stretching was designed to ensure at least 20 cells within laminar (thinnest) boundary-layers on the wedge surfaces. For the turbulent cases this gave y+ values of around 1 to 5 on the wedge surfaces. For this study, the steady explicit/implicit RANS solver was employed, as the experimental flows observed did not appear to be highly unsteady. The solutions were found to converge well to a near steady-state result. However, the need to compute the unsteady flow is recognised, and this is being done as a follow-on study. Spalart–Allmaras, realisable k– $\varepsilon$ and k– $\omega$ Shear Stress Transport (SST) turbulence models were tested and compared for all cases, and the latter model was found to provide the most accurate results, based on flow structure and averaged drag prediction for the Mach 8.2 cases for which experimental data exist. While it was assumed that this would be the case at lower Mach numbers as well, it is important to recognise that the drag force is dominated by shock pressure, and that the differences between the drag for laminar and turbulent flows is therefore very small. Sensitivity to turbulence model is, therefore, not significant, and all turbulent CFD results presented here are for the k– $\omega$ SST model.
The drag force coefficients were then calculated for comparison with the measured results and the theoretical predictions, and the centreline plane density and density gradient contours were compared with the experimental Schlieren photographs.
6.0 RESULTS
6.1 Experimental flow visualisation
Figure 7 shows a sample comparison of the Schlieren images obtained during the period of stabilised flow for the  $\delta$ = 25° ramp angled, 40mm span wedge with (a) laminar and (b) turbulent boundary-layer flow. The upstream separation bubble is clearly seen in the laminar flow case, while the flow is seen to remain attached in the turbulent flow case. From these images, the separation and reattachment locations (on the centreline plane on which the features are seen) were then recorded and used for the theoretical drag predictions. The undisturbed (without any wedge present) boundary-layer thickness at the wedge foot location, h blw, was estimated from the Schlieren images as approximately 4.8 ± 0.2mm for turbulent flow and 2 ± 0.5mm for laminar flow.

Figure 7. Experimental Schlieren images, model W2540 (a) Laminar incoming boundary layer and (b) Turbulent incoming boundary layer.
Figures 8 shows the variation, with wedge l/t, of the experimentally estimated and computationally resolved location of separation, where it exists, on the flat plate ahead of the wedge. The turbulent flow for the 25° wedge was found to exhibit attached flow for all wedge spans investigated. For the separated flow cases, the location of upstream separation length ahead of the wedge corner increases as the span of the wedge increases. Likewise, the overall length of the separated shear layer was found to increase with increasing wedge span, but the rearward movement of the reattachment location was found to be only small compared with the much larger movement of the separation location. For the laminar 25° wedge cases, the match between CFD and the experimentally derived separation location (Fig. 8a) is seen to be very good (within less than 1 h blw). The same is true for the turbulent 40° wedge case. For the 40° wedge laminar flow case, however, the agreement was found to be not so good. While the general trend is correctly resolved, the numerically predicted separation location was found to be up to 16mm (8h blw) in error of that estimated from the Schlieren images. Remember that the Schlieren images provide information only on the flow on the centre plane of the plate, and that the separation will be highly 3D, as is seen in Fig. 16.

Figure 8. Variation of separation ahead of the wedge with wedge width, t, for the separated flow cases (a)  $\mathit{\delta}\ \text{=}\ \text{25}^{\circ}$, laminar, (b) $\mathit{\delta}\ \text{=}\ \text{40}^{\circ}$, laminar and (c) $\mathit{\delta}\ \text{=}\ \text{40}^{\circ}$, turbulent.
6.2 Theoretical drag predictions
The drag values obtained using Cheng’s theory were found to consistently over-predict the drag force coefficient on the wedge, particularly for the low span cases where it gave drag predictions over twice as high as the measured results. A comparison of the results, against experiment, given by the six combinations of simple theories showed that the best predictions were obtained using the SE + VD combination – shock-expansion theory (for the pressure drag) coupled with the van Driest method (for skin friction contribution), which was marginally better than using the HSB + VD combination. The theoretical predictions presented here are, therefore, only those obtained using the SE + VD combination, which is the one recommended for this application.
Figures 9 and 10 show the comparisons of the theoretically predicted drag coefficient with those obtained by experimental measurement from the sting balance (for Mach 8.2 flow) and those predicted by the steady Navier–Stokes solver. Figure 9 provides the comparisons for the 25° wedge, plotting the variation of the drag coefficient with wedge length-to-span ratio, l/t, for both laminar and turbulent cases for Mach numbers 8.2, 6.0 and 4.0. Figure 10 plots the same data for the 40° wedge, except for the Mach 4.0 case where the bow shock is fully detached (the maximum deflection angle for Mach 4.0 is 38.7°) and oblique shock theory cannot be used.

Figure 9. Comparison of drag coefficient versus wedge l/t.  $\mathit{\delta}\ \text{=}\ \text{25}^{\circ}$, Re $\text{=}$ 9 $\mathit{\times}$ 106/m. (a) $\textit{M}\ \text{=}\ \text{8.2}$, Laminar, (b) $\textit{M}\ \text{=}\ \text{8.2}$, Turbulent, (c) $\textit{M}\ \text{=}\ \text{6.0}$, Laminar, (d) $\textit{M}\ \text{=}\ \text{6.0}$, Turbulent, (e) $\textit{M}\ \text{=}\ \text{4.0}$, Laminar and (f) $\textit{M}\ \text{=}\ \text{4.0}$, Turbulent.
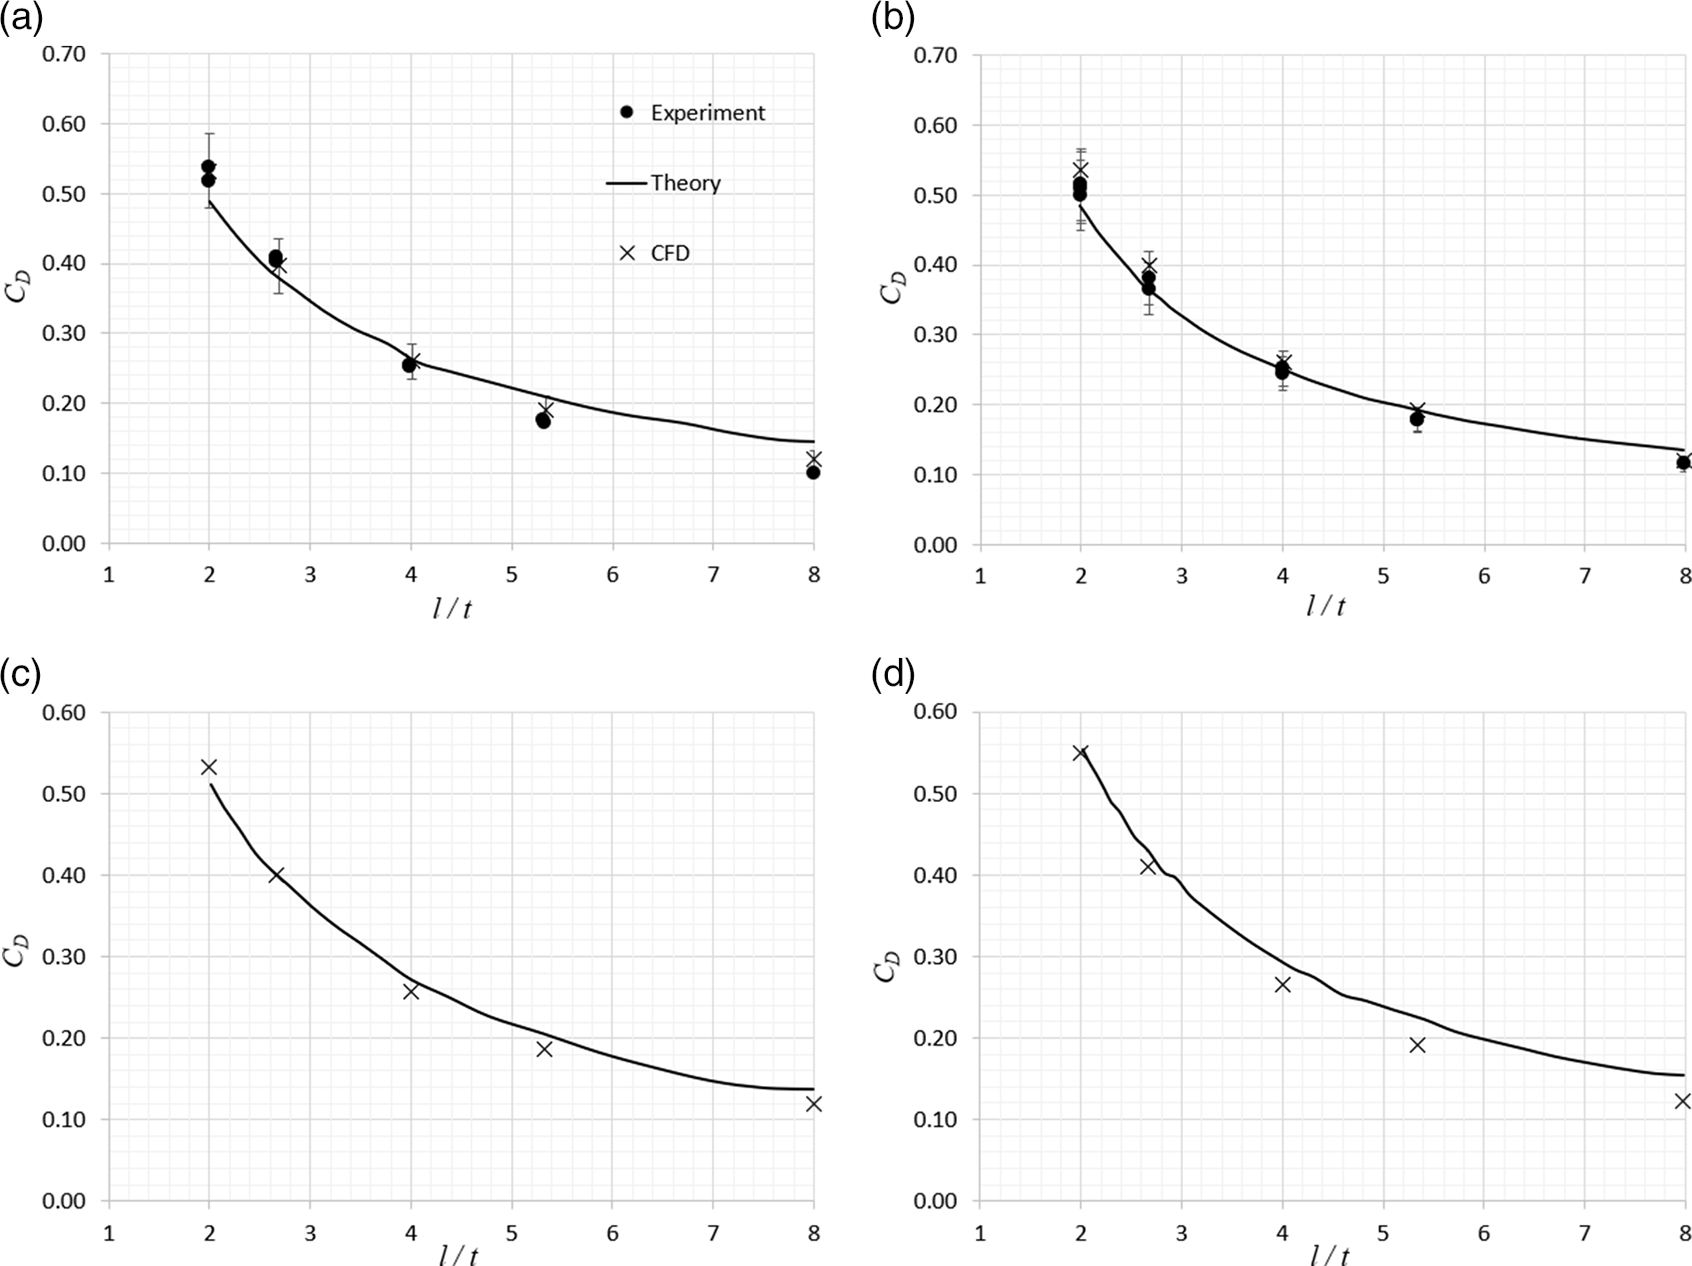
Figure 10. Comparison of drag coefficient versus wedge l/t.  $\mathit{\delta}\ \text{=}\ \text{40}^{\circ}$, Re $\text{=}$ 9 $\mathit{\times}$ 106/m. (a) $\textit{M}\ \text{=}\ \text{8.2}$, Laminar, (b) $\textit{M}\ \text{=}\ \text{8.2}$, Turbulent, (c) $\textit{M}\ \text{=}\ \text{6.0}$, Laminar and (d) $\textit{M}\ \text{=}\ \text{6.0}$, Turbulent.
For the 25° wedge in the Mach 8.2 flow, shown in Fig. 9(a) and (b), the theoretical approach appears to predict the experimental trend very well for both laminar and turbulent boundary-layer cases, certainly to a level that would be required for conceptual design analysis. Apart from the very highest value of l/t in laminar flow, the theoretical curve matches the experimental data within the bounds of experimental accuracy. The Navier–Stokes derived predictions of the drag coefficient at Mach 8.2 are also seen to be very close to the measured values – all being within the limits of measured accuracy. This validation at Mach 8.2 gives confidence that the steady CFD approach is good enough to capture the magnitude of drag coefficient for these types of flows past wedge fairings of different relative spans. For Mach 6.0 and 4.0, the comparisons are presented between the CFD predicted variation of C D with wedge l/t and the equivalent curve predicted using the present theory. It is seen that, at these lower Mach numbers, the theory provides good enough predictions for C D , albeit up to a maximum of about 35% higher than the CFD-derived value but generally no more than 10% higher, across the span-to-thickness ratio range.
For the higher 40° wedge in the Mach 8.2 flow, shown in Fig. 10(a) and (b), the agreement between the experimental measurements, the corresponding steady CFD-derived predictions and the curve generated using the theoretical method is seen to be very good, with the turbulent flow result showing marginally better agreement than the laminar result. The theoretical value of C D is seen to be within ±0.05 (generally within 10%, except for l/t = 8 where it is within 25%) of the experimental value. The CFD predictions are seen to be within 10% of the experimental measurement across the whole range of l/t. The comparison between the theoretical prediction and those obtained from CFD are plotted for Mach 6.0 in Fig. 10(c) and (d). There is no result for Mach 4.0, as the shock wave generated by the wedge for this case is fully detached and the theory is technically invalid. For the Mach 6.0 case, the agreement between the CFD-predicted drag coefficient and the theoretical value is also remarkably good, with the theory over-predicting the CFD value by 20% at worst.
Figure 11 shows that the drag coefficient is independent of the freestream Mach number and dependent only on wedge angle and slenderness ratio for all of the nominally attached shock-wave cases. The lower drag coefficient for the largest span 40° angle wedges at Mach 4.0 is due to the fact that the shock wave is detached in this Mach 4.0 condition, and the shock wave will sit much further away from the forward wedge surface with a resulting lower front surface pressure. For the more slender span wedges, the data collapse onto data obtained for the higher Mach numbers where the shock wave is nominally attached.

Figure 11. Comparison of CFD-resolved drag coefficient versus wedge l/t for different Mach numbers and boundary-layer states. (a) 25° wedge angle and (b) 40° wedge angle.
6.3 Flow structure: insight from CFD simulations
A steady RANS CFD approach was chosen as the basis for this study. Higher-fidelity unsteady scale resolving computational methods such as detached eddy simulation or large eddy simulation would resolve the flow in even better detail, but the steady RANS-based predictions were deemed to be good enough in capturing the important flow structure for the purposes of this study.
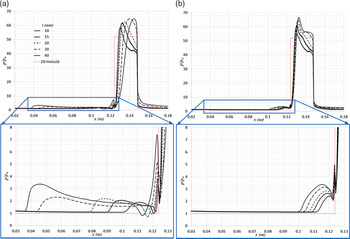
A sample comparison between the experimentally imaged flow structure on the plane cutting the centre of the wedge span (top) and the corresponding CFD-predicted flow (instantaneous density contours on the bottom) is shown in Fig. 12. The steady CFD solver is seen to have resolved both the overall structure and location of the major flow features very well. In particular, the upstream separation bubble and its associated separation shock wave have been resolved accurately. The agreement between CFD and experiment tended to be better for the turbulent cases because the very large separation bubbles encountered with a laminar interaction were not as well captured in the CFD simulations. The apparent agreement between the steady RANS-resolved flow structures and the corresponding experimentally imaged flows together with the agreement between the computed and experimentally measured drag coefficient suggest a reasonable level of confidence in the accuracy of the CFD method to resolve the trends in the variation of wedge centreline surface pressure with wedge span and the overall 3D structure of the flow around the wedge. Figure 13 compares the surface pressure distributions along the x-axis on the centre of the wedge span (z = 0) for all the 25° wedges. These are plotted for all wedge span cases, together with the theoretical 2D inviscid result from oblique shock-wave theory. Both laminar (on the left) and turbulent (on the right) cases are presented together with a zoomed-in view of the pressure rise, and subsequent plateau where one exists, on the flat plate ahead of the wedge apex. A similar plot for the 40° wedge cases is shown in Fig. 14.

Figure 12. CFD-resolved variation of centreline surface pressure distribution with wedge width,  $\textit{M}\ \text{=}\ \text{8.2}$, $\mathit{\delta}\ \text{=}\ \text{25}^{\circ}$, Re $\text{=}$ 9 $\mathit{\times}$ 106/m.

Figure 13. CFD-resolved variation of centreline surface pressure distribution with wedge width,  $\textit{M}\ \text{=}\ \text{8.2}$, $\mathit{\delta}\ \text{=}\ \text{25}^{\circ}$, Re $\text{=}$ 9 $\mathit{\times}$ 106/m. (a) Laminar and (b) Turbulent.

Figure 14. CFD-resolved variation of centreline surface pressure distribution with wedge width,  $\textit{M}\ \text{=}\ \text{8.2}$, $\mathit{\delta}\ \text{=}\ \text{40}^{\circ}$, Re $\text{=}$ 9 $\mathit{\times}$ 106/m. (a) Laminar and (b) Turbulent.
In the case of laminar flow on the  $\delta$ = 25° wedge, the predicted pressure rise on the plate ahead of the wedge apex is seen to move further upstream as the span of the wedge increases, indicating the upstream extension of the separation line on the plate with increasing wedge span. The CFD-predicted pressure distribution on the wedge inclined forward surface is also seen to be highly sensitive to the span of the wedge. For the longest span wedge, the pressure plateaus, following the overshoot due to reattachment of the separation bubble, recover to a level which is marginally above the 2D inviscid theoretical value. As the span is reduced, the 3D spanwise flows from either edge of the wedge begin to affect the flow on the centreline, and a favourable pressure gradient begins to develop before the expansion onto the top of the wedge. For the turbulent flow cases, the boundary-layer remains attached up to the apex of the wedge and the pressure rise is a result of the shock wave/boundary layer interaction. There is seen to be a small increase in the local pressures through this rise with increasing wedge span. The same trend of increasing favourable pressure gradient on the inclined front face of the wedge after the shock, with decreasing wedge span, is also seen in this case.
For the  $\delta$ = 40° cases, the CFD-computed surface pressure distribution on the wedge centreline is plotted for both the laminar and turbulent case, in Fig. 14, together with the corresponding theoretical inviscid 2D result. Now both the laminar and turbulent boundary-layers ahead of the wedge apex are separated, and both sets of pressure distributions exhibit the pressure overshoot associated with the reattachment of a separated boundary layer. The wedge shock wave will be much stronger than that experienced at the lower wedge angle, and as a result, the separation bubble ahead of the wedge apex is seen to be considerably larger for the laminar flow, indicated by the considerable upstream movement of the initial pressure rise on the flat plate (see Fig. 14b, inset). This is due to the accentuated effect of this pressure rise being fed upstream through the subsonic portions of the boundary layer on the plate.
The CFD predicts an interesting effect of the extent of the separation bubble on the post-shock-wave pressure rise for the laminar cases. For the largest span wedge, the peak pressure is seen to occur almost at the highest point on the inclined front face, S 1. Detailed scrutiny of the CFD solution indicates that for this extreme t = 40mm case, closest to 2D behaviour, the reattachment of the separation bubble is very close to the top of this surface, giving no space for any significant recovery of pressure before the expansion of the flow onto the top surface, S 2, parallel to the flat plate. In this condition, most of the inclined front face will experience separated, relatively low speed, reverse flow. Reducing the span of the wedge moves the reattachment location, and its corresponding pressure peak, to a lower/further forward position on the front face, progressively allowing more space for the favourable pressure gradient to appear and the pressure to recover. As with the  $\delta$ = 25° cases, the 3D effects caused by the spanwise flows from the side edges of the wedge, increasingly affect the centreline pressure distribution as the wedge span is reduced and the geometry becomes more slender. This is seen as the pressure recovering towards a level much below the 2D inviscid theoretical level, before the flow expansion onto surface S2.
The corresponding turbulent pressure distributions for this highest wedge angle are seen to be more much similar to those seen for the  $\delta$ = 25° wedge flows, where the reattachment locations on the centreline of the model span, defined by the peak pressure, are much closer together and at a much lower, forward position on the front surface. In this case, the pressure distribution for the largest span model exhibits a pressure plateau following the pressure overshoot that is significantly higher than that predicted using 2D inviscid oblique shock theory. As the span is reduced, the same extended region of favourable pressure gradient develops, which is a result of the successive effect of the spanwise flows from the model sides disturbing the flow on the wedge centreline.
The flow structures for an attached boundary-layer case and for an upstream separation case, as resolved in the CFD simulations for Mach 8.2, are plotted for two cases in Figs. 15 and 16, respectively. These images plot the contours of vorticity magnitude at an instant, along with the surface skin friction lines on the flat plate. For the attached interaction case (model W2510, with turbulent boundary layers), shown in Fig. 15, there is no upstream separation. The only separation is due to the formation of a vortex emanating from the wedge-plate corner. On the wedge, another pair of vortices are seen to form from the separations at the sharp edge between the sides and the inclined front face, which then grow as they expand onto the top surface. The flow structure for the upstream separation case is shown in Fig. 16, where the base of this locally detached bow shock forms a separation shock wave seen in the 2D Schlieren images. The flow structure in such cases is altogether more complex than that encountered with no upstream separation. Here the shock-induced separation line on the flat plate ahead of, and around the sides of, the wedge is clearly evident, as well as high levels of vorticity in the separation region ahead of the wedge.

Figure 15. CFD solution – contours of vorticity magnitude. Model W2510, Turbulent oncoming boundary-layer. Here, the shock wave is attached at the base of the wedge.

Figure 16. CFD solution – contours of vorticity magnitude. Model W4020, Laminar oncoming boundary-layer. Here, the flow is separated ahead of the wedge apex.
Also evident is the vorticity associated with the shear layer reattachment high up on the inclined front face. The corner junction vortex is still evident, but this is seen to have been moved further outboard by the formation of a large bow vortex acting along the wedge side surfaces, which is associated with the primary shock-induced separation on the flat plate surface. This predicted flow structure is in agreement with those observed in previous studies, as was depicted in Fig. 2, except that the bow vortex is much further inboard in this particular case.
7.0 CONCLUSIONS
A semi-empirical model for the drag force acting on a wedge-like fairing in super- sonic/hypersonic flow, mounted on a flat plate or a surface of relatively low curvature, has been developed. Wedges with l/t up to 8 are mildly affected by 3D effects such that they can be modelled by 2D flow approximation. The combination of the shock-expansion and van Driest (SE/VD) model provides accurate estimates for nose drag and skin friction drag on the sidewalls.
This has been experimentally validated for the case of a Mach 8.2 flow with both a laminar and a turbulent oncoming boundary-layer state, and validated against Navier–Stokes computations for Mach numbers of 6 and 4, for the same Reynolds number. Total drag decreases with slenderness ratio and remains largely independent of Mach number and oncoming boundary-layer state. Drag increase due to separation is sensitive for wedges with slenderness ratios below 5. Pressure rise upstream of the wedge foot is sensitive to wedge span in separated flows with oncoming laminar boundary layer, whereas turbulent momentum and energy exchange in the separation bubble limit the extent of shock foot movement. Pressure overshoot peaks at the reattachment point, following which the pressure recovery to 2D inviscid levels gradually improves in wider geometries.
CFD analysis shows that the high-speed flows associated with this class of geometry are both complex and highly sensitive to the span of the wedge, whereby spanwise flow effects due to the tip Mach cones, but also the vortices that develop from the edges, significantly alter the wedge centreline surface pressures from the classic 2D theoretical result predicted using oblique shock/expansion theory. Small-scale turbulent momentum and energy exchanges are sufficiently represented by two-equation turbulence models (k–ε,  $k{-}\omega$ SST), providing detailed vortical structures along the corner and sharp edges and primary and secondary separation and reattachment lines within the bow shock region in separated flows. Base pressure recovery to freestream levels improves with slenderness ratio and Mach number(Reference Swantek and ustin22). Pressures in wide wedges (x/t = 2) are about twice the freestream pressure levels (p/p ∞ = 2). Experimental measurement of base pressures will corroborate these estimates, although the theoretical models for base pressure are analogous to boundary-layer separation models that are sufficiently and accurately represented by CFD simulations.


 Open access