


High consumption of sugar-sweetened beverages (SSB) contributes to a myriad of deleterious health outcomes, including dental caries(Reference Bleich and Vercammen1), obesity(Reference Malik, Schulze and Hu2) and type 2 diabetes(Reference Malik, Popkin and Bray3). High-, middle- and low-income countries have demonstrated high consumption of SSB(Reference Singh, Micha and Khatibzadeh4) leading to the enactment of public health policies at both government (e.g., taxes or levies)(Reference Backholer, Vandevijvere and Blake5) and organisational levels (e.g., reduction or removal from schools and hospitals)(Reference Taber, Chriqui and Powell6,Reference Niebylski, Lu and Campbell7) .
Organisational-level policies have been popular in settings frequented by children and/or that have underlying interests in health promotion(Reference Crisp and Swerissen8). Health-promoting settings such as health services, parks, local councils and sports, recreation and aquatic centres are optimal places to enact policies aimed at encouraging healthy eating, as they are already engaged in other health-related activities, have population reach and may have influence over food retailers in their purview(Reference Crisp and Swerissen8). A common strategy employed in the pursuit of healthier food environments is addressing the availability of healthy and unhealthy options(Reference Caspi, Sorensen and Subramanian9) by changing the range of products (i.e., the number of different varieties) and/or the number of units visible to customers (i.e., the number of slots filled in a vending machine)(Reference Hollands, Carter and Shemilt10).
Evaluating public health initiatives on dimensions beyond effectiveness (i.e., reach, implementation) contributes a more holistic assessment of their population and/or community impact and provides valuable insights for further uptake or adaptation(Reference Glasgow, Vogt and Boles11). There is some evidence demonstrating the successful implementation of availability-based interventions in individual centres with outdoor pools(Reference McGrath and Tinney12), on a short-term basis in pools(Reference Olstad, Goonewardene and McCargar13), or in response to the release of government guidelines aimed at creating healthier sport and recreation centres(Reference Olstad, Downs and Raine14). A 2015 evaluation of a policy that increased healthier food and drink offerings in forty-two Australian sports clubs found no impact on the availability of targeted beverages (including water and diet soft-drink) compared to forty-four control clubs, although measures of unhealthy option availability not reported(Reference Wolfenden, Kingsland and Rowland15). So far, there is yet to be an examination of implementation of an initiative targeting the reduction of unhealthy drink options across multiple centres.
While the potential public health nutrition benefits of availability changes have been demonstrated, there remain perceived risks in undertaking shifts to healthier food and drink offerings, including how feasible implementation of such a venture is(Reference Kelly, King and Bauman16,Reference Thomas and Irwin17) , and a fear of customer dissatisfaction and drop in sales(Reference Thomas and Irwin17). Furthermore, there is currently insufficient evidence regarding the impact of policies focused on the removal of unhealthy drinks on the healthiness of the food environment across multiple sports centres. Filling this literature gap is particularly important when considering that many sports and recreation policies are adapted from existing government-produced guidelines that tend to focus on the removal and reduction of unhealthy options as well as an increase in healthier items(18,19) .
Complementing evidence of extent of policy implementation with measures of customer acceptability aids the development of interventions that are acceptable to an organisation’s client base and contribute to overall understandings of the feasibility of policy implementation(Reference Eckert and Hintze20). Previous research has demonstrated high acceptability of healthy changes to menu(Reference McGrath and Tinney12) and high support for government restrictions of unhealthy options in children’s sports settings(Reference Kelly, Chapman and King21); however, this evidence is limited to measures in single recreation centres(Reference McGrath and Tinney12) or is over 10 years old(Reference Kelly, Chapman and King21).
In late 2014, YMCA Victoria (YMCA), an Australian aquatics and recreation provider, announced the introduction of a Healthy Food and Beverage Policy that would cover, among other settings, all food outlets and vending machines within its aquatic and recreation centres. YMCA aimed to implement the policy over a 3-year period from 2015 to 2017. Part of this policy was an SSB-reduction initiative that aimed to remove all SSB (excluding sports drinks) in the first year of implementation, by December 2015. While previous research has examined the impact of the initiative on customer purchasing behaviour(Reference Boelsen-Robinson, Orellana and Backholer22), closer examination of elements of feasibility may guide other organisations on their approach and resourcing in implementing similar initiatives. In particular, conducting a nuanced assessment of implementation can inform future expectations and goal-setting, while evidence on customer acceptability can help allay organisational and staff fears of a negative reception and guide a communications strategy promoting the initiative.
Aim
To assess the extent of implementation and customer acceptability of implementing an SSB-reduction initiative in YMCA aquatic and recreation centres.
Methods
Organisation and initiative description
YMCA is a community not for profit organisation that operates aquatic and recreation centres on behalf of Local Government in Victoria, Australia. In 2015, YMCA managed seventy-five aquatic and recreation centres across Victoria. These centres provide a variety of amenities, including sports stadiums, pools, gymnastics studios and/or gym facilities. In addition, a number of centres have internally managed food outlets that range from full-service cafes with food preparation facilities, canteens that offer some hot, pre-made food, to kiosks which offer primarily packaged options. This paper focuses on an initiative to reduce the availability of SSB across all YMCA aquatic and recreation centres. YMCA head office adapted the SSB-reduction initiative from the state-government developed Healthy Choices Framework, which included policy guidelines and a food and beverage classification guide(18,23) . Managers and staff at each centre were responsible for introducing and maintaining new drink options and fridge displays. YMCA head office supported centres in delivering the initiative through a toolkit that aimed to raise awareness and build capacity in staff based on the four P’s of marketing: including an approved product range, fridge display ‘planograms’ to guide drink placement, promotional material such as infographic posters, social media kits and factsheets for staff, and a recommendation that water was the lowest priced item. The SSB-reduction initiative was promoted as a ‘soft-drink free summer campaign’ to staff and customers by head office. While all SSB (excluding sports drinks) were expected to be removed from cafes and kiosks (including iced teas, large flavoured milks, fruit juices larger than 250 ml, fruit drinks with less 99 % fruit juice), there was a particular focus on ‘soft-drinks’, namely sugar-sweetened carbonated beverages. The focus on ‘soft-drinks’ was chosen by YMCA head office as these products contained the highest amount of sugar out of the existing product range and were one of the most popular products, particularly among children.
YMCA was one of the first aquatic and recreation providers to introduce a healthy food policy in the State of Victoria(24,Reference McArthur25) . Furthermore, YMCA operated in a complex business environment, wherein they were contracted to manage Local Government owned facilities, were bound by supplier contracts and in some centres food retail was outsourced to external café operators. Additionally, centres relied on the income from café and canteen sales to fund programmes and services and managers were concerned about the financial impact of the policy. Acknowledging these factors, YMCA head office adopted a phased approach to policy implementation, which began with a ‘small change, big impact’ strategy (the ‘soft drink free summer’ campaign) to counter any resistance to change among stakeholders. Sports drinks, the highest selling item in many centres, were excluded from the first phase and earmarked for removal the following year.
Implementation occurred over 1-year period from December 2014, to be completed by the beginning of December 2015 (Fig. 1). The initiative has been previously described in detail(Reference Boelsen-Robinson, Orellana and Backholer22).

Fig. 1 Timeline of initiative implementation and data collection. ![]() , pre-implementation period;
, pre-implementation period; ![]() , implementation period;
, implementation period; ![]() , post-implementation period
, post-implementation period
Overview of methods
Two data sources were used to assess implementation and customer acceptability of the initiative. Implementation was assessed using a checklist audit from photographic information on the type of drinks available at one time point pre-implementation (May–June 2014) and at one time point post-implementation (May–June 2016; see Fig. 1). Customer acceptability was measured using exit surveys that were collected at 14 months following the initiative implementation (January–February 2017). This time point was chosen as it gave customers sufficient exposure to the changes in the availability of SSB and was the busiest time period for centres allowing for a large number of surveys to be collected.
Extent of initiative implementation
Centres were selected for inclusion in our study if they had a food outlet on the premise that sold pre-packaged beverages including soft-drinks and had an internal checklist audit (described in the following paragraph) conducted pre-implementation (during May–June 2014) and post-implementation (May–June 2016).
Photos of drink fridges were taken by head office, centre staff members or volunteers and uploaded to a central database, following instructions composed by YMCA head office. The photos were then assessed by YMCA head office and volunteers using a pre-existing data collection form (referred to as the ‘checklist audit’) where the name and variety of each drink available were recorded. From this, the research team assessed the Healthy Choices rating of ‘green’ (best choice), ‘amber’ (choose carefully) and ‘red’ (limit intake) for each item using the Healthy Choices classification guide criteria, which is based on the presence of added sugar, serving size, kilojoule and milk content(26). Products were identified as sports drinks when their product name included ‘sports drink’.
To ascertain the extent of implementation, centres were classified as either: (1) not soft-drink free, (2) soft-drinks removed but other SSB available (excluding sports drinks) or (3) all SSB removed (excluding sports drinks) at post-implementation.
We estimated the change in the number of different varieties of ‘red’, ‘amber’ and ‘green’ drinks available from the pre- to the post-implementation period using paired t tests and reported 95 % CI (Stata version 14.1). We conducted this additional analysis as measuring the extent of initiative implementation may not indicate the overall change in the healthiness of the food environment. For example, if the number of ‘red’ sports drinks varieties increased following the removal of all other SSB, this may mean that the initiative was successfully implemented but, in reality, did not create a healthier food environment for YMCA customers and staff. Furthermore, measuring the removal of SSB does not give an indication of how the availability of healthier beverages may have changed.
We conducted a number of sub-analyses to determine heterogeneity in the extent of initiative implementation and identify if any types of centres or food outlets experienced challenges in implementing the initiative and who may require additional support. Analyses were stratified by the following variables: the presence of a pool, stadium and recreation facilities (as these may be frequented by different patron groups, i.e., stadium patrons are likely to be older children/teenagers); socio-economic position (SEP) of the area in which the centre was located; type and revenue size of the food outlet.
Customer perspectives
Centres were chosen for customer surveys if they had large attendance numbers (as nominated by YMCA), full-service cafes on site, provided year-round children’s swimming lessons (to capture parents’ perspectives) and were located in metropolitan Melbourne. Centres located in areas of different SEP were chosen to capture a wide range of perspectives on the acceptability of the SSB-reduction initiative.
The survey used was an extension of a survey previously used by this research team(Reference Boelsen-Robinson, Chung and Khalil27). For the current study, four additional questions were added to the previously used survey. The first three of these added questions asked patrons to: (1) report on their awareness of the SSB-reduction initiative, (2) whether they thought it would affect soft-drink consumption and (3) whether YMCA should continue with the initiative. Question 1 answer options were yes or no. Questions 2 and 3 could be answered on a 5-point Likert scale ranging from ‘strongly agree’ to ‘strongly disagree’. Pearson chi-squared tests were used to assess whether responses differed according to a number of customer characteristics including the centre attended, customer age range, gender, SEP of customers home postcode and the presence of at least one child with them. SEP was assessed by postcode tertile, using Socio-Economic Index for Areas Index of Relative Socio-Economic Disadvantage(28). However, only 5 % of respondents fell into the lowest tertile. Postcodes were subsequently re-categorised into high (bottom half of Socio-Economic Index for Areas Index of Relative Socio-Economic Disadvantage) and low (highest measurers of Socio-Economic Index for Areas Index of Relative Socio-Economic Disadvantage) SEP. Note that customers surveyed may live in a postcode with a different SEP from the SEP of the centre they attend.
The fourth question was an open-ended question where customers were asked to report any perceptions, experiences or opinions they had regarding the SSB-reduction initiative. Comments were transcribed verbatim by data collectors and analysed by the lead author using a combination of deductive and inductive thematic coding where data were coded using a combination of pre-determined codes describing the overall reaction to the initiative (positive, neutral, negative), as well as codes emerging from the dataset (open-coding).
Surveys were conducted over 9 d in January and February 2017. Two data collectors were present on each day (AUTHORS BLINDED), using electronic tablets to collect survey responses through the QuickTapSurvey software application(29). Every third exiting patron estimated to be over the age of 17 was approached to participate, with data collectors confirming age as a first question for any patrons estimated to be below the age of 25.
Results
Results are presented in two sections. Firstly, the checklist audit which details the extent of initiative implementation measured by the change in soft-drink availability, and in ‘red’, ‘amber’ and ‘green’ drink availability in thirty centres. Secondly, the customer survey results from three centres which include the degree of acceptability and awareness of the initiative, as well as a thematic analysis of free-text responses from customers.
An overview of centre characteristics is available in the online supplementary material, Supplemental Table 1. Individual centre characteristics are not presented to maintain anonymity of centres. Thirty centres were included in this implementation evaluation (Fig. 2). The majority of the centres excluded for not having two time points were swimming pools (n 25), which are only open to the public during the hotter months (November–March) and therefore did not take part in the audits.
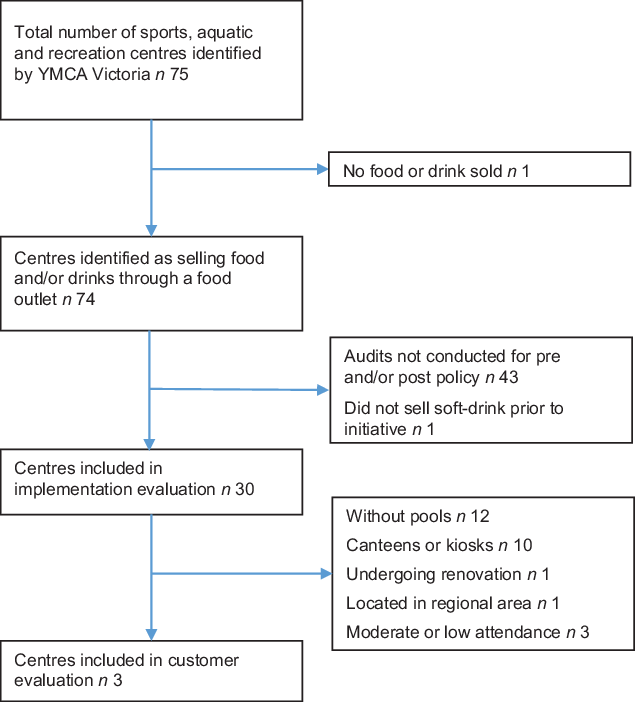
Fig. 2 Centre selection for implementation and customer evaluation
Extent of initiative implementation: removal of soft-drinks
At post-implementation, ten of thirty centres had met the SSB-reduction initiative goal of removing all SSB (excluding sports drinks) (33 %; Fig. 3). A further sixteen centres had removed all soft-drinks, resulting in a total of twenty-six centres being soft-drink free (87 %). The proportion of centres that implemented the initiative was greater among centres that had a kiosk compared to centres with full-service cafes or canteens. There did not appear to be any difference in the proportion of centres that had fully implemented the initiative according to any other variable of interest. Figure 3 provides a descriptive measure of the results when examined by different variables of interest, including the presence of recreation facilities, pool and/or stadium; the SEP of the location of the centre; the type of food outlet in the centre and the revenue of the café.

Fig. 3 Degree of initiative implementation by centre and food retail characteristics at post-implementation. ![]() , not soft-drink free;
, not soft-drink free; ![]() , soft-drink free;
, soft-drink free; ![]() , sugar-sweetened beverage free (excluding soft drinks)
, sugar-sweetened beverage free (excluding soft drinks)
Extent of initiative implementation: change in drink varieties available
The variety of all packaged drinks per centre decreased by 4·5 over the study period (95 % CI −7·2, −1·8), from 18·4 drinks per centre at pre-implementation. The range of ‘red’ drink varieties available pre-implementation ranged from 2 to 22, with an average of 11·9 per centre. By post-implementation, centres had reduced the number of red drinks varieties on average by 4·4 (95 % CI −6·2, −2·6) (Fig. 4). Even centres that did not meet the initiative had reduced their availability of ‘red’ drink varieties (−3·8, 95 % CI −6·1, −1·5). Centres with full-service cafes had on average a greater variety of ‘red’ drinks available at the pre-implementation data point (15·1) compared to kiosks (10·9) and canteens (10·2). A description of pre-implementation availability of ‘green’, ‘amber’ and ‘red’ drinks is available in the online supplementary material, Supplemental Table 2).

Fig. 4 Mean change in number of drink varieties available from pre- to post-implementation, by healthiness classification. *Significant P < 0·05, NS, non-significant
Stratification by variables of interest revealed that for centres with canteens, there was no change in the number of ‘red’ drink varieties available (n 13, −3·3, 95 % CI −6·7, 0·1), compared to centres with a cafe or kiosk. Five of the twelve centres that had canteens demonstrated either no change or an increase in the number of ‘red’ drink varieties available. Compared to the pre-implementation period, there was either no change or an increase in the total number of ‘red’ drinks available in the post-implementation in eight centres. Of these, seven had removed soft-drinks, but other ‘red’ drinks were stocked in their place. Examination of drinks in these centres showed that a number had added products marketed as ‘healthier’ alternatives, such as ones with natural added flavouring, that are classified as ‘red’ drinks. ‘Red’ drinks that remained included large juices or fruit drinks, large flavoured milks and iced tea.
The number of ‘amber’ drink varieties did not change pre- and post-initiative implementation (−1·20, 95 % CI −2·65, 0·25), which was consistent for all stratified sub-analyses.
At pre-implementation, availability of ‘green’ drink varieties ranged from 1 to 9, with the average being 3·1. Centres increased their stocking of ‘green’ drink varieties by an average 1·4 at post-implementation (95 % CI 0·3, 2·4). Fifteen centres did not change or decreased the variety of ‘green’ drinks over the period of the study. When stratifying analyses by the type of food outlet, the number of ‘green’ drink varieties significantly increased in centres with canteens (2·08, 95 % CI 0·29, 3·86) following implementation, but not in centres with cafes or kiosks. The change in number of ‘green’ drink varieties pre- and post-initiative implementation did not differ for any other stratified sub-analyses.
Customer perspectives
Surveys (n 806) were conducted at three different centres that encompassed centres located in areas of different SEP (Table 1). Two of the centres had removed soft-drinks at the time of data collection. Centre 2 had not removed all soft-drinks when surveys were conducted but had reduced the variety of soft-drinks available.
Table 1 Recruited centres for customer surveys
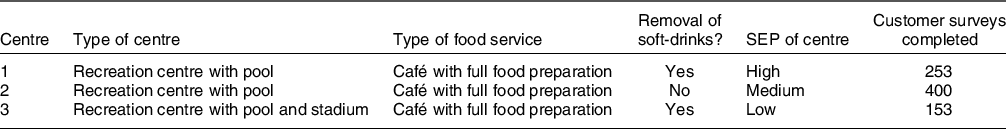
SEP, socio-economic position.
At all three centres, customers were largely unaware of the existence of the SSB-reduction initiative (90 %). The proportion of customers who noticed the change was greater for those living in low SEP areas (14 %) compared to those living in high SEP areas (8 %).
Eighty-four percentage of those surveyed strongly agreed or agreed with the statement that the ‘soft-drink free initiative would reduce soft-drink consumption in the community’, with no observed differences between sub-groups.
Furthermore, 89 % strongly agreed or agreed that YMCA should continue with the initiative. A greater proportion of women compared to men were supportive of the initiative (92 %, 85 % respectively), with no other demographic differences observed. Centre 2 respondents were less likely to agree that the initiative should continue (87 %) compared to customers from Centre 1 (94 %) and Centre 3 (91 %).
Of the 806 customer responses, 227 (28 %) further commented on their perceptions, experiences and/or opinions of the SSB-reduction initiative. Fifty-three percentage of free-text comments were positive, 21 % neutral and 29 % negative (sum is more than 100 % as some participants made multiple comments). Thematic analysis of customer responses revealed four main themes: health, affirmation of initiative, efficacy of the initiative and responsibility and choice, with sub-themes under each of these (see Table 2).
Table 2 Themes and sub-themes emerging from an open-ended survey question regarding customer perceptions, experiences and opinions of the SSB-reduction initiative (n 227)
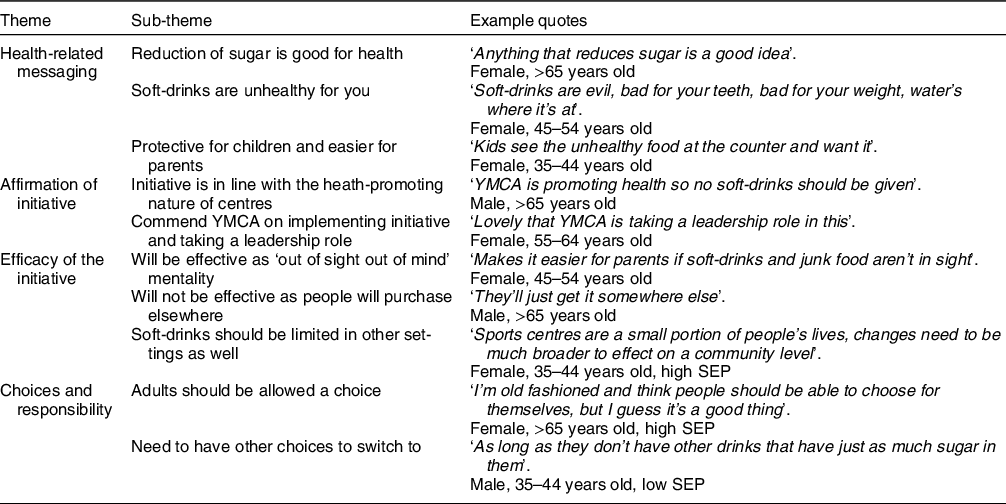
Participants frequently commented on the deleterious health outcomes of soft-drinks and high sugar consumption, and that soft-drinks had high sugar content. In particular, many viewed the initiative as being protective for children, while allowing parents to avoid being pestered for it by their children. Respondents also noted that other drinks that remained had similar amounts of sugar (e.g., juice). A minority of surveyed customers believed that those visiting the centre were unlikely to drink soft-drink or were able to compensate the calories from SSB consumption with physical activity.
The initiative was viewed as being in line with the health-promoting ethos of the centres, and that it was inconsistent to sell soft-drinks in the first place. Some respondents believed further healthy changes could be made in the centre and in other settings. Many respondents commended YMCA for implementing the initiative.
There were divergent views as to the efficacy of the initiative. Participants noted that it was likely to be effective due to an ‘out of mind, out of sight’ mentality that often related to children asking for the soft-drinks. However, a large number held the view that visitors would engage in compensatory behaviour and purchase the unavailable soft-drinks at another location. Despite many participants not believing it would be effective, they nonetheless supported YMCA in implementing such an initiative.
Participants frequently commented on different elements around the notion of choice. Choice was closely entangled with the concept of responsibility, where participants stated that individuals had a responsibility to make the healthy choices for themselves, and the right to engage in unhealthy behaviours if they chose to. There were tensions between the desire for choice and the idea that removing soft-drink enabled them to live healthier lives.
Discussion
Our study is the first to assess the extent of implementation of an SSB-reduction initiative across a large number of Australian aquatic and recreation centres. One-third of the centres included in our analysis met the initiative’s aim of removing all SSB (excluding sports drinks) at post-implementation, with a further 54 % having removed all soft-drinks as well. The number of ‘red’ drink varieties decreased by an average of 4·4 drinks per centre, while ‘green’ varieties increased by 1·4 drinks on average from pre- to post-implementation periods. Combined with consistent high customer acceptability, the current study demonstrates that a healthy drink policy is likely to be feasible in a variety of sports and recreation centres.
Our findings that a healthy drink initiative resulted in the decrease of unhealthy drink varieties and an increase in healthy drink options are similar to that of a Canadian study where capacity-building support to implement a healthy food policy resulted in an increase in the number of healthy products (pre – 11 %, post – 15 %), and fewer unhealthy products (pre – 46 %, post – 56 %) within sport centre vending machines(Reference Naylor, Olstad and Therrien30). However, the results from our study are in contrast to an Australian randomised control trial conducted in sports clubs that aimed to increase the availability of healthier beverages, which reported no change in the availability of healthy drinks (water and diet soft-drinks) in forty-two intervention clubs compared to forty-three control clubs(Reference Wolfenden, Kingsland and Rowland15). The divergence of results may be due to different levels of support offered. For example, while sports clubs in the study by Wolfenden et al. (Reference Wolfenden, Kingsland and Rowland15) were provided with a support officer for contact, there is no mention of support in identifying healthier options. In contrast, YMCA head office took a role in identifying healthy drink options and communicating these to centres.
Although centres received support in identifying healthier drink options, the magnitude of increase in ‘green’ drink variety was two-thirds less than the decrease in ‘red’ drink variety. The limited increase in variety of ‘green’ drinks may reflect minimal supply options of packaged healthy drink alternatives, which has been identified as a barrier to implementation in previous food retail interventions(Reference Andreyeva, Middleton and Long31). Additionally, YMCA was bound by a beverage supply contract, which limited the variety of alternative healthier drink options available. Given the consumer concern with healthy drink availability, identifying and establishing supply of acceptable and varied healthy alternatives should be a key focus of organisations seeking to implement similar policies. For small organisations, finding suppliers who are willing to fill small orders(Reference Gittelsohn, Laska and Karpyn32) or exploring options to form co-operative buying groups may offer solutions to issues with limited buying power.
The type of centre food outlet appeared to influence implementation; centres with kiosks were more successful at implementing the initiative than other café types, in particular full-service cafes. Centres with canteens experienced on average no decline in the number of ‘red’ drinks available, despite eleven of twelve canteens removing soft-drinks. Examination of available options showed that a number of added beverages were ones with natural added flavouring that are however still SSB. The rapid pace of change in drink products, flavours and formulations that is occurring in the packaged beverage market(33,34) required frequent updates to approved product ranges and confusion between marketing messages from the drinks supplier and YMCA head office and centre staff. While traditional ‘soft-drinks’ may be easily identified as unhealthy, centres may require additional nutrition expertise support in identifying healthier drink alternatives as they emerge. Further studies may seek to conduct qualitative research into the difference in implementation between centres and different contexts to investigate why some settings are more successful than others. For example, interviews or focus groups with centre staff and managers may elucidate context-specific barriers or facilitators that may aid implementation in other settings, whether they be in sports and recreation or other contexts. Future research may also seek to examine supplier marketing and promotional strategies aimed at retailer to determine whether this is limiting the identification of healthy alternatives.
Our result of high customer acceptability of the SSB-reduction initiative echoes previous research examining sports and recreation patrons’ perspectives on healthy food and beverage policies. McGrath et al. (Reference McGrath and Tinney12) found that 86 % of surveyed outdoor pool visitors were supportive of changes to increase the availability of healthier menu offerings. The importance of protecting children from SSB found in our study supports previous research where restriction of unhealthy options is supported in settings heavily frequented by children, such as in children’s sporting venues(Reference Kelly, Chapman and King21) and schools(Reference Pescud, Donovan and Pettigrew35). These results reveal that framing policies around the protection of children may resonate and be more acceptable than policies framed as being aimed at the general populace. The majority of attendees did not notice the policy (90 %). This may be due to the low use of the centre food outlets on average: less than 20 % of sport and recreation attendees purchased items from the centre food outlets in previous research conducted in the same setting(Reference Boelsen-Robinson, Chung and Khalil27). Customer surveys were conducted following the implementation of the initiative – however, they can also be conducted prior to implementation to gauge acceptability and engage organisations who are concerned about customer backlash.
The strengths of the current study include the measurement of implementation of the initiative across a large number of centres. This allowed us to explore the heterogeneity of key potential influences of implementation capacity. A limitation of the current study is that pre-implementation measures were conducted over a number of months, due to the large number of participating centres, rather than at one point in time. The baseline menu audits were completed by registered nutritionists or third year nutrition students on university placements. However, the post-implementation measures were reliant on YMCA centre staff taking drink fridge photos for the audit. This method may have limited the reliability of the measurement as staff may have an interest in meeting the initiative requirements. However, this is an example of working in the constraints of real-world research. Customer surveys were conducted at large centres in metropolitan areas and perspectives may not be generalisable to sports centres in different contexts or be representative of the broader Australian population. However, previous studies have indicated support across the population for healthier food environments in child-focused settings(Reference Pescud, Donovan and Pettigrew35).
The low awareness, high acceptability and demonstrated feasibility of these policies indicate that they are likely to be easy wins for increasing the healthiness of community food environments, a fact reflected in the large number of local government initiatives aimed at this setting(18,19) . These results build on evidence of this initiative’s effectiveness in reducing unhealthy drink purchases as explored previously(Reference Boelsen-Robinson, Orellana and Backholer22).
Conclusion
Our study is the first to assess implementation of an SSB-reduction initiative in a large number of Australian aquatic and recreation centres. Strong compliance in removing soft-drinks and high customer acceptability indicates that a targeted policy is feasible and likely to create healthier community food and beverage environments. Implementation is likely to require support in identifying the nutrition content and healthiness of drinks and in sourcing a variety of healthy alternatives.
Acknowledgements
Acknowledgements: The authors would like to thank Stephen Bendle, Stella Cifone and the YMCA centre managers and staff. Financial support: The current study was funded in part by VicHealth. VicHealth has no role in the design, analysis or writing of this article. T.B.R. is supported by a National Health and Medical Research Council Centre for Research Excellence grant (APP1152968) and a grant from The Australian Prevention Partnership Centre. A.J. is supported by YMCA Victoria. A.K. is supported by the Alannah and Madeline Foundation. O.H. is supported by research funding from the Victorian Health Promotion Foundation (VicHealth). B.G. is supported by the Cancer Council Victoria. K.B. is supported by a National Heart Foundation of Australia Future Leader Fellowship (GN 102047). M.R.B. is supported by an Institute for Health Transformation Post-Doctoral Fellowship. A.C. is supported by an Australian Government Research Training Program Scholarship. A.P. is supported by a National Health and Medical Research Council fellowship (GNT1045456) and Deakin University. Conflict of interest: Professor Peeters has received funding from Melton and Wyndham city councils to conduct evaluations of healthy food policies. Ms Kurzeme was previously, and Ms Jerebine is currently, employed by YMCA Victoria. All other authors declare no competing interests. Authorship: T.B.R., A.P., K.B., A.J. and A.K. conceptualised the project. T.B.R., A.P. and K.B. designed the methodology. A.K. and A.J. provided information for centre selection and facilitated data collection. T.B.R., B.G., O.H., M.R.B. and A.C. conducted data collection and investigation. T.B.R., B.G. and A.C. conducted data curation. T.B.R. conducted formal analysis and managed the project. A.P. supervised the project. A.J., B.G. and A.C. validated the data. T.B.R. drafted the original manuscript. All authors contributed to reviewing and editing the final manuscript. Ethics of human subject participation: The current study was conducted according to the guidelines laid down in the Declaration of Helsinki, and all procedures involving research study participants were approved by the Monash University Human Research Ethics Committee (CF16/691–2016000340). Verbal informed consent was obtained from all participants. Verbal consent was witnessed and formally recorded.
Supplementary material
For supplementary material accompanying this paper visit https://doi.org/10.1017/S1368980021002421


