


Introduction
One billion people worldwide are diagnosed with hypertension. 1 High blood pressure (BP) contributes to premature vascular changes, with impaired vascular structure and function. Such vascular changes may lead to an increased risk of developing cardiovascular disease (CVD),Reference Nilsson, Boutouyrie and Laurent 2 , Reference Kaess, Rong and Larson 3 which is the leading cause of death worldwide and accounts for 9.4 million deaths each year. 1 It is important to shed light on BP variations from early life onward, as BP shows moderate tracking from childhood to adulthood,Reference Chen and Wang 4 and early and midlife BP trajectories predict CVD risk later in life.Reference Theodore, Broadbent and Nagin 5
Excess early postnatal weight gain is one of the phenomena that could cause an adverse metabolic and cardiovascular profile, including thicker arterial walls in childhoodReference Evelein, Visseren and van der Ent 6 and a propensity for developing higher BPReference Ben-Shlomo, McCarthy and Hughes 7 – Reference Kaakinen, Sovio and Hartikainen 12 and coronary events in adulthood.Reference Barker, Osmond and Forsen 13 Studies have established that accelerated weight gain – in healthy children who are born at term – is associated with higher childhood systolic BP (SBP), but there is no consensus with regard to diastolic BP (DBP).Reference Bansal, Ayoola and Gemmell 14 – Reference Tilling, Davies and Windmeijer 21 Moreover, these studies did not provide an optimal reflection of adiposity as the variation in individual length gain rates was not taken into account. Perng et al. found higher BP in children with higher body mass index (BMI) z scores in early life.Reference Perng, Rifas-Shiman and Kramer 22 Results from a recent study suggest that BMI from 2 months of age is a better predictor of obesity later in life than weight for length gain rates (WLG). 23 However, WLG is still recommended in clinical settings as adiposity measure in children younger than two years of age rather than BMI.Reference Grummer-Strawn, Reinold and Krebs 24 WLG especially reflects excess weight gain instead of linear lean mass accumulation. Two studies demonstrated that higher WLG at 6 months of age was associated with higher BP in, respectively, 3- and 14-year-old children.Reference Belfort, Rifas-Shiman and Rich-Edwards 25 , Reference Menezes, Hallal and Dumith 26 The results of two studies suggested that there is also an association between WLG during the first 3 months of life and BP.Reference de Beer, Vrijkotte and Fall 27 , Reference Jones, Charakida and Falaschetti 28 It is important to reveal the origin of BP variations in population to prevent hypertension and CVD. Deeper understanding of the impact of growth patterns early in life may contribute to better cardiovascular health from early life onward. Therefore, the objective of this study was to determine the association between excess weight gain in early postnatal life, taking into account length gain and BP in healthy young children.
Methods
Study design and study population
This study is part of the WHeezing-Illnesses-STudy-LEidsche-Rijn (WHISTLER) birth cohort. Participants of WHISTLER live in Leidsche Rijn, a new residential area under development near the city of Utrecht in the Netherlands. Almost 100,000 people of different ages, social, cultural and economic backgrounds live in this area. From 2001 onward, WHISTLER has included 2909 healthy newborns. Exclusion criteria were gestational age <36 weeks, major congenital abnormalities and neonatal respiratory diseases. From 2007, the cohort study includes research on determinants of vascular development in early life. Newborns were recruited until 2014 and were actively followed throughout childhood. When the children reach the ages of 5 and 8–10 years, they are reinvited to visit our local outpatient clinic.Reference Katier, Uiterwaal and De Jong 29 , Reference Eising, van der Ent and van der Gugten 30
Currently, all WHISTLER children are at least 5 years of age. Of these, 1018 visited our outpatient clinic. Respectively, 153 and 12 children were excluded based on less than two postnatal growth measurements available and missing BP measurements. The present study population consists of 853 5-year-old children who had a measure of early life growth and at least one BP measurement available. BP was measured in both sitting (n=735) and supine posture (n=802). A flowchart of the study cohort is provided in Fig 1. The pediatric medical ethics committee of the University Medical Centre Utrecht has approved the study and conformed to the standards set by the declaration of Helsinki. Written informed consent was obtained from the children’s parents.Reference Katier, Uiterwaal and De Jong 29
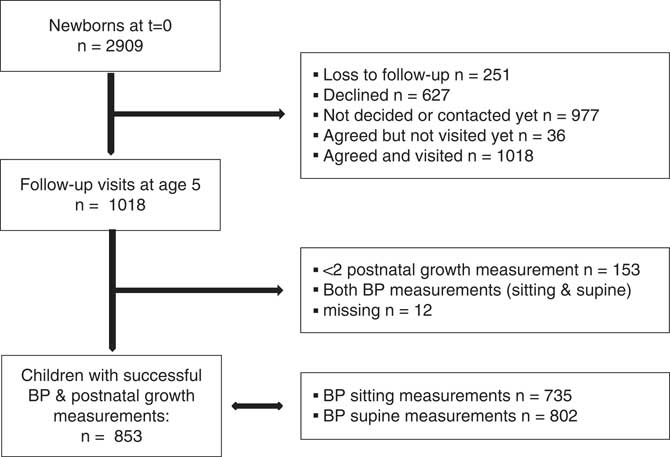
Fig. 1 Flowchart of the study population.
Neonatal visit and follow-up in infancy
The parents of eligible children were invited to visit our outpatient clinic when their infant was approximately 4 weeks old. Anthropometric measurements were done and questionnaires were completed by the parents. After this visit, the parents were asked to complete a questionnaire dealing with birth, growth, development, infant feeding, respiratory symptoms and disease every month for a period of 12 months.Reference Katier, Uiterwaal and De Jong 29 In the Netherlands, infants regularly visit child health-care centers for standardized weight and length measurements. These anthropometrics were performed by the doctor and reported in a ‘growth booklet’. Parents were asked to copy the reports in the questionnaires.
Early life growth
WLG was used as proxy for early life growth, which represents excess weight gain given children’s length gain. For each child with at least two measurements in the first 3 postnatal months available, weight gain and length gain rates were estimated. Using several available anthropometrics, we aimed to reduce the effects of individual variation over time (regression to the mean). Since the number of anthropometric measurements (median count is three) and the age at which these were measured differed per child, the associations between age and both weight and length were assessed using linear mixed modeling, allowing for individual variation in birth weight or length and growth. Because the relationship between lean body mass and length is known to be exponential,Reference Forbes 31 model fits for a linear, quadratic and cubic model were compared. The linear model was considered to be most appropriate. Subsequently, to obtain individual weight gain rates, linear regression on the predicted values of the linear mixed model was performed and stratified by child. The same steps were taken to assess individual length gain rates. WLG was assessed by calculating z scores internal to our study population for weight gain, conditioned on length gain, using the standardized residuals from the linear regression model with weight gain as the dependent variable and length gain as the independent variable. A z score of +1 standard deviation (s.d.) WLG indicates that the weight gain of a certain child is 1 s.d. larger than the mean weight gain in the population, based on that child’s length gain. Model fits for a linear, quadratic and cubic model for adjustment of WLG were compared, again showing the best model fit for the linear model.Reference Evelein, Visseren and van der Ent 6
Follow-up visit in 5-year-old children
The children re-visited the outpatient clinic at a mean age of 5 years. Anthropometric measurements were obtained by investigators and trained pediatric research nurses, with the participants wearing indoor clothes, without shoes and standing with their feet slightly apart. BMI was calculated as weight in kilograms divided by height in meters square. Visceral (VAT) and subcutaneous adipose tissue (SAT) were measured three times ultrasonographically with a Picus Pro system (Esaote, Italy), using a CA 421 convex transducer, according to a previously described procedure.Reference Koda, Senda and Kamba 32 , Reference Stolk, Wink and Zelissen 33 Electronic calipers were used to measure distances from different angles. For all measurements, minimal pressure was applied to eliminate the distortion of tissue. Children could watch a movie during the ultrasound sessions of approximately 30 min.
Also information about child and parental characteristics, with respect to previous years, were obtained by a questionnaire.Reference Geerts, Evelein and Bots 34 , Reference Evelein, Visseren and van der Ent 35
BP
The children’s SBP and DBP were measured two times at the right brachial artery, separately in sitting and supine postures, using an automatic oscillometric device (DINAMAP; Critikon, Tampa, FL, USA). If the discrepancy between the first and second measurement exceeded 10 mmHg, a third measurement was performed. Appropriate cuff sizes relative to the diameter of the arm were used, usually a cuff size of 12–19 cm. The first measurement was made after 5 min rest and 2 min quietness was held between the measurements. The means of the SBP and DBP recordings were used for analyses.
Confounders and effect modifiers
We considered ethnicity as possible confounder of the association of interest, as there are ethnic differences with regard to growth in early lifeReference Taveras, Gillman and Kleinman 36 and BP.Reference Modesti, Reboldi and Cappuccio 37 Ethnicity was defined as western or non-western. A child had a western ethnicity when both parents born in Western countries (countries in Europe with exclusion of Turkey, North America, Oceania and Japan). Sex was taken into account as confounder, as World Health Organization (WHO) growth charts are specified for boys and girls separately as they differ in growth 38 and males have higher BP than females with the same age, in both childhood and adulthood. 23 , Reference Kotsis, Stabouli and Pitiriga 39
Birth size, smoke exposure during pregnancy (yes, no) and breastfeeding (ever, never) were supposed as possible effect modifiers. For birth size, the internal z scores were constructed for birth weight adjusted for birth length and gestational age. First, birth size was supposed as a possible effect modifier as children with a low birth weight followed by accelerated weight gain during childhood had a higher risk to develop hypertension later in life.Reference Barker, Forsen and Eriksson 40 Birth size was adjusted for gestational age as well to determine whether there are differences in the association of interest between small, normal and large size at birth, given children’s gestational age. Second, prenatal smoke exposure is related to higher BP values, particularly in children with postnatal accelerated growth.Reference Bakker and Jaddoe 41 Third, lower WLG in early infancy were noticed in breastfed children compared to formula-fed children.Reference Nommsen-Rivers and Dewey 42 Besides, lower SBP values were demonstrated in children who had ever been breastfed compared to non-breastfed subjects.Reference Horta, Loret de Mola and Victora 43
Some variables might explain the association between WLG and BP and were therefore included in explanatory models. In a previous study, it was found that higher WLG rates were associated with increased BMI and a higher amount of abdominal fat in 5-year-old children.Reference Evelein, Visseren and van der Ent 35 Higher BP was also found in children with higher BMI and in those with more VAT. 23 , Reference Jansen, Uiterwaal and Visseren 44 We included BMI in the model to investigate whether weight gain early in life, independent of current weight or height level, is associated with BP. Children of one or both parents with hypertension have a higher tendency to develop hypertension as well.Reference Niiranen, McCabe and Larson 45 Parental smoking postnatal is also associated with higher offspring BP.Reference Simonetti, Schwertz and Klett 46 We consider birth size, smoke exposure during pregnancy and breastfeeding as effect modifiers, but these variables could also act as intermediates and might partially explain the association of interest. Therefore, these variables were also included in the explanatory models.
Data analysis
The means and variances of parent and child characteristics were calculated by the z score WLG tertiles and tested using analysis of variance (ANOVA) or Kruskal–Wallis test in case of skewed data, for continuous variables and Pearson’s chi-square tests for frequencies. Pearson correlation coefficients between sitting and supine measured SBP and DBP were calculated.
The crude association between WLG and BP was assessed using a linear regression models. Separate models were run for BP measurements in sitting and supine postures. The same models were adjusted for confounders ethnicity and sex (model 1). Interaction terms between the effect modifiers and WLG were tested in different models.
Further explanatory models for the association between WLG and BP were tested accounting for BMI at follow-up visit, abdominal fat distribution at follow-up visit (VAT and SAT), parental BP, (grand)parental CVD <60 years of age, breastfeeding and parental smoking postnatally (yes, not anymore, never), to investigate whether these intermediate variables partially explain the association of interest. Hypertensive disorders of pregnancy were not included as those were present in only 11 mothers. A stepwise regression procedure was performed additionally to model 1, to select the statistically significant variables (model 2).
The results are expressed as linear regression coefficients with 95% confidence intervals (95% CIs) and P values. Confidence intervals not including zero, corresponding to P values <0.05 were considered as statistically significant. All analyses were performed using SPSS version 21.0 for Windows.
Results
WLG z scores are in the range −4.0 to 3.2 s.d., with mean±s.d. weight and length gain of 28.6±5.1 g/day and 1.2±0.1 mm/day, respectively. At 5 years of age, the sitting SBP and DBP were equivalent to 105±7 and 54±7 mmHg, and in the supine posture the values were 103±7 and 53±6 mmHg, respectively. The correlations between sitting and supine SBP (r=0.64, P<0.001) and DBP (r=0.56, P<0.001) were moderate.
In the highest WLG z-score group compared to the lowest WLG z-score group, children were 0.9 cm taller at birth, had 10.2 g/day more weight gain in the first 3 months and there were more boys (65 v. 24%) than girls. The mean age of the children at follow-up visit was 5.5 years. Children in the highest WLG z score groups had a higher BMI compared to children in the lowest and middle WLG z score groups (Table 1).
Table 1 Characteristics of Whistler offspring and parents by z-score tertiles for postnatal weight for length gain rates (n=853)
Values are mean±s.d., unless otherwise indicated.
In the crude model, children with a 1 s.d. increase in WLG z score had a 0.562 mmHg (95% CI 0.01, 1.1) higher sitting SBP, which increased after adjustment for confounders (model 1; 0.909 mmHg/SD, 95% CI 0.3, 1.5). WLG was not related to sitting DBP or supine BP (Table 2).
Table 2 Associations between z scores for postnatal weight for length gain rates and blood pressure measured in sitting and supine postures in 5-year-old offspring
* Adjusted for ethnicity and sex.
There was no effect modification by smoke exposure during pregnancy or breastfeeding (P values for interaction were 0.69 and 0.22, respectively). Birth size was an effect modifier since the P value for interaction was 0.04. Birth size was divided into two groups based on birth size; the lowest birth size decile v. the rest of the birth size percentiles (10–100%). In the lowest decile, birth size z scores ranged from −2.8 to −1.2 s.d., with mean±s.d. birth weight and birth length of 2981±414 g and 51.0±2.5 cm, respectively. Children in the lowest decile had a relatively lower birth weight compared to other children, but most of them (76%) were still born with a healthy birth size for their gestational age. Baseline characteristics of both groups are demonstrated in supplementary table S1. Particularly in children in the lowest birth size decile, high excess weight gain resulted in higher sitting SBP values compared to those children who experience low WLG during the first 3 months of life. The association remained similar when children born small for gestational age were excluded from the analysis.
After eliminating BP variance due to birth size, breastfeeding, SAT at follow-up visit, parental BP, (grand)parental CVD <60 years of age, parental smoking postnatal and smoke exposure during pregnancy, estimates for sitting SBP remained almost the same (supplementary table S2). However, BMI and VAT remained statistically significant in model 2. This resulted in an attenuation of a statistically non-significant association between WLG and SBP (β 0.495 mmHg, 95% CI −0.3, 1.3). Transforming absolute BMI values to relative values as in z scores did not change this result. Table 3 provides an overview of the estimates for this model.
Table 3 Overview of the multivariable associations between z scores for postnatal weight for length gain rates (WLG) and sitting systolic blood pressure (SBP), additionally adjusted for body mass index (BMI) and visceral adipose tissue (VAT)
Discussion
Excess weight gain during the first three postnatal months was associated with higher sitting SBP in children aged 5 years, particularly in those children with a small birth size. No association was found with respect to supine SBP or DBP.
To appreciate these findings, some aspects of the study need to be addressed. We consider it a strength that our measurements were collected in a large group of healthy young children, in whom we uniquely measured BP in different body postures. We constructed a WLG for each child based on at least two growth measurements, taking individual variation over time into account. This leads to a more precise measure than including only one postnatal measurement. WLG z scores were built on our own data, in lieu of standardized growth charts, as our purpose was to investigate the effect of relative postnatal growth variations in BP. By estimating the relative excess weight gain instead of absolute excess weight gain, the individual starting point of weight and length was taken into account. Birth size was similarly constructed and represents a healthy study population, since almost all children were born with birth weight and length within the normal standardized ranges defined by the WHO. We excluded children with missing determinant and outcome. However, we consider selection bias implausible, as the baseline characteristics of those excluded children were similar to the characteristics of the cohort we used for this study. Information bias is unlikely as parents and trained pediatric research nurses were unaware of the research question.
Our results of higher SBP in children born at term with increasing excess weight gain in the first postnatal months are in line with the results of other studies by taking into account WLG for over a longer period.Reference Menezes, Hallal and Dumith26, Reference Jones, Charakida and Falaschetti28, Reference Belfort, Gillman and McCormick47, Reference Skilton, Marks and Ayer48 We found a strengthened effect in those children with a relative small birth size, which are in accordance with the results of Belfort et al. in children aged 3 years.Reference Belfort, Rifas-Shiman and Rich-Edwards25 This may implicate that deviation from the growth pattern leads to higher SBP than equivalent excess weight gain. The association between WLG and SBP reduced to a statistically non-significant estimate, although not fully explanatory, when BMI and VAT additionally were included in the model. As one might expect, both BMI and VAT in childhood are partly reflected by early life growth. Higher BMI and VAT are in turn associated with higher SBP.Reference Jansen, Uiterwaal and Visseren44, Reference Friedemann, Heneghan and Mahtani49 BMI and VAT are thus on the causal pathway in the association of interest. We focused on early determinants in life to investigate whether there is already an association with WLG and SBP; and if so, this could be seen as the window of opportunity for future prevention strategies. This result was also demonstrated by Skilton et al.Reference Skilton, Marks and Ayer48 and Van Hulst et al. who found an indirect relation of WLG and SBP via childhood adiposity in children of at least one obese parent.Reference Hulst, Barnett and Paradis50 Therefore, it appears to be that excess weight gain early in life affects both the vascular system and fat metabolism. Growth characterized by higher adiposity during the first postnatal months gives a higher tendency to develop obesity later in life.Reference Taveras, Rifas-Shiman and Sherry51 Although the underlying mechanism of BP programming via fat metabolism is not clearly elucidated, a potential mechanism in adults has been described previously. Adipose tissue dysfunction may lead to higher BP values due to chronic vascular inflammation, oxidative stress, activation of the renin–angiotensin aldosterone system (RAAS) and activation of the sympathetic nervous system (SNS). These mechanisms could result in endothelial dysfunction, vasoconstriction and hypertrophy, which are responsible for an increase in peripheral vascular resistance and BP.Reference Dorresteijn, Visseren and Spiering52 We suggest that relations between fat distribution and BP are graded and that in principle the same mechanisms act in early healthy childhood. Besides, early life exposures may lead to epigenetic modifications in genes related to those different mechanisms due to the plasticity of young children, which gives a tendency to develop higher BP values.Reference Alexander and Ojeda53 Singhal et al. supported the presence of this mechanism early in life. They demonstrated associations between weight gain in the first 2 weeks of life and endothelial dysfunctionReference Singhal, Cole and Fewtrell54 and insulin resistanceReference Singhal, Fewtrell and Cole55 in adolescents born preterm. This is in line with the findings of Barker et al. who suggest a link between the development of insulin resistance in children who showed compensatory growth from 2 to 11 years of age.Reference Barker, Osmond and Forsen13
Less attention has been paid to the posture of BP measurements, and evidence is particularly scarce concerning supine BP. We did take into account the posture of the BP measurement in revealing the origins of BP variations, as different postures lead to different BP values.Reference Eser, Khorshid and Gunes56–Reference Pickering, Hall and Appel59 Our estimates of the association of interest were higher when BP was measured in sitting rather than supine posture. Our results with regard to SBP are in line with the results found by De Beer et al.Reference de Beer, Vrijkotte and Fall27 They also found an association with DBP, but we could not confirm this. Furthermore, the results of our study are in line with our previous study of healthy young children, where we showed that higher VAT resulted in higher sitting SBP values.Reference Jansen, Uiterwaal and Visseren44 We speculate that the mechanism underlying the association may be mechanical through sheer effects of body weight or through metabolic activity of visceral fat tissue on BP dynamics. A change in body posture is accompanied by a change in hydrostatic pressure patterns, as the body takes another position in the gravitational field.Reference Hinghofer-Szalkay60 We suggest that body size perhaps has a different impact on these different hydrostatic pressure patterns and might explain the less strong association between WLG and supine BP.
In conclusion, children with excess weight gain in the first 3 months of life, particularly those with a small birth size, have higher SBP at the age of 5 years.
Supplementary material
To view supplementary material for this article, please visit https://doi.org/10.1017/S2040174418001149
Acknowledgments
The authors would like to thank all the parents and children who participated and the WHISTLER study group.
Financial Support
The WHISTLER birth cohort was supported with a grant from the Netherlands Organization for Health Research and Development [grant no. 2001-1-1322] and by an unrestricted grant from Glaxo Smith Kline Netherlands. WHISTLER-Cardio was supported with an unrestricted strategic grant from the University Medical Center Utrecht (UMCU), the Netherlands.
Conflicts of Interest
None.
Ethical Standards
The authors assert that all procedures contributing to this work comply with the Helsinki Declaration of 1975, as revised in 2008, and has been approved by the pediatric medical ethics committee of the University Medical Centre Utrecht.
Perspectives
We showed that small BP variations already exist in childhood and are associated with early life determinants. These variations are not important from a clinical and individual point of view, but they may have a relevant impact on population health. BP levels tend to track from childhood into adulthood, and we know that small, favorable shifts in mean BP levels in the total population may have a large effect on the prevalence of hypertension in the total population.Reference Olsen, Angell and Asma61 Therefore, for population prevention of hypertension and CVD, factors that affect BP early in life should be considered.


 Open access