


2 Monitoring
Practical Emergency Resuscitation and Critical Care, ed. Kaushal Shah, Jarone Lee, Kamal Medlej and Scott D. Weingart. Published by Cambridge University Press. © Kaushal Shah, Jarone Lee, Kamal Medlej and Scott D. Weingart 2013.
Introduction
Monitoring and understanding of monitoring devices are necessary for proper management of the critically ill patient. The goal of hemodynamic and respiratory monitoring is to ensure and maintain adequate tissue perfusion. This chapter will review the basic methods and principles of monitoring in the emergency setting.
Basic monitoring
Several aspects of a critically ill patient’s status can be obtained from the telemetry monitor (Table 2.1).

Three electrodes (white, black, and red) are used in 3-lead ECG systems, allowing for multiple views of the heart. Lead II is typically displayed on the cardiac monitor. For accurate ECG tracing, the electrodes should be applied in the following manner:
The white electrode is placed just below the clavicle on the right shoulder.
The black electrode is located on the left clavicle near the shoulder.
The red electrode is connected to the left pectoral muscle near the apex of the heart.
Heart rate is measured as number of beats per minute (bpm). The normal heart rate range is 60–100 bpm.
Blood pressure is measured as systolic pressure over diastolic pressure.
Noninvasive blood pressure measurements can be obtained via auscultatory or oscillometric measurements.
Mean arterial pressure (MAP) is the average arterial pressure during a single cardiac cycle and can be used as indicator of adequate tissue perfusion. MAP = (⅔diastolic pressure) + (⅓systolic pressure).
Respiratory rate is a measure of the total number of breaths per minute.
Temperature can be measured via oral, tympanic, axillary, esophageal, or rectal routes. Rectal and esophageal temperatures are more indicative of a patient’s core temperature.
Respiratory monitoring
Pulse oximetry
Pulse oximetry provides continuous measurement of a patient’s oxygenation status.
Measurements are obtained via sensors placed on the patient’s fingertip, earlobe, or forehead. These sensors use two light-emitting electrodes.
The first emits red light that has a wavelength of 660 nm.
The second emits infrared light that has a wavelength of 905, 910, or 940 nm.
The difference in absorption of the red light and infrared light determines the oxyhemoglobin to deoxyhemoglobin ratio. This measurement corresponds to the pulse oximeter saturation estimate (SpO2).
Pitfalls:
Once the arterial oxygen saturation (SaO2) falls below 70%, the pulse oximetry readings are no longer accurate.
Pulse oximetry cannot reliably detect hypoxemia in the setting of carbon monoxide poisoning because carboxyhemoglobin has similar light absorption to that of oxyhemoglobin at 660 nm.
It is also inaccurate in the setting of methemoglobinemia as both red light and infrared light are equally absorbed by methemoglobin. This results in a fixed SpO2 around 85% regardless of the true SaO2.
Oxygenated blood that is redistributed from central to peripheral circulation can cause a delay in saturation readings known as pulse oximetry lag. This lag can be as long as 2–3 minutes in critically ill patients secondary to reduced blood flow.
A proper waveform must be visualized on the monitor in order to be able to properly determine the SpO2.
Hypothermia and peripheral vasoconstriction can lead to inaccurate or unobtainable values.
End-tidal carbon dioxide (EtCO2)
Capnography measures the partial pressure or concentration of expired carbon dioxide (CO2), the EtCO2. This concentration is a function of the production of CO2 at the tissue level and delivery of CO2 to the lungs by the circulatory system. Therefore, capnography provides important information regarding ventilation, circulation, and metabolism.
The normal expired CO2 level is around 5%, which is approximately 40 mmHg.
There are two different EtCO2 monitoring modalities that are used in the emergency department (ED).
Colorimetric capnometry is a filter generally used to confirm endotracheal tube (ET) placement in the trachea.
The filter attaches to the ET tube and displays the change in concentration of carbon dioxide by color change.
In certain colorimetric capnometers, detection of carbon dioxide is exhibited by filter color change from purple to yellow. This is a semiquantitative mode of monitoring. The color ranges are as follows: purple = EtCO2 <0.5%; tan = EtCO2 0.5–2%; and yellow = EtCO2 >2%.
Pitfalls:
The filter can turn yellow when exposed to acidic material such as stomach contents, or medications including lidocaine and epinephrine.
In patients in cardiac arrest, color change may not be seen even with tracheal intubation because of the low EtCO2 value resulting from poor or absent blood flow.
Quantitative capnography uses infrared technology to provide a continuous numerical value and a continuous waveform display of EtCO2. This measure is plotted graphically on a monitor.
Some ED applications of quantitative EtCO2 monitoring are listed below.
Quantitative EtCO2 will reliably confirm tracheal placement of endotracheal tube despite low cardiac output states, unlike colorimetric devices.
Postintubation continuous capnography can help early identification of airway obstruction or tube dislodgment.
Pulse oximetry provides information about oxygenation, not ventilation. With any amount of supplemental oxygenation, detection of hypoventilation will be significantly delayed. This occurs because patients will start desaturating seconds to minutes after they stop breathing.
EtCO2 monitoring provides early detection of airway compromise and can rapidly identify apnea, airway obstruction, bronchospasm, and laryngospasm. Respiratory depression can therefore be identified prior to hypoxia.
Cardiopulmonary resuscitation (CPR):
Monitoring of ventilation:
Monitoring of the respiratory rate can be achieved more accurately with an EtCO2 waveform. It is important not to hyperventilate patients during CPR as this leads to worse outcomes.
Monitoring of effectiveness of chest compressions:
In low flow states, the EtCO2 value is a reflection of the cardiac output to the lungs. The more effective chest compressions are, the higher the EtCO2 value will be.
Assessment of return of spontaneous circulation (ROSC):
A sudden increase in EtCO2 can represent a return of spontaneous circulation and indicates the need to check for the presence of a pulse.
Prognosis:
EtCO2 can be used to help determine whether further resuscitation efforts are futile as studies have shown that an EtCO2 <10 mmHg after 20 minutes of CPR is predictive of a failure to resuscitate.
Monitoring conditions in which arterial PaCO2 levels are critical:
Traumatic brain injury or intracerebral hemorrhage with elevated intracranial pressure.
Severely acidemic patients prior to intubation.
In normal lungs with normal gas exchange, EtCO2 values are usually 3–5 mmHg lower than arterial PaCO2 values. In critically ill patients the values will not correlate. However, if an arterial PaCO2 and EtCO2 values are obtained simultaneously, EtCO2 may be used to trend PaCO2 values.
Noninvasive hemodynamic monitoring
Ultrasonographic assessment of the inferior vena cava (IVC)
Ultrasonography of the IVC can be useful in determining fluid responsiveness. After bringing the IVC into sagittal view, changes in the diameter of the vessel with respiration are recorded. Interpretation of these measurements will depend on whether the patient is mechanically ventilated or breathing spontaneously.
In a spontaneously breathing patient:
Assess the diameter of the IVC and percentage of collapse with inspiratory effort. This provides an estimate of central venous pressure (CVP).
An IVC diameter ≤1.7 cm with complete inspiratory collapse demonstrates a low CVP (<5 mmHg).
An IVC diameter of >1.7 cm with no inspiratory collapse is indicative of a high CVP (>15 mmHg).
In a mechanically ventilated patient:
Mechanical ventilation causes the diameter of the IVC to increase with inspiration. Therefore the physician should not evaluate for IVC collapse but rather for IVC distension with inspiration.
The IVC distensibility index is determined as (Maximum IVC diameter − Minimum IVC diameter)/(Minimum IVC diameter).
Values ≥18% are predictive of fluid responsiveness.
Pitfalls:
Invasive hemodynamic monitoring
This section will highlight invasive monitoring techniques that can be used in the ED setting. Invasive techniques provide data via catheters inserted in central veins or arteries.
Pulmonary artery catheter (PAC)
The pulmonary artery catheter or Swan–Ganz catheter is a balloon-tipped catheter that is inserted into the internal jugular or subclavian vein. From there it is guided by cardiac blood flow into the right atrium, the right ventricle, and finally into the pulmonary artery.
It allows to measure a number hemodynamic parameters that are indicators of preload, cardiac output, and oxygen delivery. Central venous pressure (CVP), pulmonary capillary wedge pressure (PCWP), systemic vascular resistance (SVR), cardiac output (CO), cardiac index (CI), and mixed venous O2 (SvO2) are some of the commonly used variables that can be obtained from the PAC.
PAC measures CO via the thermodilution method, which is usually the gold standard for CO measurement in studies.
Preload can be estimated at the level of the right atrium by CVP, or the level of the left atrium by PCWP.
PACs are not typically placed in the ED.
Pitfall:
Central venous pressure
CVP is obtained by placing a central venous catheter (CVC) in the internal jugular or subclavian vein. The tip of the CVC should ideally rest at the junction of the superior vena cava (SVC) and the right atrium.
A normal CVP ranges between 4 and 6 mmHg. A CVP of 8–12 mmHg is targeted in hypotensive septic patients.
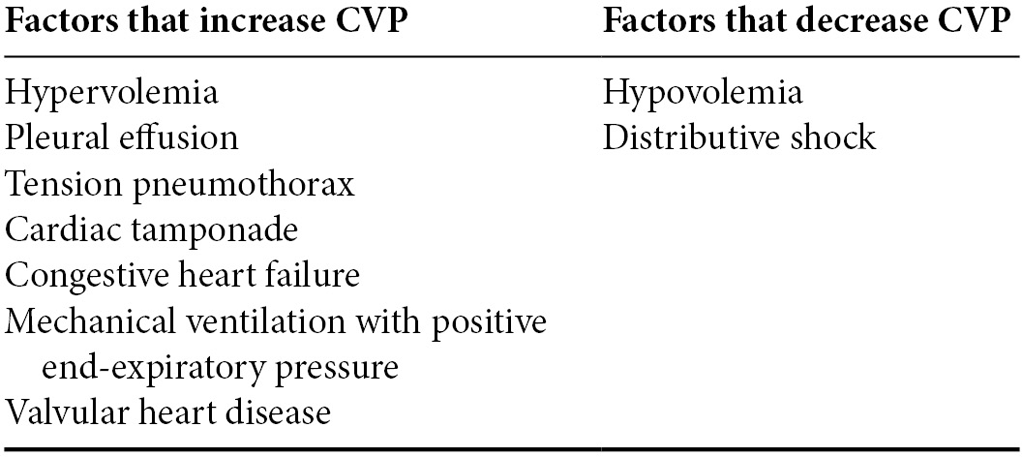
Several factors can affect CVP measurements and these are summarized in Table 2.2.
Pitfall:
Table 2.2. Factors that alter the reliability of CVP results
Pulse and systolic pressure variation
Pulse pressure variation (PPV) and systolic pressure variation (SPV) can be used to determine fluid responsiveness in a mechanically ventilated patient. Both of these methods require an arterial line for continuous measurement of arterial blood pressure.
The pulse pressure and systolic pressure show slight variations with respiration. These are caused by increased blood return to the right heart secondary to the negative intrathoracic pressure generated during inspiration. These variations are exacerbated by hypovolemia and their measurement beyond a certain threshold can be used as an indicator of fluid responsiveness.


