


Around 70–80% of the population in India currently live in rural settings without access to good quality healthcare facilities.1 The establishment of primary health centres (PHCs) has helped improve affordability and accessibility of healthcare to some extent, for some conditions, but it has been largely ineffective in addressing the needs of people suffering from or at risk of non-communicable disorders including mental disorders.Reference Srivastava and Bachani2–Reference Reddy4 It has been estimated that only 1 in 27 receive care for mental disorders such as depression.Reference Thornicroft, Chatterji, Evans-Lacko, Gruber, Sampson and Aguilar-Gaxiola5 The National Mental Health Survey (NMHS)Reference Gururaj, Varghese, Benegal, Rao, Pathak and Singh6 estimated that about 150 million Indians need care for mental disorders, and about 10% suffer from common mental disorders (CMD) such as depression, anxiety, emotional stress and suicide risk, as well as alcohol and drug use. The report indicated that the prevalence of mental disorders was 2–3 times higher in urban areas, compared with rural areas.Reference Gururaj, Varghese, Benegal, Rao, Pathak and Singh7 However, relatively few studies have used standardised tools to assess the burden of CMD, especially in rural settings. Thus, there is a need to provide further evidence about the burden of mental disorders, especially in rural communities and particularly using standardised tools and methods. In the absence of reliable disease prevalence estimates, planning an appropriate health system response is challenging. This paper reports on the baseline data from the Systematic Medical Appraisal, Referral and Treatment (SMART) Mental Health Project.Reference Maulik, Devarapalli, Kallakuri, Praveen, Jha and Patel8 It outlines the prevalence of CMD such as depression, anxiety and suicidal ideation, and risk factors associated with those conditions. However, the SMART Mental Health Project had the broader objective of conducting a study to assess feasibility and acceptability, and gather preliminary evidence about a mobile technology-based mental health services delivery model for rural India.
Method
Study setting and sample size estimation
The study was conducted in 12 villages (total population of ~40 000) of the West Godavari district in the state of Andhra Pradesh in south India. West Godavari is a coastal district in Andhra Pradesh, with a population of ~4 million. Telugu is the predominant language of the region, and agriculture and fisheries are the main sources of occupations and income (http://www.ap.gov.in/about-ap/districts/west-godavari/). Initially, three primary health centres (PHCs) within 50 kilometres from the field office were selected. All villages catered by those PHCs were listed. Prior to randomisation, it was ensured that the villages had adequate numbers of lay village health workers – Accredited Social Health Activists (ASHAs) – to cater to the population. This was necessary as the subsequent stages of the project included delivering a complex intervention on mental health service delivery involving the ASHAs.Reference Maulik, Devarapalli, Kallakuri, Praveen, Jha and Patel8, Reference Maulik, Devarapalli, Kallakuri, Tewari, Chilappagari and Koschorke9 Four villages per PHC were then selected randomly.
Sample size estimation
Since the SMART Mental Health Project was essentially a mental health services delivery project, the sample size estimates were done keeping in perspective the primary outcome of use of mental health services and the availability of ASHAs. We anticipated that 12 villages would have a population of ~27 000 individuals aged ≥18 years. Based on our extensive previous work, we expected a response rate of ~75%, indicating ~19 500 participants. It was conservatively estimated that 15% of consenting participants at baseline would have a CMD as determined by the screening tools, representing approximately 3000–4000 individuals. Studies have estimated that only 15–25% of those with severe mental disorders in developing countries receive treatment, with even lower numbers for CMD.10 Thus, we conservatively assumed that 10% of individuals who screened positive would have sought medical care for mental disorders in the previous 12 months at baseline. For every 1000 population there is one ASHA, and they were identified as the clusters for analyses. An earlier study that focused on provision of mental health services in India using primary care workers had found an intraclass correlation (ICC) of 0.03.Reference Patel, Weiss, Chowdhary, Naik, Pednekar and Chatterjee11 Given that this study had a behavioural intervention, we assumed an ICC of 0.1. With these assumptions, the study had 80% power at α = 0.05 to detect a relative increase in mental healthcare utilisation by as little as 20% at follow-up, if we had 38 clusters with 80 individuals in each cluster.
Ethics approval and consent of participants
Ethics approval was obtained from the Centre for Chronic Disease Control in New Delhi, India. Written informed consent was obtained from all the participants. All consenting adults ≥18 years old who understood the questions and instructions, and were not limited by any severe illness that prevented them from giving the interview, were included.
Prior to the start of the study, permission was obtained from the Directorate of Health, Government of Andhra Pradesh, and the support of the District Medical Health Officer of the West Godavari region was sought. In addition, approval was obtained from all local village administrative bodies.
Baseline data collection
Initially, a formative phase was initiated, in which the data collection tools were tested and finalised.Reference Maulik, Tewari, Devarapalli, Kallakuri and Patel12 This was followed by an anti-stigma campaign, which was rolled out for 3 months across all the villages to increase knowledge, improve attitudes and behaviours related to mental health, and reduce negative perceptions related to help-seeking. Subsequently, baseline data were collected over a 3-month period, using a household survey conducted by trained interviewers.
Tools used and generation of electronic database
Depression and anxiety were assessed using the Patient Health Questionnaire-9 Item (PHQ9)13, 14 and the Generalized Anxiety Disorder-7 Item (GAD7),14, 15 respectively. The PHQ9 consists of nine items. Scores of 0, 1, 2, or 3 are assigned to the response categories of ‘not at all’, ‘several days’, ‘more than half the days’ and ‘nearly every day’, respectively. The total score for the nine items ranges from 0 to 27, with scores of 5–9 indicating mild, 10–14 indicating moderate, and 15–27 indicating severe depression. A cut-off score of ≥10 has been recommended as indicating the possibility of clinically relevant moderate depression requiring further assessment.13–15 The last item on the PHQ9 specifically relates to ideas of self-harm and is indicative of increased suicide risk. The GAD7 consists of seven items. Scores of 0, 1, 2, and 3 are assigned to the response categories of ‘not at all’, ‘several days’, ‘more than half the days’ and ‘nearly every day’, respectively. The total score ranges from 0–21, with a score of 5–9 indicating mild, 10–14 indicating moderate, and 15–21 indicating severe generalised anxiety. A cut-off score of ≥10 has been used as indicative of clinically relevant moderate anxiety requiring further assessment and follow-up.13–15 The PHQ9 in the local language, Telugu, has been validated in India,Reference Kochhar, Rajadhyaksha and Suvarna16 while GAD7 has been translated and back-translated into Telugu. For this study, a score of ≥10 on either the PHQ9 or GAD7 and /or a score of ≥1 on the PHQ9 question on self-harm was considered indicative of screening positive for CMD, while a score of 5–9 was considered indicative of mild depression. Both PHQ9 and GAD7 have been used widely in research and have been shown to capture depression and anxiety across different settings.Reference Gilbody, Richards, Brealey and Hewitt17–Reference Musiat, Conrod, Treasure, Tylee, Williams and Schmidt19 Data were also collected about the following.
• Sociodemographic factors – gender, education, marital status, occupation, age.
• Stressful life events – these were captured using a set of questions which inquired about major life events in the past 1 year, adapted from the Epidemiologic Catchment Area study.Reference Maulik, Eaton and Bradshaw20
• Mental health knowledge, attitudes and behaviours – Likert-type responses to 16 questions were used to assess knowledge, attitudes and behaviours related to mental health.Reference Lund, Tomlinson, De Silva, Fekadu, Shidhaye and Jordans21 This tool was translated and back translated to Telugu.
• Stigma perceptions related to help-seeking for mental disorders – this was assessed using the Barriers to Care Evaluation – Treatment Stigma subscale,22 which includes 12 questions and uses Likert-type responses. This tool was translated and back translated to Telugu.
• Alcohol and substance use – this information was gathered using the ASSIST questionnaire.23 This tool was translated and back translated to Telugu.
• Social networks and social support – questions were asked about the number of family members, relatives or friends that the person was in contact with in the past 1 year, and about how helpful such people were when discussing personal problems or lending money when needed.
• Past history of physical and mental disorders, family history of prior mental disorders and past history of treatment for mental disorders – specific questions were asked to gather information on each of these.
Data management and data analysis
All data were captured electronically on seven-inch Android tablets and uploaded on-the-go using cloud computing whenever network access was available. The data were stored on secure servers. All data stored on the servers were initially cleaned and errors were rectified. The clean data were downloaded and de-identified before being made accessible to the research team. Descriptive analyses are reported as proportions and means. For those reporting depression/anxiety scores ≥10 or at increased risk of suicide (score ≥1 on the question related to suicidal ideation in the PHQ9), differences in proportions between different sociodemographic factors such as gender, age and occupation and education were analysed. Univariate analysis was carried out for each factor and odds ratio (OR), and the 95% CI, and χ2 P-values for differences in proportion were calculated for each factor. Since all our predictors were categorical in nature, the pairwise association between sets of predictors were checked by Cramér's V statistic for association prior to modelling, to identify collinearity which may have affected the relationship between the predictors. Logistic regression was then used to adjust for all the sociodemographic factors which were significant during univariate analysis. Adjusted ORs with 95% Wald confidence intervals, along with P-values, were determined.
Ethical standards
The authors assert that all procedures contributing to this work comply with the ethical standards of the relevant national and institutional committees on human experimentation and with the Helsinki Declaration of 1975, as revised in 2008.
Results
Data were collected from 22 377 individuals (50.1% males and 49.9% females) representing 80.3% of the total eligible population contacted in the 12 villages. Of the eligible individuals, 4848 (17.4%) were not available for the interview as they had moved out of the villages in search of seasonal work; about 71% of these were males. Only 70 (0.001%) individuals refused to be interviewed (Fig. 1).
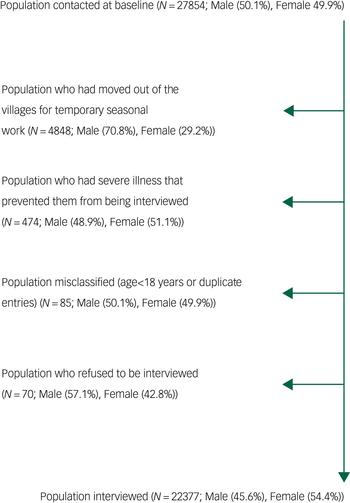
Fig. 1 Diagram showing population contacted and interviewed.
Sociodemographic details are provided in Table 1. The samples were characterised by a higher proportion of females overall. Furthermore, a higher proportion of females compared to males either had no education or had studied until primary level, and a higher proportion of males had completed high school or college. The majority of participants worked in the unorganised sector, and more males were employed in both the organised and unorganised sectors. About 80% were married (with similar proportions for both genders), and the mean age of the population was 42.3 years.
Table 1 Sociodemographic characteristics of baseline population (N = 22377)
Percentages may not add up to 100% owing to rounding off.
a Under occupation, the ‘other’ category includes students, those searching for jobs and those unable to work because of any illness or old age.
b Includes jobs which involve paying a regular salary.
c Jobs which do not involve a regular salary such as farming, working as contractual labourers, fishery.
d Under education, the ‘other’ category includes vocational training.
Tables 2 and 3 outline the depression and anxiety characteristics of the population. Overall, 5.3% of the population were identified as screen positive (i.e. had either scored ≥10 for depression or anxiety or scored ≥1 on the question on suicidal ideas). Risk of depression and anxiety and suicidal ideas were more common in females, and this was statistically significant for each condition (P < 0.001). Overall, 3.5% responded positively to the question on suicidal ideas on PHQ-9, which indicated an increased risk of suicide. Based on the severity score, 10.8% were at risk of anxiety, of whom 1.4% had moderate or severe anxiety, and 14.4% were at risk of depression, of whom 2.5% had moderate/severe depression. Anxiety and depression were more severe among females.
Table 2 Number of screen-positive cases at baseline (N = 22 377)

a This tests for any statistical difference between genders.
Table 3 Severity of anxiety and depression (N = 22 377)
Table 4 shows that gender, age, education, marital status and occupation were all significantly associated with the chances of screening positive. Being female, being older than 18–29 years, being unemployed (housewife/retired/other category), having no education (versus some education), and being married currently or being divorced/separated/widowed (compared to never married) were all sociodemographic characteristics associated with an increased odds of screening positive in the univariate analysis.
Table 4 Univariate and multivariate models of the effect of sociodemographic variables on screen-positive statusa (N = 22 377)
a Scored ≥10 on PHQ9/GAD7 and/or scored ≥1 on the question related to suicide in PHQ9.
b Unorganised sector included working as labourers or helpers in shops or farmers or fisheries; organised sector included working in offices or schools or health sectors on a salaried job.
Using Cramér's V statistic to look for correlations, we found only occupation and gender to be correlated at a level of 0.5 (moderate correlation). Other predicators were poorly correlated. However, since both those variables were significant, we decided to keep them in the model. A logistic model adjusting for all the selected variables showed that the odds of screening positive were higher in females compared with males (OR 1.40, 95% CI 1.20–1.64, P < 0.001). Compared with the 18–29-year-old age group, those aged 30–59 years had significantly increased odds of screening positive, and those over 60 years had the highest risk (OR 2.81, 95% CI 2.23–3.53, P < 0.001). Compared with those with some education, those with no education had increased chances of screening positive (OR 1.36, 95% CI 1.19–1.55, P < 0.001), and those separated/divorced/widowed had increased risk (OR 1.68, 95% CI 1.16, 2.44, P = 0.01).
Table 5 provides details of the different stressful events experienced by those who had moderate or severe depression/anxiety (score ≥10 on PHQ9 or GAD7) compared with those who had no depression/anxiety or had only mild depression/anxiety (score ≤10 on PHQ9/GAD7). ‘Suffering a financial loss’ in the past year was the most common stressful event, experienced by 56% individuals with moderate/severe depression or anxiety. All stressful events, except ‘getting married’, ‘having a baby’, ‘losing a job’ and ‘retiring from job’, were significantly more common in those who had moderate or severe depression or anxiety.
Table 5 Number of stressful events among those whose anxiety/depression score was ≥10 and those whose scores were less
a n = number of respondents who reported positively.
b N = number of respondents who responded to the particular question.
Discussion
We found that about 5.3% of participants were at risk of CMD. To our knowledge, this is the first study providing information on CMD from this community, and is the largest study providing such data from rural India. The strengths of the study were that standardised validated tools were used to assess CMD. Interviewers were trained and monitored during data collection. Random checks were made on the quality of the data, and any mismatch was clarified and corrected. Given that data were collected electronically, the chances of transcription error were reduced. In line with recent calls for gender-disaggregated analyses,24, Reference Schiebinger, Leopold and Miller25 we have tried to provide that in this paper, and found that women were significantly at increased risk of depression, anxiety and suicide.
The limitations of the study are that it is specific to one geographic area. The results can be generalised to other rural populations in the region, but its generalisability beyond similar rural populations may be difficult. The results do not include data on children and adolescents. Another limitation is that, as this was a cross-sectional study, no causal inference can be drawn from the results, and only associations can be established. Suicidal ideation was captured using the single PHQ9 question, which only provides insight into one's thoughts; this is a risk indicator, but not a definitive clinical assessment of suicide risk, which would need further clinical assessment. Although alcohol use disorder can be considered a CMD, we did not include it for this study, as the purpose of the larger study was to deliver an intervention around depression/anxiety/suicide risk at the primary care level. It was opined that management of alcohol use disorders is more complicated and would be a challenge within existing resources for the primary care facilities targeted, and could be introduced at a later stage.
More men had moved out of the village for seasonal work in factories and farms located in other towns, and hence were unavailable for interviews even after repeated attempts were made to contact them. This led to a higher proportion of women in the villages being screened by the interviewers. The higher occupation rate in men, and that more men than women had completed high school or graduation, is possibly a reflection of the fact that this was a study based in rural communities, where traditionally men are employed in field work or in other unorganised sectors in large numbers as labourers, while women are often unemployed or are housewives. Data from the district (http://www.westgodavari.ap.gov.in/Cencus.apo) suggest that males have higher literacy rates. Males are more likely to continue their education than women, especially in rural settings, which may be the reason for more men having completed high school or graduation. The skewed school dropout rates have led to the government developing specific programmes to increase schooling among girls in India (http://mhrd.gov.in/incentives).
The prevalence of adults at risk of CMD in this study was less than that reported by the NMHS.Reference Gururaj, Varghese, Benegal, Rao, Pathak and Singh6 One reason could be that we did not include alcohol and substance use disorders, which showed a 5% prevalence in the NMHS. Moreover, this study was based in a rural population, which is expected to have lower prevalence rates compared to urban populations,Reference Gururaj, Varghese, Benegal, Rao, Pathak and Singh7, Reference Maulik, Devarapalli, Kallakuri, Praveen, Jha and Patel8, Reference Grover, Dutt and Avasthi26 which may have led to the lower estimates. Another reason could be the differences in tools used in this study compared with those used in the NMHS. In the NMHS, an adapted version of the MINI International Neuropsychiatric Interview was used, whereas PHQ9 and GAD7 were used in this study. Recent research has reported that, compared with MINI, PHQ9 has a sensitivity of 86% and specificity of 78%.Reference Volker, Zijlstra-Vlasveld, Brouwers, Homans, Emons and van der Feltz-Cornelis27 Given the differences in methods used in this study vis-à-vis the NMHS, we feel that our results are similar to those obtained in the NMHS and provide independent validation of the NMHS findings. The differences in observed prevalence could be due to a number of factors, as listed above. The NMHS, although a significant survey, had some methodological limitations, particularly the use of an adapted MINI with no information currently available about the validity of the adapted tools, and selection of some states based on ‘availability of interested partners’,Reference Gururaj, Varghese, Benegal, Rao, Pathak and Singh6 which may be potential sources of bias. The value of data collected from large studies using appropriate study designs, such as the SMART Mental Health Project, will add to existing research from India (including the NMHS) and should lead to more accurate pooled estimates of mental disorders across India in future.
The adjusted model showed that female gender, being at least 30 years old, being uneducated and being separated/divorced/widowed were associated with higher risk of CMD. Depression, anxiety and suicide risk were significantly higher among females. This is similar to findings from other studies conducted nationally and internationally.Reference Gururaj, Varghese, Benegal, Rao, Pathak and Singh6, Reference Grover, Dutt and Avasthi26, Reference Kessler and Bromet28 The association between lower education and depression has also been reported earlier.Reference Grover, Dutt and Avasthi26 In this study, the risk for CMD increased with increasing age. Earlier research from India also indicated that depression is higher in older individuals compared with younger ones, but drops slightly in those more than 60 years old.Reference Gururaj, Varghese, Benegal, Rao, Pathak and Singh6 The highest risk for CMD among those older than 60 years could reflect the most common stressors identified in the community – financial loss, death or illness of loved ones, and lack of any jobs. Older individuals may be less financially independent, leading to an increased effect of any financial crisis on them, compared with younger individuals, who may be more financially stable and have a job. This was seen in the unadjusted model, where being employed was significantly associated with reduced risk of CMD, but was not significant in the multivariate model. With age, it is also more likely that one would experience a higher proportion of illness and death among family members and friends, especially if they are also older individuals. However, more research including qualitative interviews needs to be conducted to understand the reasons more clearly. Prior research from both nationalReference Grover, Dutt and Avasthi26 and internationalReference Maulik, Eaton and Bradshaw20 populations have shown that both number and type of stressors are related to mental disorders, and the common stressors associated with depression and anxiety in this study are similar to those identified previously in India.Reference Grover, Dutt and Avasthi26
CMD should be manageable at the primary care level by non-specialist health workers and primary care doctors and nurses as per the World Health Organization guidelines.29 However, even such basic training is not currently provided to primary care health workers and doctors. While the National Mental Health Policy30 and World Health Organization's Mental Health Action Plan31 recommend community-based services to be delivered by primary care workers, the execution of such is not uniform across the country, and, where present, it is not necessarily delivered or evaluated on a regular basis. Use of mental health services, though part of the larger project objective, was not a focus for this paper, and data related to use of mental health services are under analysis. However, data collected using similar tools and methods from a predominantly tribal population group from the same district showed a baseline mental health service use of 0.8%, which increased to 12.6% following intervention.Reference Maulik, Kallakuri, Devarapalli, Vadlamani, Jha and Patel32, Reference Tewari, Kallakuri, Devarapalli, Jha, Patel and Maulik33 The study highlighted the low uptake of mental health services in the community, low awareness about CMD, lack of mental health services, and the effect of providing basic mental health services in increasing mental health services uptake. It is thus important not only to augment current primary care health workers' training to include training in mental health, but also to provide them with skills and technical guidance that is evidence based and uses their time efficiently to provide mental healthcare. One way to do so is by leveraging mobile technology, which is increasingly present across rural communities in India, to not only deliver mental health services, but also to facilitate training and monitoring. The SMART Mental Health Project uses such a paradigm and proposes to use it in rural settings as described in this paper and evaluate the feasibility of implementing such an intervention.
Additional information available about stressors in this community should be factored in while developing mental healthcare systems which are specifically oriented to the community's needs, especially given that financial loss was identified as the most important stressor related to CMD. In recent times, farmer suicide due to financial debt has been identified as a major issue in rural India,Reference Merriott34 and there has been a debate about whether suicide is a result of untreated mental disorders or due to financial crisis; that is, whether a failure of mental health professionals to provide care in such rural communities or failure of state policies to tackle the financial crises is to blame.Reference Rao, Gowda, Ramachandran and Andrade35 Although this study did not provide specific details on farmers, it showed that CMD was statistically significantly associated with financial loss, and this was the most common stressor affecting both men and women in this community. Farming is the most common occupation in this community, with 90% of the land under cultivation. Our data add to the debate on the intricate link between financial loss and mental disorders. To the best of our knowledge, no initiatives have been developed in India to capture the effects of stress on the mental health of the community or to address them. Developing mental health promotion and prevention models which address such gaps could be an important step towards public mental health, at a local and possibly also a national level.
In conclusion, this study provided important information from a large rural population using standard tools, which adds to the data from the NMHS, and identified important stressors that affected these particular communities. The study showed that CMD related to stressors such as financial loss or illness and death of loved ones was prevalent but remained unidentified in the community. This calls for a closer look at national policies that focus on providing primary healthcare and integrating mental health in it, as well as the role of mental health communities in promoting mental health and identifying mechanisms in partnership with key stakeholders to alleviate the burden due to mental disorders, especially in disadvantaged rural settings.
Funding
This project was supported by the Wellcome Trust/DBT India Alliance Fellowship (Grant No: IA/I/13/1/500879), awarded to P.K.M. as an Intermediate Career Fellow. The funders had no role in this paper.


 Open access
eLetters
No eLetters have been published for this article.