Obesity results in systemic and chronic low-grade inflammation with an increased number of circulating immune cells and inflammatory cytokines(Reference Ghanim, Aljada and Hofmeyer1–Reference Bañuls, Rovira-Llopis and Lopez-Domenech3). This inflammation is associated with worsening metabolic health and the development of obesity-associated chronic diseases. Thus, understanding the mechanisms whereby systemic low-grade inflammation develops and determining approaches to prevent its progression should help promote or prolong healthier living. Currently, subcutaneous and visceral adipose tissue (scAT and VAT, respectively) inflammation is suggested as the main cause for the development of systemic low-grade inflammation(Reference Wensveen, Valentić and Šestan4–Reference Permana, Menge and Reaven6). However, Tan et al.(Reference Tam, Viardot and Clément7) demonstrated that 28-d overfeeding led to the development of systemic insulin resistance (IR) and increased the concentration of circulating C-reactive protein and monocyte chemoattractant protein-1. Interestingly, these effects were observed in the absence of changes in scAT adipocyte size or the proportion of macrophages and T-cell populations. Moreover, overfeeding-associated expansion of VAT directly correlated with the inability of scAT to accumulate lipids(Reference Alligier, Gabert and Meugnier8). These results suggest that, in the early stages of overfeeding, the systemic inflammation may associate with activation of inflammatory mechanisms in cells other than adipocytes.
Circulating immune cells are also known to be involved in obesity-associated systemic low-grade inflammation. The effect of nutrition on peripheral blood mononuclear cells (PBMC) has been a subject of increased interest. Food intake has been shown to transiently induce oxidative stress and pro-inflammatory changes in the PBMC of healthy individuals(Reference Ehlers, Brand and Bangert9). The plasma concentration of NEFA is known to significantly increase the expression of IL-6 and TNF-α mRNA in PBMC(Reference Ghanim, Aljada and Hofmeyer1). These data show that PBMC have a dynamic inflammatory response to nutrient intake. However, not much is known about the long-term effect of diet. This information is critically important, as currently most of the humans spend a considerable amount of time in a non-fasting, postprandial state with hyperlipidaemia(Reference Gill and Hardman10, Reference Henson, Dunstan and Davies11). This state may promote chronic activation of inflammatory pathways in PBMC, which may precede and/or drive the inflammatory changes in scAT. Moreover, in vitro studies have demonstrated that the common dietary SFA palmitate can activate autophagy pathways(Reference RostamiRad, Ebrahimi and Sadeghi12) in PBMC, which also play a significant role in monocyte–macrophage differentiation(Reference Zhang, Morgan and Chen13) and systemic low-grade inflammation. However, no information is available if high-fat diet (HFD) affects autophagy pathways in circulating immune cells in vivo. Therefore, we aimed to test our hypothesis whether increased dietary fat intake activates inflammatory and autophagy pathways in vivo in PBMC prior to metabolic and inflammatory changes in scAT. We also aimed to determine the underlying mechanisms and the time-course effect of HFD (i.e. 5- and 10-week dietary interventions) on activation of these pathways.
Methods
Animals and dietary interventions
Male New Zealand white rabbits (Crossroads Rabbitry) were used for the present study. We chose this model because first, previous studies have shown that the lipid metabolism in this animal model of diet-induced obesity resembles that of humans with obesity(Reference Zhang, Chinkes and Aarsland14). Second, the size of this animal model allows us to conduct stable isotope tracer infusion studies and to obtain the required samples from one animal to achieve the objectives of our studies(Reference Zhang, Chinkes and Aarsland14, Reference Zhang, Wang and Tuvdendorj15). All animals were acclimatised for 1–2 weeks before being randomly assigned to study groups. Twelve rabbits were assigned into 5- and 10-week dietary intervention with HFD (i.e. HFD-5 and HFD-10 groups, respectively). Upon completion of the intervention, all animals underwent a metabolic in vivo study as described below. Twelve control (CNT) animals, age matched with HFD-5 and HFD-10 groups, and denoted as CNT-5 and CNT-10 groups, underwent the same metabolic in vivo study. Thus, the four groups of animals included HFD-5 (n 6), HFD-10 (n 6), CNT-5 (n 6), and CNT-10 (n 6). Animals in the CNT groups were fed Laboratory Rabbit High Fiber diet (catalogue no. 5326; Labdiet®) ad libitum. Animals in the HFD groups were fed the same diet plus additional 10 % maize oil and 8 % lard, as previously described(Reference Zhang, Wang and Tuvdendorj15). The compositions of diets are presented in supplemental files. All animals were individually housed with light/dark cycle and social interaction. The welfare-related assessments were performed throughout the study duration by the veterinary personnel of the Animal Research Center, the University of Texas Medical Branch (UTMB) at Galveston. The study protocol complied with the Public Health Service Policy on Humane Care and Use of Laboratory Animals, incorporated in the Institute for Laboratory Animal Research Guide for Care and Use of Laboratory Animals and was approved by the Animal Care and Use Committee of UTMB.
The metabolic in vivo study
Following the dietary intervention and after an overnight fast (about 12 h), all animals were subjected to a metabolic study. In the morning of the study, animals were anesthetised with ketamine and xylazine, and fur shaved on the chest, neck and one ear. Jugular and marginal ear veins and the carotid artery were cannulated along with intubation of the trachea or placement of a laryngeal airway mask and ventilated (rate 12 bpm, volume 100 ml pressure not to exceed 20 mmHg). Venous blood (about 20 ml) was collected in EDTA vacutainer tubes and abdominal scAT and skeletal muscle samples from vastus lateralis were also collected. Thereafter, a 3-h primed continuous infusion of U-[13C16]-palmitate (99 % enriched; Cambridge Isotope Laboratories, Inc.) in 5 % albumin (priming dose: 1·0 µmol/kg, infusion rate: 0·1 µmol/kg per min) was started(Reference Zhang, Wang and Tuvdendorj15, Reference Chondronikola, Asghar and Zhang16). About 3 ml of arterial blood was obtained at 30, 60, 90, 120, 150, 160, 170 and 180 min of infusion to determine the rate of appearance (Ra) of palmitate as a measure of the lipolysis rate. Thereafter, the animals were killed by intravenous injection of 5 ml of Euthasol solution under general anaesthesia using ketamine and xylazine. Death was confirmed by open chest observation. At this time, a liver sample was obtained.
Ex vivo studies
Ex vivo studies were designed to determine the rate of incorporation of U-[13C16]-palmitate into palmitoyl-carnitine under a basal condition as a marker of mitochondrial fatty acid β-oxidation (FAO)(Reference Chondronikola, Asghar and Zhang16). About 4 ml of baseline blood sample collected in EDTA-containing tubes was used. After obtaining samples to measure the background parameters (i.e. the enrichment of U-[13C16]-palmitate and the total concentrations of NEFA and acylcarnitines), the remaining samples (3·6 ml) were mixed with 1 µl/ml of 2 mm U-[13C16]-palmitate dissolved in 5 % human albumin. The samples were then incubated in 37°C water bath with periodic mixing, and (0·4 ml) aliquots were collected at 5, 10, 20, 40 and 60 min after the start of incubation. All aliquots were immediately frozen in liquid N2 to arrest all biochemical reactions.
Sample analyses
Glucose and insulin measurements
Blood glucose levels were measured using an Ascensia glucometer (Bayer). Plasma insulin concentrations were measured using ELISA kits (Mercodia).
Plasma NEFA
Plasma lipids were extracted using a heptane–propanol extraction buffer, and NEFA were separated using TLC plates (Partisil LK5D, Silica Gel 150 Å; Schleicher & Schuell). After the samples were methyl-esterified, the tracer:tracee ratio of U-[13C16]-palmitate in plasma NEFA was measured using GC-MS (MSD system; Agilent), monitoring the mass:charge ratios of 270, 285 and 286 for methyl palmitate. Eight fatty acids in plasma NEFA were measured using a GC system with flame ionisation detection (GC-FID 6890; Agilent); the total NEFA concentrations were measured by means of internal standards using a GC-FID system(Reference Zhang, Wang and Tuvdendorj15, Reference Chondronikola, Asghar and Zhang16).
Analyses of blood lipids and acylcarnitines from ex vivo experiments
Blood NEFA were isolated and analysed as described above. Blood acylcarnitines were isolated using 1 ml of an acetonitrile–methanol mixture (3:1) with 50 µl of 1m KH2PO4(Reference Zhang, Chinkes and Aarsland14, Reference Zhang, Wang and Tuvdendorj15). To measure the concentrations of specific and total acylcarnitine species, D3-C16:0-carnitine was added as an internal standard (45 µm). Samples were then analysed to determine the concentrations of myristoyl-, palmitoyl- and total acylcarnitines using an LC-MS (LC-MS 6130 Quadruple; Agilent), as previously described(Reference Zhang, Wang and Tuvdendorj15, Reference Chondronikola, Asghar and Zhang16). The enrichment of U-[13C16]-palmitoyl-carnitine was measured to determine the tracer:tracee ratio of the label incorporated into palmitoyl-carnitine.
Muscle and liver lipid analyses
The lipids were extracted from 30 to 50 mg of tissue powder overnight at 4°C in a 1:2 (v/v) methanol–chloroform solution containing 0·05 mg/ml butylated hydroxytoluene. The samples were subjected to a TLC plate to separate TAG and NEFA, as previously described(Reference Zhang, Wang and Tuvdendorj15–Reference Pan, Ciociola and Saraf17). The TAG and NEFA profiles were determined using GC-FID, and the contents were calculated using internal standard approach, as previously described(Reference Zhang, Wang and Tuvdendorj15, Reference Gonzales, Williams and Calderon18).
Western blot analyses
The PBMC were isolated from baseline samples using Ficoll gradient separation as previously described(Reference Gonzales, Williams and Calderon18). scAT proteins were isolated as previously described(Reference Pan, Ciociola and Saraf17). The protein extracts of PBMC cytosolic fraction, and of scAT (15 µg), were subjected to 4–15 % SDS-PAGE (Criterion TGX; Bio-Rad Laboratories) and electrophoretically transferred to polyvinylidene difluoride membranes (Immobilon®-P; Millipore). The following monoclonal primary antibodies were used: (a) t-p38 (no. 9212S; 1:1000; 38 kDa), p-p38 (no. 4511; 1:1000; 38 kDa), t-ERK1/2 (no. 9102; 1:100; 42/44 kDa), p-ERK1/2 (no. 9910T; 1:100; 42/44 kDa), LC3 (no. 4445; 1:1000; 14/16 kDa), p62 (no. 4445; 1:500; 62 kDa), t-perilipin (no. 9349; 1:1000; 57 kDa) from Cell Signaling; (b) IL-1β (sc32294; 1:200; 17 kDa), IL-10 (sc8438; 1:200; 20 kDa), toll-like receptor 4 (TLR4) (sc-293072; 1:1000; 95 kDa) from Santa Cruz; (c) p-perilipinSer522 (no. 4856; 1:5000; 57 kDa; ValaSciences) and (d) adiponectin (ab22554; 1:1000; 30 kDa; Abcam). As a secondary antibody, either goat anti-mouse IgG-horseradish peroxidase (HRP) (no. 1030-05, 1:5000-10 000) or anti-rabbit IgG-HRP (no. 4050-05; 1:5000-10 000; Southern Biotech) was used. The expression levels were evaluated by quantification of the relative density of each band normalised to the β-actin band density (no. A1978, 1:50 000, 42 kDa; Sigma-Aldrich) using National Institutes of Health (NIH) ImageJ software v1.46r (NIH).
Calculations
IR (homeostatic model assessment of insulin resistance (HOMA-IR)) and β-cell function (HOMA-β%) were estimated from fasting glucose and insulin values using the approximated equation of Matthews et al.(Reference Matthews, Hosker and Rudenski19) and the disposition index, estimated as HOMA-β%/HOMA-IR(Reference Matsuda20).
The expression of IL-1β was divided by the expression of IL-10 (arbitrary units) to calculate the ratio of IL-1β:IL-10 as a marker of distribution of activated (M1-type) v. classical (M2-type) immune cells(Reference Jamil, Shahid and Hasan21).
The Ra of palmitate, a measure of in vivo lipolysis rate, was calculated by dividing the enrichment of U-[13C16]-palmitate in plasma NEFA by rate of infusion of U-[13C16]-palmitate(Reference Chondronikola, Asghar and Zhang16). For ex vivo studies, to calculate the kinetic parameters, the tracer:tracee ratios of labelled palmitic acid and palmitoyl-carnitine were converted into molar percentage excess (MPE). The fractional synthesis rate (FSR) of palmitoyl-carnitine was calculated by dividing the slope of incorporation of the label into palmitoyl-carnitine by the AUC of labelled palmitate (MPE) over a 1-h ex vivo experimental period and is expressed as %/h. The absolute synthesis rate (ASR) of palm-carnitine was calculated by multiplying the FSR by the concentration of palmitoyl-carnitine and expressed as nmol/l per min(Reference Chondronikola, Asghar and Zhang16).
Statistical analyses and data presentation
Data are presented as means and standard errors. The sample size was determined by the feasibility of minimally detectable effect sizes. The differences in parameters between the groups were evaluated using a two-way ANOVA with the factor’s diet (i.e. CNT or HFD) and time (i.e. 5 or 10 weeks) with post hoc Tukey correction. The approximate normality of model residuals was verified using normal quantile plots. Pairwise correlations between palmitoyl-carnitine FSR select outcomes of interest were determined using linear regression. P < 0·05 was considered statistically significant.
Results
Systemic and tissue metabolism
All results are presented in Table 1. HFD of 5 and 10 weeks resulted in a gain of 0·65 (se 0·16) and 1·19 (se 0·83) kg of body weight from the baseline, respectively. However, no significant differences in body weight were observed between the CNT and HFD groups at either time point. HFD significantly increased the plasma concentration of NEFA at both time points; while the lipolysis rate (Ra) only trended to decline over time. Western blot analyses of scAT samples confirmed these data, demonstrating that although the expression of total perilipin was significantly lower in HFD-10, the phosphorylated perilipin:total perilipin ratio was not altered (Fig. 1, Table 1). The expression of adiponectin and TLR4 as markers of inflammation in scAT did not differ between the HFD and CNT groups (Fig. 1, Table 1). Furthermore, liver and muscle lipid contents were not significantly altered by HFD.
Table 1. Characteristics of rabbits* (Mean values with their standard errors)

CNT, control; HFD, high-fat diet; Ra, rate of appearance; HOMA-IR, homeostatic model assessment of insulin resistance; t-PLIN, total perilipin; p-PLIN, phosphorylated perilipin; TLR4, toll-like receptor 4.
* Differences were determined using two-way ANOVA with time and diet interaction with post hoc Tukey adjustment. P < 0·05 was considered as statistically significant.

Fig. 1. Western blot images of subcutaneous adipose tissue samples. CNT, control; HFD, high-fat diet; p-p38, phosphorylated p38; t-p38, total p38; p-ERK1/2, phosphorylated ERK1/2; t-ERK1/2, total ERK1/2; TLR4, toll-like receptor 4; LC3A/B, microtubule-associated proteins 1A/1B light chain 3.
Although not reaching statistical significance, HFD-5 averaged 24 and 81 % higher plasma glucose and insulin levels, respectively, compared with CNT-5. The HFD-10 group had significantly higher levels of glucose (P = 0·005), insulin (P = 0·027), HOMA-IR (P = 0·008) and disposition index (P = 0·004) when compared with CNT-10. HOMA-IR (P = 0·042) and disposition index (P = 0·023) were also higher in HFD-10 when compared with the HFD-5 group; no differences were observed in HOMA-β due to the dietary intervention at either time point (Table 1).
Inflammatory pathways in peripheral blood mononuclear cells
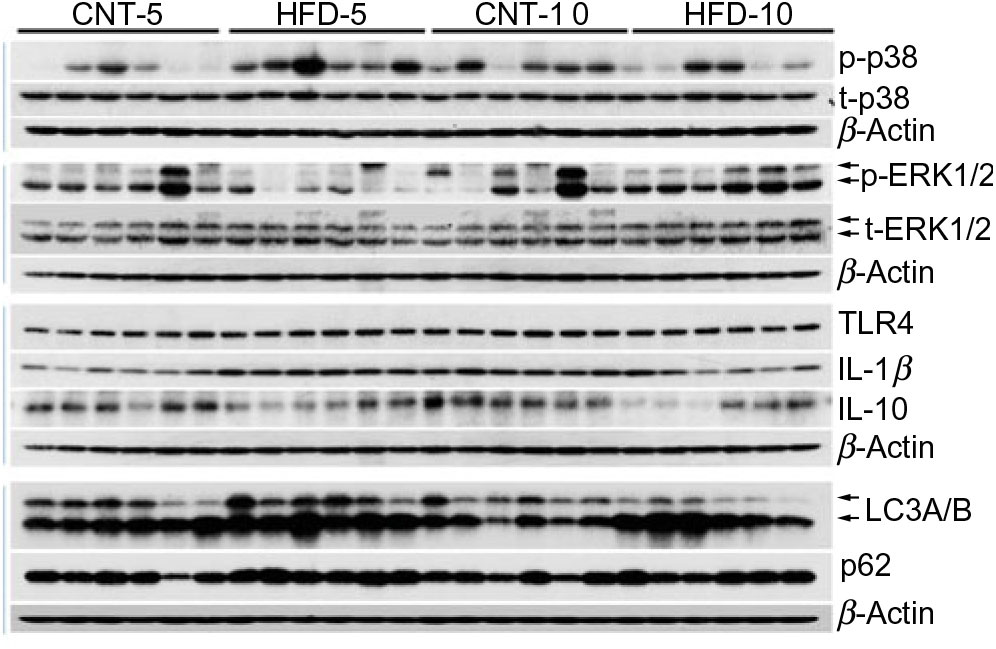
All data are presented in Fig. 2 and Table 2. HFD did not affect the expression of t-p38, while the expression of t-ERK1/2 significantly increased in HFD-10 when compared with CNT-10 (P = 0·002). Compared with age-matched groups (i.e. CNT-5 and CNT-10, respectively), the activation of p38 (i.e. p/t-p38) significantly increased in HFD-5 group (P < 0·001) but decreased in HFD-10 group (P = 0·028). The expression of p-ERK1/2 significantly decreased in the HFD-5 group (P = 0·008).

Fig. 2. Western blot images of peripheral blood mononuclear cell samples. CNT, control; HFD, high-fat diet; p-PLIN, phosphorylated perilipin; t-PLIN, total perilipin; TLR4, toll-like receptor 4.
Table 2. Quantification of Western blot analyses of peripheral blood mononuclear cells (PBMC)* (Mean values with their standard errors)

CNT, control; HFD, high-fat diet; t-p38, total p38; p-p38, phosphorylated p38; t-ERK1/2, total ERK1/2; p-ERK1/2, phosphorylated ERK1/2; TLR4, toll-like receptor 4; LC3A/B, microtubule-associated proteins 1A/1B light chain 3.
* Differences were determined using two-way ANOVA with time and diet interaction with post hoc Tukey adjustment. P < 0·05 was considered as statistically significant.
The expression of TLR4 did not differ between the groups at any time point, while the expression of IL-1β significantly increased in HFD-5 (P = 0·007). The expression of IL-10 significantly decreased in the HFD-10 group when compared with CNT-10 group (P = 0·011). The IL-1β:IL-10 ratio was more than doubled in both HFD groups when compared with the corresponding CNT groups; however, the difference reached statistical significance at the 10-week time point (P = 0·011; Table 2).
Autophagy pathways in peripheral blood mononuclear cells
All data are presented in Fig. 2 and Table 2. The expression of microtubule-associated proteins 1A/1B light chain 3 (LC3A/B-I) significantly decreased (P = 0·029) and the expression of LC3A/B-II significantly increased (P = 0·022) in the HFD-10 group when compared with the CNT-10. As a result, the ratio of LC3A/B-II/I significantly increased in the HFD-10 group when compared with the CNT-10 group as well as the HFD-5 group (P < 0·001). The expression of p62 increased in the HFD-5 group (P = 0·006) but remained unchanged in the HFD-10 group (P = 0·265) when compared with age-matched CNT groups.
Acylcarnitine metabolism in peripheral blood mononuclear cells
All data are presented in Table 3. The ex vivo FSR of palmitoyl-carnitine was significantly higher in the HFD-5 group when compared with the CNT-5 group (P < 0·001) due to significantly higher slope of incorporation of the tracer into palmitoyl-carnitine (i.e. the enrichment of U-[13C16]-palmitate-carnitine; P < 0·001). While in the HFD-10 group, the FSR of palmitoyl-carnitine was significantly lower when compared with CNT-10 group (P = 0·002). The ex vivo ASR of palmitoyl-carnitine tended to be higher in the HFD-5 group (P = 0·060) when compared with the CNT-5 group but significantly lower in the HFD-10 group compared with CNT-10 (P = 0·048) and HFD-5 (P = 0·020) groups.
Table 3. Acylcarnitine metabolism in peripheral blood mononuclear cells (PBMC)* (Mean values with their standard errors)

CNT, control; HFD, high-fat diet; MPE, molar percentage excess; FSR, fractional synthesis rate; ASR, absolute synthesis rate.
* Differences were determined using two-way ANOVA with time and diet interaction with post hoc Tukey adjustment. P < 0·05 was considered as statistically significant.
Linear regression analyses
The FSR of palmitoyl-carnitine was directly, though moderately, associated with the expression of p/t-p38 (r 0·468, P = 0·024), and IL-1 β (r 0·498, P = 0·015).
Discussion
Systemic low-grade inflammation is a main determinant of metabolic complications leading to the development of obesity-related chronic diseases(Reference Shoelson, Herrero and Naaz22– Reference Hotamisligil24). Thus, understanding the pathogenesis of this inflammation is critical in developing interventions to promote healthy living. Adipose tissue inflammation and the activation of circulating inflammatory cells are components of systemic low-grade inflammation(Reference Hotamisligil24). However, the sequence of inflammatory events in the early stages of weight gain is still not well understood. Specifically, it is still unknown whether activation of inflammatory pathways in scAT precedes that of circulating immune cells (i.e. PBMC). Our results demonstrate that HFD induces an impairment in systemic substrate metabolism and activation of inflammatory and autophagy pathways in PBMC before metabolic and inflammatory changes occur in scAT.
High-fat diet-induced impaired systemic metabolism precedes changes in adipose tissue
HFD is well known to cause the development of metabolic abnormalities. Some, but not all, overfeeding studies have demonstrated that comparable periods of HFD resulted in significant increase in body weight and impaired tissue lipid metabolism(Reference Cuthbertson, Steele and Wilding25– Reference von Frankenberg, Marina and Song28). In the present study, HFD did not significantly affect body weight, adipose tissue metabolism (i.e. Ra and activation of PLIN), inflammatory status (i.e. TLR4) or the deposition of lipids in liver and muscle (Table 1). This can potentially be explained by the differences in diet and fat composition(Reference Lionetti, Mollica and Sica26). The total and saturated fats in our study diet were approximately 21 and 10 %, respectively, amounts comparable to the average American daily intake(29), but less than the 35 % total and 12 % saturated fats in a typical experimental Western-style diet(Reference Lionetti, Mollica and Sica26). Nevertheless, the HFD caused severe hyperfattyacidaemia in both 5- and 10-week studies (Table 1). These data suggest that the scAT was in a state of adaptive expansion to accumulate the excess energy intake and that, under our study conditions, a 5-week or 10-week HFD feeding did not result in impaired tissue lipid metabolism with ectopic fat depositions. HFD led to worsening glycaemic control over time with the development of IR in HFD-10 group (Table 1), similar to other studies(Reference Tam, Viardot and Clément7, Reference Cuthbertson, Steele and Wilding25, Reference Koopman, Caan and Nederveen30). In summary, a 5-week HFD impaired systemic lipid metabolism with increased levels of circulating NEFA, and a 10-week HFD impaired glycaemic control; however, these changes preceded the changes in muscle, liver and adipose tissue lipid metabolism as well as scAT inflammatory status.
High-fat diet-induced activation of inflammatory pathways in peripheral blood mononuclear cells
The main aim of the present study was to determine the effect of HFD on activation of inflammatory pathways in PBMC. Previous studies showed activation of mitogen-activated protein kinase (MAPK; i.e. p38 and ERK1/2) pathways in lymphocytes and monocytes of patients with type 2 diabetes(Reference Tchaikovski, Olieslagers and Böhmer31– Reference Olieslagers, Pardali and Tchaikovski33). In experimental models, specific inhibition of MAPK pathways in macrophages suppressed pro-inflammatory responses with delayed onset of diabetes(Reference Jeong, Hsu and Lee34). Therefore, the MAPK pathway is important in obesity-related inflammation. Indeed, after 5 weeks of HFD, a significant activation of p38 (i.e. p/t-p38) and increased expression of IL-1β were observed (Fig. 2, Table 2), though the ERK1/2 was either decreased in HFD-5 or unaffected in HFD-10. Both p38 and ERK1/2 are involved in the MAPK pathway, and p38 is strongly associated with inflammation but ERK1/2 with cell differentiation pathways(Reference Johnson and Lapadat35). To determine the mechanisms of MAPK pathway activation, we measured the expression of TLR4 and IL-1β. TLR4, a member of the pattern-recognition receptor family TLR, is a well-known receptor involved in SFA-induced activation of inflammatory pathways including MAPK pathways(Reference Jialal, Kaur and Devaraj36, Reference Kochumon, Wilson and Chandy37). The expression of TLR4 did not differ between groups at any time (P > 0·05; Fig. 2, Table 2). IL-1β is also known to activate the MAPK pathways(Reference Kulawik, Engesser and Ehlting38). Indeed, the expression of IL-1β followed the pattern of changes in expression of p/t-p38 and was significantly increased only in HFD-5 (Fig. 2, Table 2). These data may suggest that HFD caused inflammatory changes in the PBMC of rabbits via IL-1β but not TLR4-involved mechanisms. However, these changes occurred after short-term (i.e. 5 weeks) HFD only, because the expression of both p-p38 and IL-1β returned to CNT-5 levels in the HFD-10 group (Fig. 2, Table 2). This may suggest that either adaptive mechanisms combating the inflammatory changes are being activated or other changes, yet unknown, are occurring that result in the ‘quiescence’ of inflammatory response at 10 weeks of HFD. The expression of IL-10, a potent anti-inflammatory cytokine(Reference Bazzoni, Tamassia and Rossato39), was 32 % lower in the HFD-5 group than that in CNT-5 (P = 0·074), and 48 % lower in the HFD-10 group than that in CNT-10 group (P = 0·011; Fig. 2, Table 2). These data may suggest that IL-10 may not be involved in suppression of inflammation in PBMC in the HFD-10 group. However, IL-10 is the classical M2 or immune regulatory cytokine, while IL-1β is the classical M1 or inflammatory type(Reference Jamil, Shahid and Hasan21, Reference Bazzoni, Tamassia and Rossato39). Thus, HFD may lead to the loss of M2-type immune cells. As a result, although IL-1β did not differ between the HFD-10 and CNT-10 groups, the higher IL-1β:IL-10 ratio suggests that HFD-10 animals were immune compromised. In summary, short-term HFD (i.e. HFD-5 group) induced activation of inflammatory pathways in PBMC in vivo in rabbits and ultimately immune deficiency in the HFD-10 group.
High-fat diet-modified autophagy pathways in peripheral blood mononuclear cells
Autophagy plays a housekeeping role in clearing misfolded or aggregated proteins and damaged organelles and has also been shown to suppress excessive inflammation(Reference Zhong, Umemura and Sanchez-Lopez40). Activation of microtubule-associated proteins 1A/1B light chain 3 (LC3), a central protein in the autophagy pathway(Reference Klionsky, Abdelmohsen and Abe41), is the main step in monocyte–macrophage pro-inflammatory differentiation(Reference Zhang, Morgan and Chen13). Upon autophagic signal, the LC3A/B-I isoform undergoes lipidation to form the LC3A/B-II isoform, which shows faster electrophoretic mobility in SDS-PAGE gels and thus shows up at 14–16 kDa, in comparison with 16–18 kDa for LC3A/B-I. The increased ratio of LC3-II:LC3-I is a marker for autophagosomes formation. LC3A/B-II/I was significantly increased in PBMC of the HFD-10 group (Fig. 2, Table 2), suggesting the formation of autophagosomes. Thus, these data may suggest that autophagosomes were formed as a response to activation of inflammatory pathways. However, the autophagy process is comprised of autophagosome formation, fusion of autophagosomes with lysosomes into autophagolysosomes and the maturation of this complex for degradation or sequestration. p62 is an autophagy substrate that delivers ubiquitinated cargoes for autophagic degradation and is used as a reporter of autophagy activity. Active degradation of autophagolysosomes reduces p62 expression, while unchanged or increased p62 expression, along with increased LC3A/B-II/I, suggesting modification of the autophagy pathway(Reference Klionsky, Abdelmohsen and Abe41). Here p62 expression increased in the HFD-5 group but unchanged in the HFD-10 group (Fig. 2, Table 2). These data demonstrate that HFD induced a modified autophagy in PBMC in vivo. Increased expression of both LC3A/B-II and p62 is critical in GM-CSF-induced monocyte–macrophage differentiation, suggesting that this modified autophagy pathway is crucial in this process(Reference Zhang, Morgan and Chen13). In obese mice, impaired macrophage autophagy enhanced pro-inflammatory monocyte–macrophage polarisation(Reference Liu, Zhao and Ilyas42). RostamiRad et al. also showed that treating PBMC with palmitate significantly increases LC3A/B and p62 expressions(Reference RostamiRad, Ebrahimi and Sadeghi12). In summary, our data suggest that a 10-week HFD induced modified autophagy in PBMC in vivo in rabbits.
Acylcarnitine metabolism in peripheral blood mononuclear cells
The activation of inflammatory pathways can be caused by intermediate lipid metabolites (i.e. acylcarnitines), which we previously reported were produced in PBMC using NEFA(Reference Chondronikola, Asghar and Zhang16). We also demonstrated that the ASR of palmitoyl-carnitine, estimated during a hyperinsulinaemic–euglycaemic clamp, inversely correlates with the degree of systemic insulin sensitivity in healthy overweight women. Therefore, we measured the ex vivo FSR and ASR of palmitoyl-carnitine by blood cells(Reference Chondronikola, Asghar and Zhang16). The ex vivo FSR of palmitoyl-carnitine was significantly higher in the HFD-5 group than in the CNT-5 group but significantly lower in the HFD-10 group than in the CNT-10 group. The mechanism of adaptation to an HFD or high-energy intake is an increase in fat mass and/or in FAO until a new equilibrium is reached to accommodate the intake(Reference Koves, Ussher and Noland43). However, in an IR or metabolically unhealthy state, the FAO is lower and cannot accommodate the excess energy intake(Reference Kelley, Goodpaster and Wing44). Thus, our data on palmitoyl-carnitine synthesis in PBMC follow this pattern of adaptive FAO with HFD intake. Interestingly, the linear regression analyses demonstrated a direct, albeit moderate, correlation of acylcarnitine metabolism with p/t-p38 and IL-1β expression. Therefore, p38 activation and increased IL-1β expression may result from HFD-induced enhanced FAO as estimated by the ex vivo FSR of palmitoyl-carnitine. Vice versa, the lower FSR in the HFD-10 group may explain the ‘quiescence’ of inflammatory pathways or the switch inducing the modified autophagy.
Study limitations
(1) For the HFD group, a chow diet was supplemented with 18 % fat. Thus, the proportion of nutrients, not only fats, was different between the diet (supplemental file). In our future studies, we may consider using dietary approaches that differ in composition of macronutrients but not of other nutrients. In general, rabbits’ food of choice contains low fats. However, rabbits fed HFD or high-cholesterol diet develop impaired fat metabolism like that of humans with obesity(Reference Zhang, Chinkes and Aarsland14) or typical characteristics of atherosclerosis(Reference Taylor, Huang and Bodde45), respectively. Thus, we think that the HFD used in the present study is acceptable to allow the present conclusions to be drawn. (2) We did not study VAT in the present study. The currently available data suggest that scAT ability to accumulate lipids is instrumental in averting the expansion of VAT in early stages of weight gain as well as in the development of obesity-associated metabolic abnormalities(Reference Alligier, Gabert and Meugnier8, Reference Pan, Ciociola and Saraf17, Reference Cuthbertson, Steele and Wilding25, Reference Tuvdendorj, Chandalia and Batbayar46, Reference Abate and Chandalia47). However, we plan to study VAT in the future. (3) Our study lacks interventions to determine whether averting the changes in FAO in PBMC prevents the activation of inflammatory and autophagy pathways, which will be addressed in future studies.
Conclusion
Our data confirm that HFD caused hyperfattyacidaemia, peripheral IR, enhanced FAO and activation of inflammatory and autophagy pathways in PBMC, without changes in scAT metabolism and inflammation. These outcomes are similar to those observed in humans with obesity. The time course of these changes was not straightforward, with some occurring after 5 weeks and others after 10 weeks of HFD. The adaptive metabolic and anti-inflammatory response to the diet may be the main explanations for our findings. (a) Excessive FAO causes a domino effect, activating inflammatory and autophagy pathways in PBMC and subsequent systemic low-grade adipose tissue inflammation and (b) if dietary antioxidants correlate with a better health outcome, our findings may explain why, within a group with comparable BMI, some are metabolically healthier than others(Reference Mongraw-Chaffin, Foster and Anderson48, Reference Guo and Garvey49). Although the detailed mechanism is not yet characterised, we hypothesise that dietary hyperfattyacidaemia causes enhanced FAO-induced activation of p38 in PBMC, which may induce the activation of autophagy pathways. Alternatively, IR or an impaired glycaemic control-associated decline in FAO (HFD-10) activated the autophagy pathways. Because (a) impaired activation of autophagy pathways plays a crucial role in monocyte–macrophagy differentiation and (b) the Western lifestyle is characterised by a continuous postprandial state, PBMC undergoing cycles of activation of inflammatory/autophagy pathways may be the metabolic mechanism linking HFD to systemic low-grade inflammation. Thus, interventions to avert HFD-induced early activation of inflammatory and modified autophagy pathways in PBMC could help to prevent metabolic and inflammatory complications of obesity and promote healthier living.
Acknowledgements
We thank Christopher Danesi, Kathleen Randolph and Anahi D. Delgadillo for help with sample analyses. We thank Dr Sarah Toombs-Smith for the critical editing of this work.
The present study was supported by the 1KL2TR001441 NIH Training grant, the Institute for Translational Sciences at the UTMB, and in part by a Clinical and Translational Science Award (no. UL1 TR001439) from the National Center for Advancing Translational Sciences, National Institutes of Health, and the Shriners Grant no. 84090, Metabolism Unit, Shriners Hospitals for Children.
D. R. T. was responsible for hypothesis generation and securing funds. J. E. L., C. A., E. M., D. L. B. and D. R. T. conducted the study. B. T., T. J. W., E. L. D., T. B. S., C. P., J. J. E. and D. R. T. analysed the samples. J. E. L., B. T., T. J. W., E. L. D., T. B. S., C. P., J. J. E., M. S.-M., E. V., R. F., N. A. and D. R. T. analysed and interpreted the data. C. R. A. and D. R. T. performed the statistical analyses. All contributors were responsible for manuscript writing, editing and final approval.
The authors declare no competing financial interests.
Supplementary material
To view supplementary material for this article, please visit https://doi.org/10.1017/S0007114519002472