


Introduction
X-ray analysis via energy dispersive spectrometry (XEDS) is a routine method of elemental analysis in a scanning/transmission electron microscope (S/TEM). However, analytical electron microscopy (AEM) may be susceptible to artifacts such as system and spurious X-rays, which can introduce errors into both qualitative and quantitative analysis [Reference Williams and Carter1]. Figure 1 shows a schematic diagram of a focused ion beam (FIB)-prepared specimen mounted on a support grid inside an AEM [2]. The incident beam creates desired X-rays from the specimen but also creates scattered electrons and the specimen-generated continuum (not shown), which can additionally create X-rays or back-scattered electrons (BSEs) that can contribute to spurious X-ray detection. Figure 1 is not to scale, and note that the 3 mm grid is much smaller than the other features in the AEM. In addition, the sample itself is orders of magnitude smaller than the grid, so the relative X-rays and signal coming from the sample is much smaller in comparison to other background signal that contributes to the overall measured X-ray intensities.
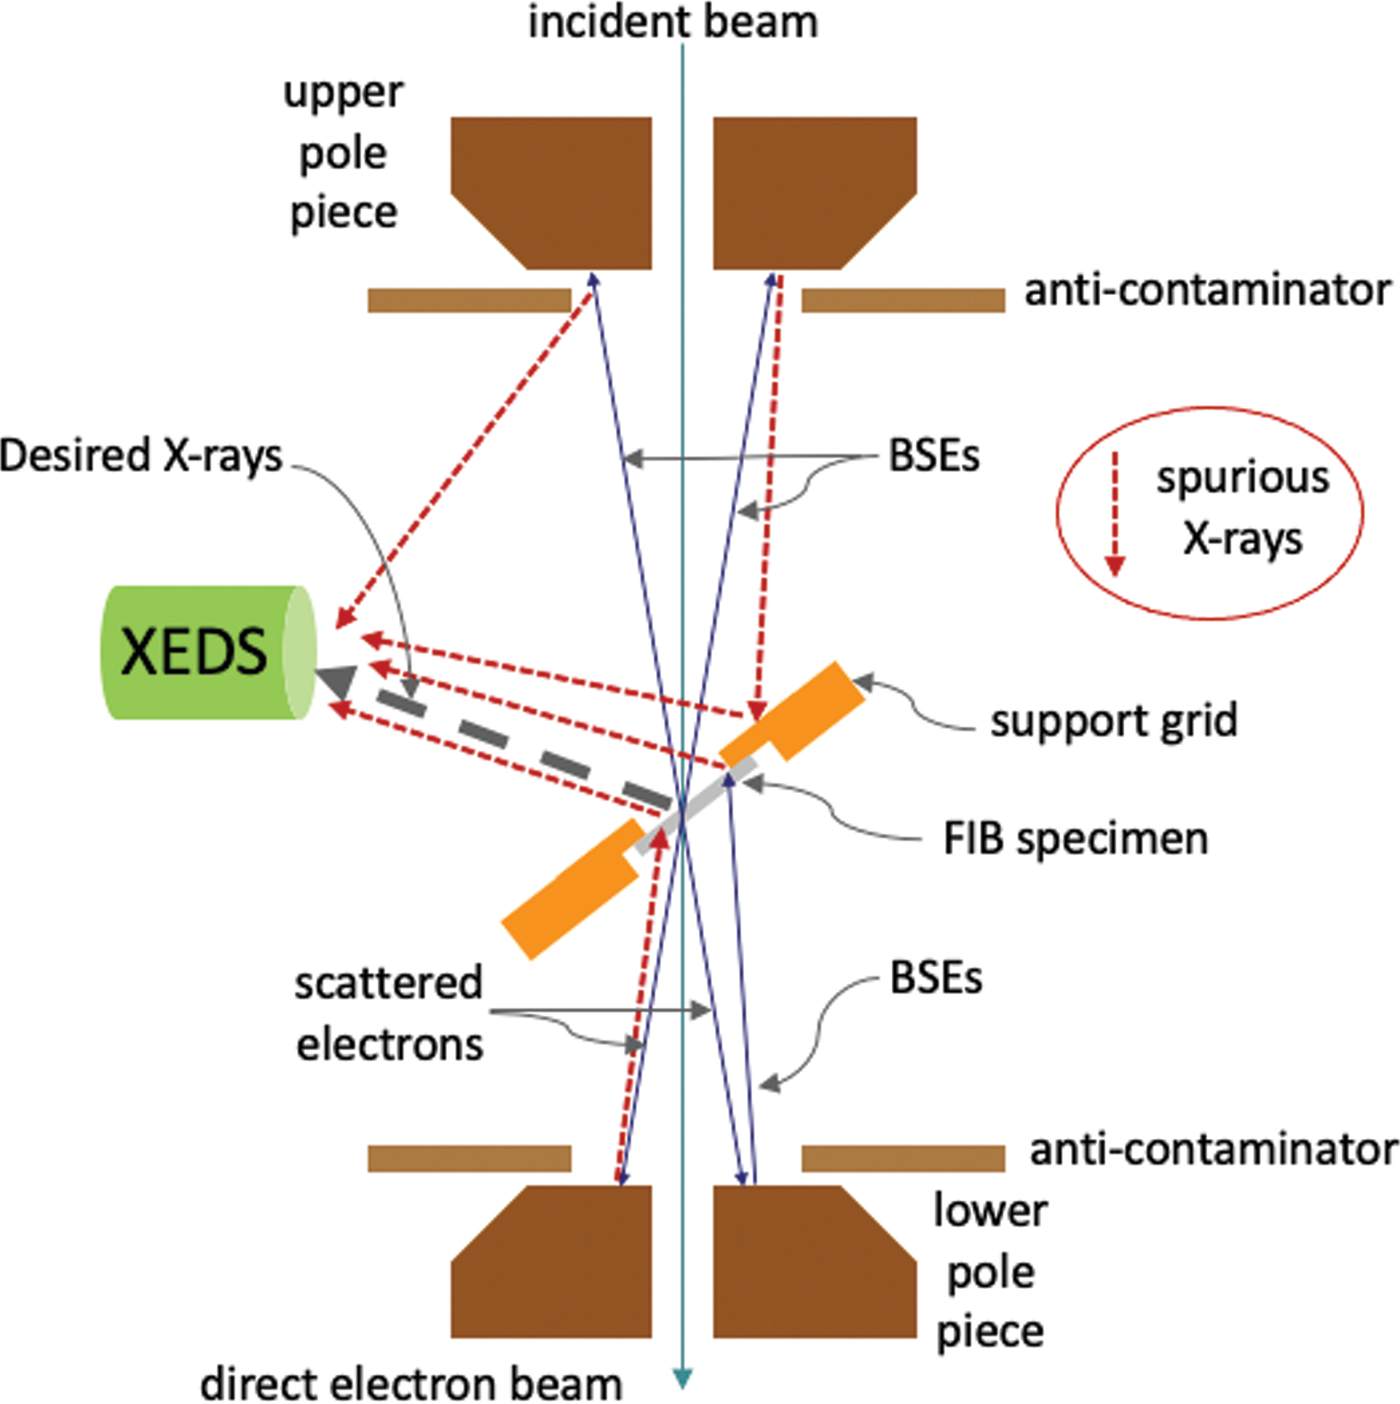
Figure 1: Schematic diagram showing sources of spurious X-rays (red dotted lines) inside an analytical electron microscope. Adapted from [2].
Minimizing specimen tilt can minimize the effects of scattered radiation [Reference Williams and Carter1], but this is not always practical for materials or structures that must be aligned to interfaces or other pertinent microstructural features. Alternatively, mounting a specimen on a low atomic number (Z) grid material such as Be can reduce post-specimen scattering [Reference Lyman3]. However, Be is highly toxic, difficult to machine/fabricate, and requires careful handling.
The use of FIB methods for S/TEM specimen preparation is pervasive [Reference Giannuzzi and Stevie4]. However, since the size of the FIB specimen (~ 10–20 μm × ~ 5–10 μm) is dwarfed by the half-circle 3 mm support grid (for example, Cu, Mo, or Ni), spurious X-rays from the grid material are inevitable. As shown in Figure 1, the grid material will likely fluoresce and yield spurious X-rays [2]. This can be problematic when trying to identify specimen elements that either overlap the X-ray energy of the grid material or directly interfere with the specimen and grid. For example, when trying to identify Cu in a specimen, a Cu grid should be avoided. Other grid materials, such as Si, Mo, Ni, Au, etc., are commercially available, but the problem of having a background signal from the grid mixed with the sample will usually be present.
An ideal situation would be to have a grid made from a low-Z material that minimizes the number of fluoresced X-rays that could potentially obscure or overlap with a low-count X-ray signal from the specimen. For example, Be parts are often used in TEM holders precisely because they are low-Z and they contribute a very low (almost undetectable) background to the X-ray signal. However, Be components are not a good option as a consumable part that must be repeatedly used or consumed with each specimen. Thus, we have developed low-Z nanocrystalline diamond (NCD) FIB grids for AEM to reduce the effects of post-specimen scattering and eliminate interferences between the specimen and the grid for more accurate analytical work.
Our goal here is to evaluate the scientific usefulness of the new low-Z NCD grids. We will provide measurements of these grids inside analytical microscopes, both scanning electron microscopy (SEM) and transmission electron microscopy (TEM), that show typical X-ray spectra under normal analytical operating conditions to demonstrate their usefulness. The potential advantages to the low-Z NCD grids are that they (i) are conductive, (ii) can be subjected to high-temperature heating experiments, and (iii) are excellent for analytical work since X-ray fluorescence or high-energy overlaps are reduced or eliminated. The 3 mm NCD grids are produced in either a half or full 3 mm grid geometry, allowing use for both FIB ex situ lift-out (EXLO) and in situ lift-out (INLO) specimen preparation, or for thin film analyses [Reference Giannuzzi5].
Methods and Materials
NCD grids have been produced using conventional lithography and chemical vapor deposition methods using a Si substrate. The NCD grids were designed with slots and dimensions consistent with previously developed grids for FIB EXLO [Reference Giannuzzi5]. While not developed for INLO per se, they can indeed be used for FIB INLO techniques. The advantages to the slots are that (i) the surfaces provide sufficient area for Van der Waals forces for EXLO specimens, and (ii) the slotted surfaces lie between the outer edges of the grid, thereby protecting the specimen during handling and storage. Figure 2 shows light optical micrographs (2a, 2c) and SEM images (2b, 2d) of the half (2a, 2b) and full grids (2c, 2d). The grids are less than 30 μm thick and brittle, so they do not bend like a metal grid and can fracture if mishandled. Vacuum tweezers are the preferred method of handling over forceps.

Figure 2: Images of the 3 mm diameter low-Z NCD grids. (a, c) Optical images of the half and full NCD grids, respectively. (b, d) SEM images of the slot regions of the half and full low-Z NCD grids, respectively.
Results and Discussion
Figure 3 shows 30 keV SEM XEDS results obtained from a surface of the low-Z NCD grid. The only peak in the SEM-acquired spectrum is C kα, which is consistent with the elemental diamond phase.

Figure 3: 30 keV SEM XEDS spectrum from the surface of a low-Z NCD grid showing only the presence of C.
We tested the low-Z NCD grids in an AEM at 300 keV under a variety of conditions, both with and without a FIB specimen mounted on the grid. First, we collected a “hole count” spectrum [Reference Williams and Carter1], passing the electron beam through vacuum with no objective aperture inserted. As shown by the spectrum in Figure 4, the absence of any significant X-ray peaks for the hole count indicates that the AEM is well-aligned [Reference Williams and Carter1].

Figure 4: 300 keV STEM XEDS hole count spectrum indicated by the red lines. The virtual absence of X-ray peaks indicates the AEM is well-aligned.
Next, we compared XEDS results between a hole count with the objective aperture inserted and the surface of the low-Z NCD grid in the AEM under the worst conditions possible—that is, TEM mode was used with the largest probe possible that the detector could handle with reasonable dead time. XEDS with the objective aperture inserted allowed us to identify all possible system peaks in the AEM illumination system. Figure 5 shows a comparison of XEDS spectra between vacuum with objective aperture inserted and the low-Z NCD grid obtained in TEM mode. The XEDS spectrum with the aperture inserted shows obvious peaks from the aperture material as well as other elements from the pole piece and specimen holder. The Pt peaks from the aperture dominate the spectrum with other X-rays detected from the illumination system, indicating the presence of Mo, Zr, Cu, Fe, Co, with possible Al, Si, W, and O. When the objective aperture was removed and the beam placed on the NCD grid, the Pt peak essentially disappeared. The C peak now dominates the low-Z NCD spectrum and the Fe, Co, Mo, Cu, and Zr are significantly suppressed. The only other peaks that may be linked to the low-Z NCD grid are possibly Si (the NCD original substrate material) and O.

Figure 5: 300 keV XEDS spectra acquired in TEM mode. The blue line shows an XEDS spectrum from vacuum with the objective aperture inserted, and the magenta line is from the surface of the low-Z NCD grid. The peaks in the blue line are due to the TEM aperture, pole piece, and specimen holder.
Next, we compared the same TEM XEDS spectra from the low-Z NCD grid surface (per Figure 5) to the Cu grid surface in Figure 6. Note that the intensity full scale in Figure 6 is 5000 counts, while that in Figure 5 was 24000 counts. The higher atomic number Cu grid fluoresces the system X-rays (Cu, Fe, Co, Mo, Zr, Pb) by more than 5× the intensity compared to the low-Z NCD grid. The low energy C X-rays that are generated are too small in energy to excite X-rays from the high-Z materials in the illumination system. In addition, the low-Z NCD grid background (for example, bremsstrahlung) is significantly reduced at high energy starting from
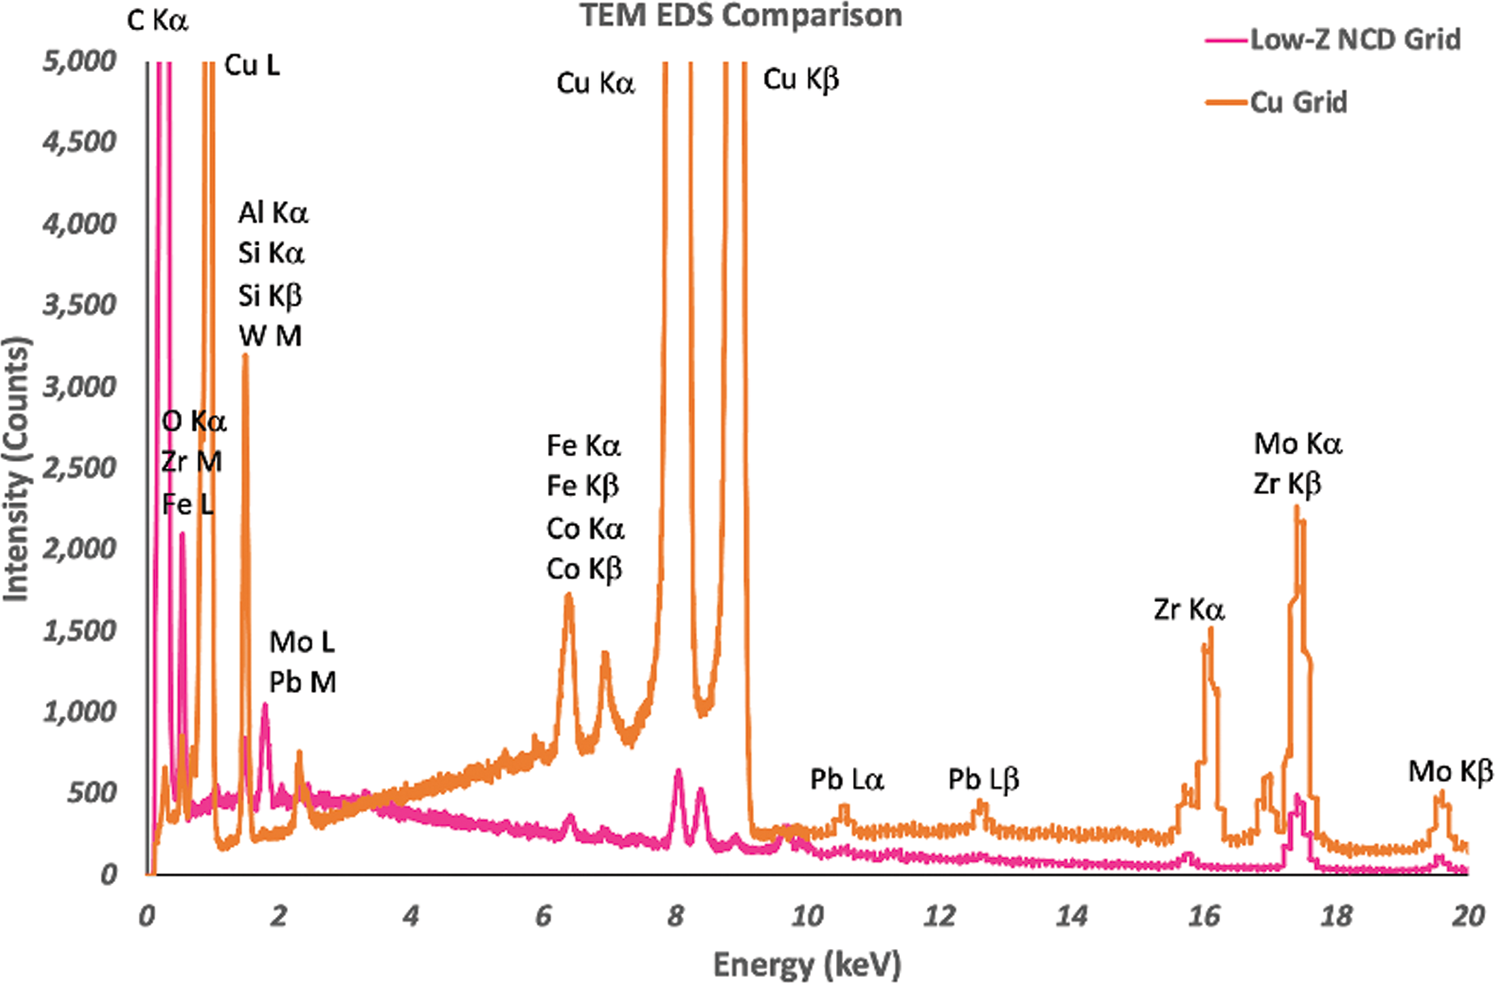
Figure 6: 300 keV XEDS spectra acquired in TEM mode. The orange line shows an XEDS spectrum from the surface of a Cu grid, and the magenta line is from the surface of the low-Z NCD grid. The reduced high-energy background and spurious peak intensities using the NCD grid is particularly noticeable.
~ 2–2.5 keV onward. This is significant because low concentrations (for example, smaller counts) of high-energy peaks would be easier to identify with a lower background compared to a higher background.
If we do a standardless quantification of the elements from the spectra in Figure 6 as shown in Figure 7, the low-Z NCD grid returns nearly 99 atomic % of the C, while the Cu grid returns only ~ 93 atomic % of Cu. About 0.5 atomic % Mo is observed to fluoresce from the low-Z NCD grid while nearly 5× that much, or 5 atomic % Mo, is observed to fluoresce from the Cu grid. There are no other elements detected (other than C) greater than about 0.5 atomic % from the low-Z NCD grid. By comparison, the Cu grid also fluoresces more than 0.5 atomic % of Al and Zr. Additionally, if the modeled background counts for the spectra shown in Figure 6 are summed across the entire energy range from 0 to 20 keV, the Cu grid has a total of 1.6 × 10⁶ counts versus 7.5 × 10⁵ counts for the NCD grid. So, the Cu grid generates a background more than 2 times the background counts from the low-Z NCD grid.

Figure 7: Standardless quantitative XEDS analysis comparison between the low-Z NCD grid and Cu grid surfaces.
Finally, in Figure 8, we show 300 keV STEM XEDS results of FIB-prepared INLO specimens of (Ca,Ce)(Mn,Ti)O3 mounted on a Mo grid and on a low-Z NCD grid. An SEM image of the INLO specimen mounted on a low-Z NCD grid is shown in the inset. Since these two specimens may vary slightly in stoichiometry, we normalized the XEDS intensities to Ca. In both spectra, the primary constituents of Ca, Ce, Mn, Ti, and O are evident. However, system peaks of Mo (also a grid peak), Cu, Pb, and Zr are significantly suppressed with the NCD grid compared to the Mo grid. As before, the background observed from the NCD grid, particularly at high X-ray energy, is much less when compared to the Mo grid, which helps to reduce fluorescence of extraneous system peaks. Note that the difference in Ga peaks may be due to slight differences in FIB specimen preparation methods between the two specimens.
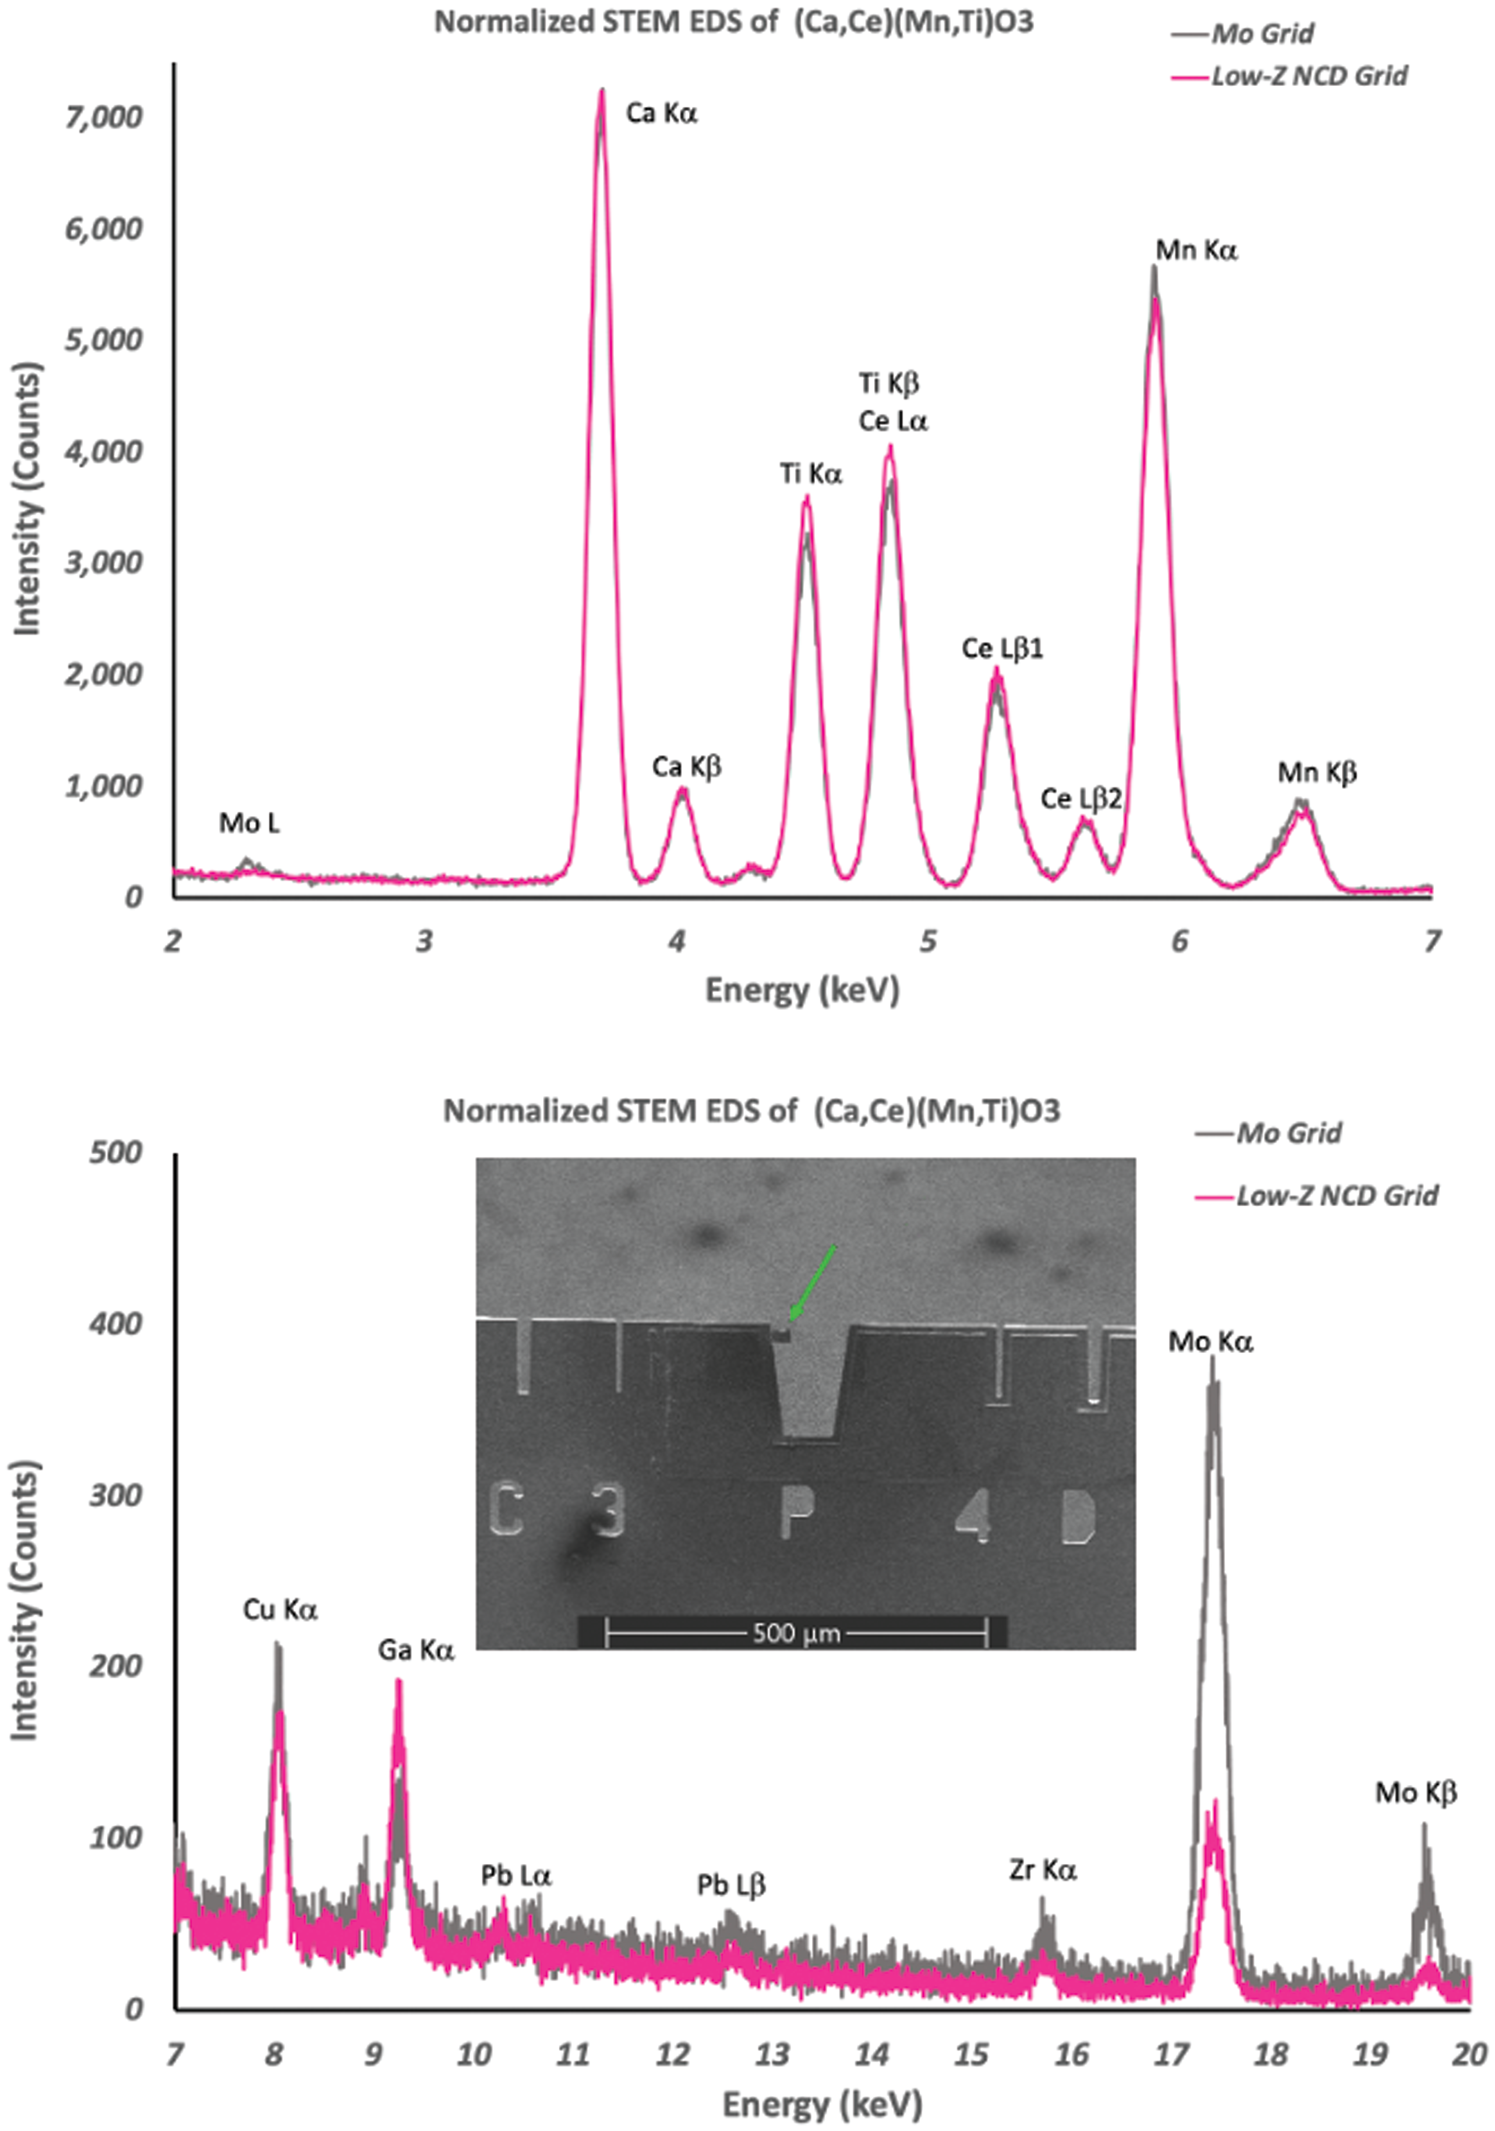
Figure 8: 300 keV STEM XEDS spectra comparison of (Ca,Ce)(Mn,Ti)O3 mounted on a Mo half-grid (magenta line) versus slow-Z NCD half-grid (black line) normalized to Ca. Spectra were collected from 2 through 20 keV. Note the x-scale difference in the left and right portions of the spectra. An inset of an SEM image of the specimen mounted (arrow) on the low-Z NCD grid is shown. The reduced Mo peaks, the reduced background, and other reduced spurious peaks (for example, Pb and Zr) using the NCD grid are obvious.
Conclusions
Low-Z NCD grids have been evaluated for potential analytical interferences between the specimen elements and the grid. The low-Z NCD grids significantly reduce (but do not eliminate) inherent system peaks and spurious X-rays from the specimen environment (holder, detectors, pole pieces, and apertures). The low-Z NCD grid also yields a reduction in bremsstrahlung, which can enhance the detection of low concentrations of high-Z materials [6].
Acknowledgements
Sandia National Laboratories is a multi-mission laboratory managed and operated by National Technology & Engineering Solutions of Sandia, LLC, a wholly-owned subsidiary of Honeywell International Inc., for the U.S. Department of Energy's National Nuclear Security Administration under contract DE-NA0003525. This paper describes objective technical results and analysis. Any subjective views or opinions that might be expressed in the paper do not necessarily represent the views of the U.S. Department of Energy or the United States Government.


