


The mother–child breastfeeding dyad is a powerful force for achieving healthy, secure and sustainable food systems. It represents a ‘first-food system’ in and of itself being paradoxically both a globally distributed form of food production(Reference Baker, Santos and Neves1,Reference Smith2) , and yet the world’s shortest, most localised food supply chain. When supported, breastfeeding women deliver ‘round the clock’ food on an equitable basis(Reference Roberts, Carnahan and Gakidou3), as well as providing nurturing care to infants and young children. Norway is unusual among high-income countries as virtually all Norwegian mothers initiate breastfeeding, and the country counts their milk production as part of the country’s food supply statistics. Our purpose is to show the potential value of collecting and analysing this data, using Norway as an example.
Breastfeeding provides a healthy start to life. As the biological ‘first-food’ for humans, the milk provided by the world’s breastfeeding mothers is a safe and nutritionally optimised food that is uniquely responsive to children’s evolving nutritional needs. Breastfeeding provides immunological and other factors which support healthy growth and development throughout the life course of the child as well as the health of the mother. Good evidence from a variety of country settings shows that not breastfeeding increases children’s risk of all-cause mortality, diarrhoea, respiratory infection and malocclusion, and likely obesity and type 2 diabetes in later life(Reference Victora, Bahl and Barros4). The child who breastfeeds in early life is more likely to achieve their full cognitive potential, and hence perform better at school and work in later life, which translates into higher productivity for wider society(Reference Rollins, Bhandari and Hajeebhoy5). For mothers, insufficient breastfeeding heightens the risk of breast cancer, and likely ovarian cancer and type 2 diabetes(Reference Victora, Bahl and Barros4). Breastfeeding also helps with birth spacing and benefits women’s reproductive health. Every year, over 820 000 child deaths from pneumonia and diarrhoea, nearly 1 million cases of child obesity, and 100 000 maternal deaths from cancers and type 2 diabetes can be attributed to not breastfeeding(Reference Victora, Bahl and Barros4). Society also benefits economically from high breastfeeding prevalence, as it helps reduce health treatment costs and avoid excess morbidity and mortality(Reference Walters, Phan and Mathisen6).
Despite the importance for early nutrition and public health, major food systems reports do not include breastfeeding women and their production of human milk. This is a remarkable omission, given that infants and young children (0–36 months) comprise 6% of the world’s population and consume significant amounts of breastmilk as a staple food source in all country contexts. Multi-country estimates show that breastfeeding contributes all the breastfed child’s energy needs during the period of recommended exclusive breastfeeding and about 35% in the second year of life when breastfeeding is continued(7). Arguably, food systems and monitoring frameworks that ignore breastfeeding will fail to identify important aspects of children’s interaction with the food system or key gaps and opportunities to address children’s dietary needs.
The WHO recommends initiating breastfeeding within the first hour after birth, thereafter exclusive breastfeeding for the first 6 months of life and introduction of nutritionally adequate and safe complementary (solid) foods at 6 months together with continued breastfeeding up to 2 years of age or beyond(8). Yet fewer than half of infants and young children worldwide meet these WHO recommendations for optimal nutrition. Whereas exclusive breastfeeding at the age of 6 months has increased from 35 % in 2005 to 42 % by 2019, and any breastfeeding at the age of 1 year has increased somewhat in high-income countries, continued breastfeeding has decreased in low-middle income countries and around 45 % of children are breastfeeding at the age of 2(Reference Neves, Vaz and Maia9,10) .
In contrast, recent studies show sales of commercial milk formula products, including infant formulas and toddler milks, are growing markedly(Reference Baker, Santos and Neves1). This trend is expected to continue, raising serious concern for global child and maternal health and further compounded by the harmful impacts of the COVID-19 pandemic on breastfeeding and early-life nutrition(Reference Rollins, Minckas and Jehan11). This global infant and young child transition towards a diet dominated by commercial ultra-processed foods(Reference Baker, Smith and Salmon12) highlights that breastfeeding is a vulnerable human food system. Existing policy and regulatory frameworks designed to protect, promote and support breastfeeding are currently failing to adequately protect child nutrition against continued global industry expansion(Reference Baker, Santos and Neves1).
Exclusive breastfeeding is one of WHO’s ‘Double Duty Actions for Nutrition’ to tackle the double burden of undernutrition and overweight, obesity and diet-related non-communicable diseases. Improving breastfeeding can also directly address food system sustainability and the relevant Sustainable Development Goals(Reference Dadhich, Smith and Iellamo13). It is now well recognised that structural and cultural contexts, health services, commercial influences, family and workplace settings, as well as individual factors shape breastfeeding practices(Reference Rollins, Bhandari and Hajeebhoy5), emphasising the important role of policies to protect, promote and support breastfeeding(8). Breastfeeding policies, programmes and investments framed by the 2003 WHO/UNICEF Global Strategy on Infant and Young Child Feeding is an important but neglected element of strategies for sustainable food systems(Reference Dadhich, Smith and Iellamo13). Well established, effective interventions on breastfeeding are available for integrated policy actions in all country settings(Reference Sinha, Chowdhury and Sankar14). Strengthening monitoring systems that track the progress of policies, programmes and funding towards achieving both national and global breastfeeding targets is one of the seven policy actions in the 2015 Call for Action by the Global Breastfeeding Collective, led by UNICEF and WHO.
To help correct the omission of human milk production in food systems monitoring frameworks and to give the food productivity of breastfeeding mothers greater visibility within food systems thinking, dialogue and action, we illustrate how this milk production can be estimated and incorporated in national and international food surveillance systems, using the example of Norway.
Norway has pioneered the measurement of human milk production and its inclusion into national food statistics and has been influential internationally in this regard. Estimates of milk production by Norwegian women (‘produksjon av morsmelk’) have now been present in Norway’s food statistics for over two and a half decades(15,16) . The terminology ‘mothers’ milk highlights and acknowledges women’s productivity and contributions to food supply for infants and young children and reflects its translation from the Norwegian word morsmelk in Norway’s official documents reporting its production. In this article, we use the term ‘human milk’ consistent with terminology in economic statistics and food surveillance systems that report on commercial milk products from other species, and ‘milk’ refers to ‘mothers’ milk’, ‘breastmilk’ or ‘human milk’.
A study in 1973 by a nutrition economist from the World Bank was the first to draw attention to the adverse economic and food supply implications of global declines in breastfeeding(Reference Berg17). Around this time, Norwegian delegates to the FAO of the UN sought to include breastfeeding in indicators of countries’ national food supply, and Norway was the first high-income country for which such estimates were made(Reference Oshaug and Botten18). Australia was the second(Reference Smith19).
Norway also has comprehensive and long-established policies in place to enable breastfeeding(Reference Skard, Busterud and Eide20). The Norwegian National Nutrition Council anticipated as early as the 1970’s that including human milk production in food statistics could serve to recognise its significance and motivate policies to protect breastfeeding(Reference Oshaug and Botten18). Studies of human milk production since that time have similarly been motivated variously by the desire to provide better scientific information for public policy and budgeting decisions, reduce the invisibility of women’s productivity, including breastfeeding and draw attention to the need for measures to prevent or address declines in breastfeeding. Breastfeeding rates are high in Norway compared with other high-income countries(Reference Vaz, Maia and Neves21). Nearly all mothers initiate breastfeeding and around half continue to do so at 12 months. Yet few children breastfeed exclusively for 6 months or breastfeed to 2 years or longer.
The aim of this study is to review trends in estimates of human milk production for infants and young children (0–24 months) in Norway between 1993 and 2018–2019 and to discuss and present this method for monitoring human milk production in national food statistics. We extensively discuss and assess key issues in such methodologies and elaborate further on the Norwegian experience of monitoring human milk production.
Methods
To address the study objective, we adopted the approach of reviewing all estimates of Norwegian human milk production since 1993, involving the following steps:
-
Firstly we describe the key data inputs and illustrate how these are used to make the estimates;
-
Secondly, we present summary data for annual estimates of human milk production drawing from successive reports for the period 1994–2020 and report calculations of the average per capita amounts of milk that mothers supplied each year for children aged 0–24 months; and
-
Finally, we assess the methods and assumptions used to estimate the production figures.
A table on human milk production is published in annual reports on trends in the Norwegian diet from the Norwegian Directorate of Health. The calculations have been made in a collaboration between the Norwegian Directorate of Health and the Norwegian National Advisory Unit on Breastfeeding. These official estimates of human milk production in Norway use the method developed and published by Oshaug and Botten in 1994(Reference Oshaug and Botten18). This is summarised below.
The estimation is based on data for annual number of live births, proportion of any breastfeeding at each month of age and daily human milk intake per breastfeeding child at each month of age.
Annual number of live births
The annual number of live births is provided by Statistics Norway from its basic collections(22). As the number of deaths of children aged 0–24 months is very low in Norway, the number of live births is taken to be the number of infants (0–12 months).
For simplicity, the same number of live births is also used as the number of toddlers (13–24 months), that is, children born in the previous year.
Proportion of breastfeeding
Calculations on human milk production use data on any breastfeeding at each month of age, for children 0–24 months. This was provided from the following surveys covering breastfeeding practices in Norway: data for 1993 from records in community health services in five counties(15), three national dietary surveys among infants and young children (in 1998–1999, 2006–2007, 2018–2019)(Reference Lande23–Reference Myhre, Andersen and Kristiansen31) and one national survey on breastfeeding in 2013(Reference Lande and Helleve32).
Further information on Norway’s data sources on births and dietary surveys for the 0–24 months age category is provided in Supplementary Table 1.
Estimates on daily human milk intake per breastfeeding child
The daily intake used by the Norwegian Directorate of Health to calculate national human milk production for the 0–24 months age group is based on data from the study by Oshaug and Botten (1994) with some minor adjustments made on the basis of a 2002 WHO report on human milk intake(Reference Butte, Lopez-Azarcon and Graza33). After such adjustments, the calculations assume that Norwegian mothers who breastfeed the baby throughout the first year of life will on average produce 225 l of milk, and breastfeeding in the second year will produce a further 81 l, for a total of 306 l of human milk during a lactation period of 0–24 months(16). Comparative human milk intakes from other studies are summarised in Supplementary Table 2.
Table 1 illustrates these calculations of human milk production in Norway, using the most recent data(16).
Table 1 Human milk production in Norway 2018–2019
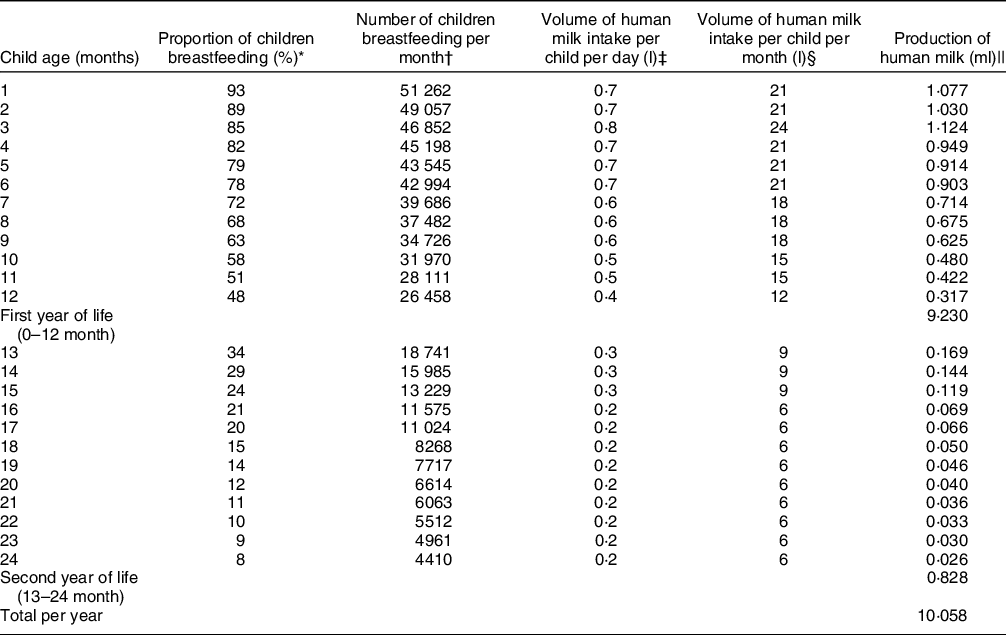
Source(16): with minor revision.
* Any breastfeeding, data from national dietary surveys among infants and young children (Spedkost and Småbarnskost (2018–2019). See references in text.
† Proportion of infants or young children breastfeeding each month multiplied by number of live births in 2018: 55 120.
‡ Estimates of daily human milk intake, based on Oshaug and Botten (1994) and minor adjustments according to the WHO study (Butte 2002).
§ Volume of human milk intake per child per month: volume of human milk per day multiplied by 30 d.
|| Production of human milk per month: number of children breastfeeding at each month of age multiplied by volume per child per month.
From the outset, it was recognised that the calculations rely on several assumptions and simplifications. Notably, as shown in Table 1, the estimates do not differentiate for whether the child is exclusively breastfeeding or not; hence the milk intake per day of 700–800 ml for a breastfeeding child is an approximation for the first 6 months. From 6 months, the amount of complementary food can replace breastmilk to a varying extent. Therefore, the calculated production can only indicate the size range. There have been only minor changes in these assumptions since the beginning of these estimations.
Results
The estimated total production of human milk for 0–24-month-old children in Norway increased from 8·2 to 10·1 million litres per year between 1993 and 2018–2019 (Table 2)(15,34,35) . The largest increase was seen during the 1990’s. After 2006–2007, the estimated milk production has fluctuated, with a decrease in 2013(36) and a small increase in 2018–2019(16).
Table 2 Human milk production in Norway 1993–2019*

* The calculations are based on average amounts of human milk production for children aged 0–24 months.
† This calculated as annual milk production divided by the number of children aged 0–24 months in that year.
When considering the variable number of births in this period, the average per capita volume of human milk per child (all children aged 0–24 months) per year increased from 69 l in 1993 to 91 l in 2018–2019, with a transient decline in 2013 (Table 2). This represents an overall increase in production per capita of around 30%.
Figure 1 shows the average human milk production per child during the lactation period of 0–24 months, separated into the first and second year of life. These figures differ from the annual per capita figures in Table 2. Most of the milk produced (92 % in 2018–2019) was by mothers of infants in the first 12 months of life, from 1993 to 2018–2019. Human milk production has been growing in the second year of life, although it remains at low levels for this age group.

Fig. 1 Human milk production in Norway 1993–2019, litres per child 0–24 months Note: This differs from the annual per capita figures in Table 2 because this is the amount a Norwegian child receives during the lactation 0–24 months and is separated into the first and second year of life.
Discussion
We have shown how estimates of human milk production can be incorporated into national food surveillance systems, using the example of Norway. The estimated total milk production by Norwegian mothers rose from 1993 to 2018–2019 to around 10 million litres a year, showing the large scale of the contribution of breastfeeding for national food supply for infants and young children. A key innovation in this paper is the analysis estimating per capita human milk production, enabling comparison of trends and patterns of production within and across countries(Reference Smith37). The rise since 1993 in Norway shows the potential for substantially increased human milk production, particularly if enabling policies and programmes are in place. Analysis of Norwegian data illustrates the potential utility of additional metrics to assist cross-country and intertemporal comparisons and to help relate breastfeeding data to the food system and measures of economic output.
There is already a recognised need for better metrics of how food systems affect nutrition and health(38). Nevertheless, the continued invisibility of breastfeeding as a form of food production and human milk as a food for infants and young children is starkly illustrated in a proposed framework (the ‘Innocenti Framework’) for conceptualising how the food system shapes the diets of children and adolescents(Reference Raza, Fox and Morris39) and by a recently published framework for comprehensively monitoring transformative food system change(Reference Fanzo, Haddad and Schneider40). The latter calls attention to the need to monitor food systems globally to inform decisions and support accountability for better governance of food systems. Concerningly, both of these important frameworks failed to mention breastfeeding, despite its importance as the ‘first-food system’, or the importance of its adequate monitoring for policy decision-making and accountability for progress.
Structural determinants of breastfeeding need to be addressed by policy to make progress towards global and national nutrition targets(Reference Rollins, Bhandari and Hajeebhoy5). A pioneering 1994 Norwegian study of human milk in food supply statistics(Reference Oshaug and Botten18) emphasised that monitoring trends in human milk production helped make visible the importance of policy or programme measures to protect, promote and support breastfeeding. In Norway, monitoring the contribution of mothers’ milk to healthy, secure and sustainable food production is a continuing recognition of the importance of breastfeeding in public policy. Exclusion from economic statistics such as Gross Domestic Product(Reference Smith and Ingham41) has also been argued to result in incomplete and biased estimates of national food production and overall economic output, and slants policy priorities, to the disadvantage of women and children. The French Presidential Commission on the Measurement of Economic Performance and Social Progress (S-S-F Commission), led by Joseph Stiglitz and Amartya Sen, warned of serious bias and distortion of the economy away from what is most valuable if economic statistics failed to note shifts from home production to market production(Reference Stiglitz, Sen and Fitoussi42). They cited human milk as an example of the problem:
‘There is a serious omission in the valuation of home-produced goods—the value of breast milk. This is clearly within the System of National Accounts production boundary, is quantitatively non-trivial and also has important implications for public policy and child and maternal health.’
In contemporary perspective, including estimates of human milk in food production statistics not only highlights its value to countries as an economic resource, but also facilitates integrating global and national breastfeeding strategies and policies with current food systems thinking, dialogue and action, and adapting or strengthening such measures when the social and market environment changes. Evidence of a rapid transition towards milk formula consumption in middle-income countries in recent years(Reference Baker, Smith and Salmon12) along with indications of declining breastfeeding indicators in low-income countries and some regions emphasises there is an urgent need for better monitoring of trends as countries develop their market economy(Reference Neves, Vaz and Maia9). Rising incomes, urbanisation, the changing nature of woman’s work, social norms, media influences, medicalisation and globalisation of the baby food industry have been identified as key determinants of this global transition in diets of infants and young children towards commercial milk formula(Reference Baker, Santos and Neves1).
While the Norwegian estimates analysed in this study have official status, they sit alongside several academic studies since the early 1970’s which have estimated (national) volumes of milk produced by breastfeeding women in various countries. Estimates currently exist for twenty three different countries, dating back to 1908 for the Philippines(Reference Berg17). Studies conducted during the 1980’s and 1990’s in Indonesia and India demonstrated that this was a substantial national food resource(Reference Gupta and Khanna43,Reference Rohde44) . A study calculated human milk production in sub-Saharan African countries in 1997(Reference Hatloy and Oshaug45), and further studies of human milk supply at the national level have since been published for India(Reference Smith46) as well as for Bolivia(Reference Aguayo, Ross and Saunero47), Francophone west Africa(Reference Aguayo and Ross48) and China(Reference Ross, Chunming and Zhenying49), and four high-income countries (USA, UK, and Australia, and Norway)(Reference Smith37).
However, Norway’s estimates remain the only ones that provide a time series showing trends over time that are calculated on a consistent basis for the 0–24 months age group over more than two and a half decades. The annual per capita human milk production for infants and young children in Norway from 1993 to 2018–2019 was shown in this study to be in the range 69–91 l per child aged 0–24 months. This was higher than in other high-income countries for which estimates are available. Using the estimates from those studies, it can be calculated that annual per capita production was around 64 l per child in Australia in 1992(Reference Smith19), rising to 69 l by 2010 and comparing with 61 l in the USA in 2009 and 90 l in Norway in 2006–2007(Reference Smith37,Reference Smith50) . Per capita annual production of around 64–67 l in China(Reference Ross, Chunming and Zhenying49,Reference Smith50) during the period 2001 and 2008 is similar to the levels in the above high-income countries. In India, it rose from around 72 in 1992–93 to 84 l in 1998(Reference Gupta and Khanna43): more recent estimates are for production of around 137 l per child per year(Reference Smith46). Estimates for Bolivia in 2001 suggest around 110 l per child per year(Reference Aguayo, Ross and Saunero47) and comparably 100 l for The Philippines in 2008. Production has been much higher in many African countries, up to 150–170 l per child annually for breastfeeding of the 0–36 months age group(Reference Hatloy and Oshaug45,Reference Aguayo and Ross48) . The above illustrates that the per capita measure of human milk production can provide insights into trends over time and differences across countries in food security for infants and young children.
However, there is a need for a common methodology. In these studies, the estimated quantities of milk supplied by mothers varied across countries and within the same countries over time due in part to differences in study scope or method. This can make temporal or cross-country comparisons complex. For example, firstly, the academic studies of human milk production differed in the child age range included in the estimates, which for Norway was 0–24 months. Most studies covered this age range, but a small number covered early infancy only. By contrast, the scope of some estimates was birth to 36 months of age(Reference Rohde44,Reference Hatloy and Oshaug45,Reference Aguayo, Ross and Saunero47–Reference Ross, Chunming and Zhenying49) . Relatedly, studies also differ in how the number of infants and young children was measured. Most took the number of live births as a reasonable proxy to measure the number of infants and young children in the study and used births for the current year as indicating the number of children living in the second (or in some cases the third) year. Few adjusted for mortality. In Norway, the effect is not large because infant mortality is very low. However, if infant mortality is high, a possible difference between the number of live births and the population of infants and young children may need to be considered in any cross-country or intertemporal comparisons.
Secondly, survey methods on breastfeeding prevalence may also differ, including over time. Survey methods and sampling of data on any breastfeeding in Norway are similar in the national surveys from 1998–1999, 2006–2007, 2013 and 2018–2019, whereas, data for 1993 is from community health services in five of twenty counties(15,Reference Lande23–Reference Myhre, Andersen and Kristiansen31) . These surveys are broadly representative, but there is some under-representation of immigrants and mothers with lower education in the national surveys. The estimates for Norway use data on any breastfeeding at each month of age and do not distinguish exclusive breastfeeding from partial breastfeeding in the 0–6 months aged group. In 2018–2019, the proportion of exclusively breastfeeding infants in Norway was lower from 4 to 6 months of age than it was in 2006–2007, but the proportion of breastfeeding in the 13–24 month age group was higher than in 2006–2007. Estimates for most other countries likewise used data on any breastfeeding rates by month of age. However, calculations in some studies(Reference Aguayo, Ross and Saunero47,Reference Aguayo and Ross48) accounted specifically for the prevalence of exclusive breastfeeding.
Thirdly, studies used various assumptions about daily human milk intake per child, depending in part on the extent of exclusive breastfeeding for the 0–6 months population of infants. This highlights the need for common assumptions across estimates for countries and over time. In some studies, the assumed daily intake implied during a 0–24 month lactation period ranged from around 290(Reference Rohde44) to around 310(Reference Smith37,Reference Smith46,Reference Smith50) l. This aligns with the 306 l used for official estimates in Norway(16). However, many other studies assumed much higher daily breast milk intake, ranging from an overall intake of 331 l(Reference Oshaug and Botten18) to as high as 443 l(Reference Aguayo, Ross and Saunero47) for the 0–24 month age range(Reference Berg17,Reference Smith and Ingham41,Reference Hatloy and Oshaug45,Reference Almroth, Greiner and Latham51) . The Norwegian assumption that the first 6 months of breastfeeding provides around 130 l of milk is consistent with other studies (range is108 l(Reference Rohde44) to 155 l(Reference Berg17)). Also, the Norwegian assumption of 225 l for the 0–12-month period is comparable with the range cited in other studies of around 180–290 l(Reference Butte, Lopez-Azarcon and Graza33,Reference Rohde44) .
On the other hand, its assumption of milk intake of around 80 l for young children 13–24 months is conservative compared with other estimates (range from 106(Reference Oshaug and Botten18) to 201 l)(7,Reference Aguayo, Ross and Saunero47) . This is considerably lower than the lowest levels in other studies. Thus, Norway’s present estimates may understate production in the 13–24 month age group. There is a paucity of evidence on the intake for children beyond the first year. Findings for Indonesia(Reference Rohde44) and studies which calculated milk production for children up to 24–36 months(Reference Hatloy and Oshaug45,Reference Aguayo, Ross and Saunero47–Reference Ross, Chunming and Zhenying49) emphasise that declines in breastfeeding prevalence for children in the second year of life and beyond translate into a substantial loss at country level. Human milk production estimates for Norway in 2018–2019 could be 10–50 % higher (∼11–15 million litres a year) if the higher range of assumed milk intakes (331–443 l) for the 0–24 months age group in other studies of milk production was used. This shows the need for better evidence of milk intake including in traditionally breastfeeding populations.
Norway estimates the amount of actual human milk production in a given year, but several studies have also estimated countries’ quantity or monetary value of ‘lost milk’ compared with the potential from more optimal levels of breastfeeding(Reference Berg17,Reference Smith19,Reference Aguayo, Ross and Saunero47,Reference Aguayo and Ross48,Reference Smith50) . Tracking the extent of ‘lost milk’ using a consistent methodology and assumptions about yields and potentially feasible breastfeeding levels may be a second useful system level approach to measuring a deterioration in food security and nutrition for infants and young children. Lost milk was calculated in most such studies as the difference between the measured level of actual human milk production, compared with a measure of the biological production potential of the mothers. Using a 95% benchmark for breastfeeding rates to define the biologically feasible production level(Reference Smith and Ingham41), around 18 million litres of human milk would have been available for Norwegian children in 2006–2007, meaning that 40% of potential milk supply in Norway was ‘lost’(Reference Smith37). Recent rapid declines in breastfeeding during the COVID 19 pandemic(Reference Latorre, Martinelli and Guida52) reinforce that current levels of production of human milk cannot be taken for granted. Continued provisioning through this first food system needs to be supported so that it is not ‘lost’.
Our findings have implications for public policy, including monitoring and surveillance. The method used to estimate human milk production in Norway is applicable to other countries. It requires national data on breastfeeding and number of births. Regular and accurate data on breastfeeding practices for 2 years and beyond, with regular data collections and continuity of survey design and methodologies over time, is crucial(Reference Victora, Bahl and Barros4). Data deficiencies are particularly apparent in high-income countries(Reference Rollins, Bhandari and Hajeebhoy5). A recent review called for stronger investments in data for monitoring breastfeeding trends(Reference Vaz, Maia and Neves21).
This research highlights that there are now established concepts and evidence on the value of human milk that could be used more systematically and on a wider scale, such as by developing a tool for use in food surveillance, policy analysis and advocacy. While existing commercial data such as on per capita milk formula sales are used by industry to evaluate the size and potential market for these products, data on human milk production are more useful for policymakers evaluating food security and dietary quality of infants and young children.
The omission of human milk from relevant food statistics has an impact on policy decisions of relevance to the health of children and on the status of women, breastfeeding practices and nutrition and health policies.
Demonstrating the amount and significance of human milk production provides evidence supporting its inclusion in food statistics. As stated by Hatløy and Oshaug 25 years ago, central actors in the decision-making process, such as economists, statisticians and others, should be made aware of such facts on human milk production because of the important implications of the quantities produced. This alone justified the inclusion of human milk in food statistics. By not including the production of this nutritionally adequate and health-promoting food, attention to the economic asset would continue to be low. Furthermore, the omission might directly contribute to the decline of breastfeeding and continued discrimination against lactating women and their young children, with serious health consequences. Political support and financial investment are also needed to protect, promote and support breastfeeding(Reference Rollins, Minckas and Jehan11).
Conclusions
The milk produced by breastfeeding mothers is a recognised component of the food supply statistics in Norway. The experience of Norway and the findings of this study suggest the feasibility and utility of including human milk in food surveillance systems as an indicator of food security and dietary quality. The annual per capita figure of human milk production per child is of particular value, as this indicator creates a novel basis for evaluating trends within a country and for comparisons between countries. The proportion of potential supply that is ‘lost’ also indicates the potential for improvement against a defined benchmark of clear relevance to public health nutrition.
While the worth of breastfeeding is far greater than can be measured by the volume of milk provided, the availability of such data in food statistics is important for many reasons relevant to nutrition, health and economic policymakers(Reference Smith and Ingham41,Reference Hatloy and Oshaug45) . Conversely, the lack of reporting of human milk in food statistics has important strategic consequences, particularly where social changes are taking place(Reference Hatloy and Oshaug45).
The production of human milk by a nation’s mothers can be recognised not only as contributing to national food security and resilience, but also to achieving the Sustainable Developmental Goals. Current influential policy documents are calling for healthier and sustainable food systems. As breastfeeding is such a system, we recommend that food systems conceptual frameworks and surveillance systems should give recognition to human milk by including it as a category of food production. This would help raise awareness of this important national and global food resource among key stakeholders such as officials involved in food monitoring and surveillance systems and management and economic statisticians.
Acknowledgements
Financial support: This research did not receive any specific grant from funding agencies in the public, commercial or not-for-profit sectors. One author (JPS) holds an Australian Research Council Future Fellowship (FT140101260). No other external funding. Authorship: J.P.S.: Conceptualisation, Original draft preparation, Writing – reviewing and editing; A.B.: Data curation, Writing – Reviewing and Editing; B.L.: Data curation, Writing – Reviewing and Editing; L.J.: Writing – Reviewing and Editing; P.B.: Writing – Reviewing and Editing. Ethics of human subject participation: The research involved no human participants.
Conflict of interest:
The authors declare no conflicting interests.
Supplementary material
For supplementary material/s referred to in this article, please visit https://doi.org/10.1017/S1368980022001495


 Open access