


Introduction
Today, the most important life-limiting factor of advanced alloys for many high-temperature applications is their limited oxidation/corrosion resistance and not their mechanical degradation.
Essentially all potential metallic materials are unstable in high-temperature environments and the various oxidation processes are highly exothermic. The only reason it is possible to have materials that can be used at all is that the reaction product, the oxide, may form a protective layer on the component surface (Kofstad, Reference Kofstad1966).
Thus, the development of methods for surface protection against corrosion and oxidation of high-temperature materials has become an important area in modern material science. The basic principle is to raise, at the surface of an actual component, the amount of that element that forms a protective oxide scale. The oxidation resistance of such an enriched layer (often existing as a coating) is then dependent of its ability to maintain a continuous surface layer of the oxide, which serves as a diffusion barrier and reduces the rate of reaction between oxygen and the underlying metal. In the case of Ni-base superalloys, developed for various high-temperature applications (e.g., turbine blades for aircrafts), the most successful oxidation protection is obtained by the formation of an Al-enriched intermetallic outer layer. During high-temperature exposure in air this layer creates, a protective Al2O3-oxide layer, an alumina scale. Alumina is protective as it is dense, slow-growing, well-bonded to the metal and resistant against cracking and spallation (Young, Reference Young2016).
Diffusion along alumina grain boundaries (GBs) is recognized to be the rate-controlling transport mechanism that might be altered by the presence of alloying elements, but the exact mechanisms affecting diffusional fluxes still remain not entirely understood. One of the important issues is the fate of the base metal elements, most commonly Ni or Cr, in the oxide as solubility of these elements in alumina is quite low. Another is segregation of reactive elements (RE) Zr, Y, Hf, Ce, etc., from the alloy to the alumina GBs [often observed using analytical transmission electron microscopy (TEM)], that is known to influence growth of this oxide. However, the complex interplay between the oxide microstructure, ionic transport, and oxidation kinetics is still not completely understood to large extent due to the lack of atomic scale information (Pint, Reference Pint1996; Haynes et al., Reference Haynes, Pint, More, Zhang and Wright2002; Naumenko et al., Reference Naumenko, Pint and Quadakkers2016).
The latest development of laser-assisted atom probe tomography (APT) and new specimen preparation methods using focused ion beam (FIB) milling (Larson et al., Reference Larson, Alvis, Lawrence, Prosa, Ulfig, Reinhard, Clifton, Gerstl, Bunton, Lenz, Kelly and Stiller2008) opened the possibility for characterization of the thermally grown oxide scales with high sensitivity and nearly atomic spatial resolution. During the last decade, several successful APT investigations of oxides have been reported (Larson et al., Reference Larson, Alvis, Lawrence, Prosa, Ulfig, Reinhard, Clifton, Gerstl, Bunton, Lenz, Kelly and Stiller2008; Lozano-Perez et al., Reference Lozano-Perez, Yamada, Terachi, Schröder, English, Smith, Grovenor and Eyre2009; Marquis et al., Reference Marquis, Yahya, Larson, Miller and Todd2010; Hono et al., Reference Hono, Ohkubo, Chen, Kodzuka, Oh-ishi, Sepehri-Amin, Lia, Kinno, Tomiya and Kanitani2011; Chen et al., Reference Chen, Reed and Marquis2012; Stiller et al., Reference Stiller, Viskari, Sundell, Liu, Thuvander, Andrén, Larson, Prosa and Reinhard2012; Dong et al., Reference Dong, Motta and Marquis2013; Viskari et al., Reference Viskari, Hörnqvist, Moore, Cao and Stiller2013; Chen et al., Reference Chen, Reed and Marquis2014; Stiller et al., Reference Stiller, Thuvander, Povstugar, Choi and Andrén2016). However, APT analyses of thermally grown oxides are far from being routine and there are still many challenges to overcome.
This article concerns APT investigations of oxidation of three NiAlCr alloys with different additions of RE that are mimicking the most commonly used coatings for protection against oxidation at high temperatures in Ni-based superalloys (Goward, Reference Goward1998). The purpose of the work was dual: (1) to demonstrate feasibility of APT studies of grain and phase boundaries of the oxides; (2) to provide detailed information about the chemistry of the investigated interfaces in the studied alloys. Major focus was directed toward analysis of interfaces in the inner part of the oxide scales, i.e., below the outermost region formed during the initial oxidation. This part of the oxide is most important for the protection of the alloy against degradation. The work is a first step in a larger project, aimed at a better understanding of transport processes in alumina, here coupling between the amount of segregating dopants and the oxidation rate is of great interest.
Materials
Three different alloys with different amount of REs were selected. The compositions, as determined by inductively coupled plasma atomic emission spectroscopy, of the alloys are (in at%)
-
∙ YHf: Ni62.3Cr15.1Al22.5Y0.03Hf0.04C0.024
-
∙ YHfTi: Ni61.9Cr15.2Al22.6Y0.020Hf0.043Ti0.31C0.017
-
∙ YHfB: Ni60.6Cr16.8Al22.2Y0.015Hf0.037B0.33C0.028
The oxidation kinetics of these alloys in the dry air is very similar, but addition of Ti did reduce the depth of internal oxidation (Unocic & Pint, Reference Unocic and Pint2013). In the case of the B-doped alloy, better oxide adhesion was achieved (Unocic et al., Reference Unocic, Leonard and Pint2014). Still, the question was whether, and if so how, B and Ti are incorporated into the protective Al2O3-oxide layer.
In the following text, we will refer to the samples as YHf-, YHfTi-, and YHfB-sample.
Experimental Procedures
To achieve the formation of an oxide layer all samples were exposed isothermally in O2 for 100 h at 1,100°C. High-angle annular dark field scanning transmission electron microscopy (HAADF-STEM) and energy-dispersive X-ray spectroscopy were performed using a Phillips CM 200 (Phillips, Amsterdam, Netherlands) in Oak Ridge.
To prepare the needle shaped samples required for APT studies, a FEI VERSA 3D FIB milling station (FEI, Hillsboro, OR, USA) was utilized. APT needles containing two different oxide regions, the outermost part close to the surface and the inner oxide, were prepared with the FIB standard method (Larson et al., Reference Larson, Prosa, Ulfig, Geiser and Kelly2013). To produce APT specimens containing near-surface oxide, a magnetron sputtered Au-coating was applied. The samples were then coated with a 1 µm thick, 1 µm wide, and 15 µm long strip of Pt. After this, the sample was cut free with the ion beam and attached to an omniprobe needle. As the GBs inside the protective alumina are not visible during the preparation, the omniprobe was, rotated by 180°. Because the sample is connected to the omniprobe at an angle of 30°–50°, the procedure results in a lift-out sample produced roughly perpendicular to the surface. Subsequently, the sample was attached by Pt-deposition to a Cameca microtip flattop tip (Cameca, Madison, WI, USA) and a 1 µm thick part was cut off with the ion beam. Before the annular milling a Pt cylinder was deposited on the attached piece on top of the desired interface. By selecting this orientation, the chance of hitting a GB in the elongated samples (Fig. 1) is increased by a factor of 2. However, the final APT specimens using this procedure usually contained more Ga contamination than one prepared using the standard method. Thus, for the preparation of the outer oxide the sample pieces were attached without rotation of the omniprobe.
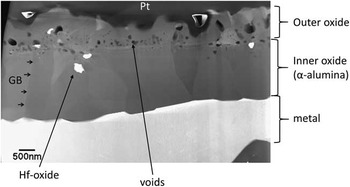
Figure 1 High-angle annular dark field scanning transmission electron microscopy of the YHfTi sample. Large grains of α-alumina form a protective inner oxide layer on top of the metal. These grains are elongated perpendicularly to the metal-oxide interface. Between them and the Pt-cover (from the preparation), the outer oxide layer, with smaller grains of alumina spinels (brighter) and the very bright HfO2, is observed. Dark appearing voids are found between these two regions. GBs, grain boundaries.
Analysis of the oxides with APT proved to be difficult both in terms of success rate (in our case <25%) and in terms of choice of suitable analysis parameters. Thus, the measurement parameters were studied to obtain a suitable compromise. Two different atom probes, the LEAP 3000HR (Cameca, Madison, WI, USA) at Chalmers with a green laser and the LEAP 4000HR (Cameca, Madison, WI, USA) in Karlsruhe with a UV-laser were used for the APT analyses. Generally, the LEAP 4000HR mass spectra were less complex and the peaks had smaller thermal tails (Fig. 2). In addition, the success rate of the measurements using LEAP 4000HR appeared to be higher by a factor of at least 2.
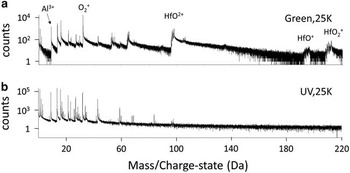
Figure 2 Mass spectra of (a) the LEAP 3000 with green and (b) the LEAP 4000 with ultraviolet (UV) laser. Typically, the thermal tails are smaller in the LEAP 4000 measurements.
To reduce possible surface migration of mobile elements like B or C, and also to reduce differences in evaporation at phase boundaries, the measurements were performed at 25 K even though higher temperatures give alumina compositions closer to the stoichiometric value. The laser pulse energy was typically 200 pJ for the LEAP 3000 and 20 pJ for the LEAP 4000. The laser of the LEAP 4000 has a smaller focal point, which allows lower pulse energies. Pulse frequencies between 100 and 250 kHz were used depending on the applied voltage to avoid a mass cutoff below 300 Da. For the APT reconstructions with IVAS 3.6.12 we used SEM images, if possible. Otherwise the reconstruction was based on the reconstruction parameters (evaporation field of 25.6 V/nm, image compression factor of 1.65, k-factor of 3.3) obtained for a reference measurement of pure alumina at 25 K with 20 pJ in the LEAP 4000, in which plane distances could be identified by using cross-correlated spatial distribution maps (SDM) (Boll et al., Reference Boll, Zhu, Al-Kassab and Schwingenschlögl2012), which the paper refers to as AtomVicinity (Boll et al., Reference Boll, Al-Kassab, Yuan and Liu2007), an algorithm almost identical to SDM (Geiser et al., Reference Geiser, Kelly, Larson, Schneir and Roberts2007).
Results
Figure 1 is a STEM-HAADF micrograph showing the oxide structure typical for all the investigated samples. It consists of α-alumina grains that form a protective layer on top of the bright imaging metal. The grains are elongated in their growth direction, i.e., perpendicular to the metal surface. They are typically about 2 µm high and 1 µm wide. On top of this region, a more finely grained region with equiaxed oxide is visible. This part of the scale originates from the oxide formed during initial oxidation and has been transformed during subsequent exposure. It consists of a mixture of alumina and spinel grains. The region also contains dark imaging voids and bright imaging small precipitates of heavy metal (Y or Hf) oxides.
Acquisition of APT data from the oxidized samples proved to be difficult. Although α-alumina itself runs quite well and measurements with several 100 millions of collected atoms were easily attainable, the successes rate of analysis of the specimens containing oxide phase or GBs was below 25% due to the early specimen fracture. Furthermore, it appeared that premature fractures of the specimens containing the outermost part of the oxide were more frequent than for the specimens containing the inner parts. This was most probably due to the presence of voids at this part of the oxide (see Fig. 1). On the other hand, it was more difficult to prepare samples containing oxide GBs in the inner part of the oxide as the oxide grain size is larger there.
Initially analyses were performed at 60 K, which gave a composition of α-alumina much closer to the stoichiometric value than the 25 K runs. However, as the lower temperature reduces the differences in evaporation fields, the local magnification effect and possible surface migration of elements like B or C, the majority of experiments was performed at 25 K.
APT Mass Spectra
The APT mass spectra collected with the LEAP 4000 are typically easier to interpret, showing smaller peak tails (Fig. 2). Concerning Hf-molecules, the spectrum is also much simpler. However, usually more hydrides were observed in the measurements, which counteracted this positive effect to some extent. The higher number of peaks leads to a situation where more tails overlap. This makes it effectively more complicated to give an exact value for the Cr and Ni concentration by deconvolution of the peaks. We decided to give these values of the oxide matrix composition as an upper limit as it is known that the solubility of alloying elements in α-alumina is extremely low (Kofstad, Reference Kofstad1966).
Generally, nonmolecular Hf is rarely detected, instead it usually field evaporates as molecular HfO+/2+/3+ ions and to some extent as more complex oxide molecules like HfO2 or Hf2O. This results in overlaps with Pt for 3 out of 4 of the significant isotopes, especially for the 2+ state at 97, 97.5, and 98 Da. This is problematic only when plotting the Hf signal close to the protective Pt cap deposited during specimen preparation by FIB. Y has only one significant isotope, for Y2+ a peak is found at 44.5 Da that unfortunately is located in the thermal tail of AlO, which induces a high noise level in the corresponding atom maps. The only other significant peak found is YO2+ at 54.5 Da. Nonmolecular B can be easily identified, but most of the more complex ions show overlaps. A possible BO+ main peak overlaps with Al at 27 Da, BO2 + would overlap likewise with AlO at 43 Da. There are also overlaps of the second highest BO+ peak at 26 Da with Cr. As there was no peak for mono-atomic B present, we think it is unlikely that these overlaps are relevant. Ti and its oxides have a typical pattern of five isotopes, which would be easy to recognize, if present. The possible presence of an extremely small number of atoms that do not show up as a peak in the mass spectrum, was considered by looking at the distribution of the atoms at the peak positions. No indication of enrichment in GBs or phase boundaries was found for B or Ti.
The Outermost Part of the Oxide Scale (YHf-Sample)
For the reasons described above, the outer oxide’s surface was successfully analyzed only in a YHf-sample (Fig. 3) below the protective Au-capping deposited on the sample surface. The local magnification effects, expected from the high evaporation field of Au, were successfully reduced using 25 K during analyses.
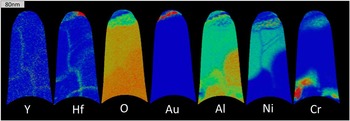
Figure 3 Atom probe tomography of a YHf-sample, prepared at the outermost part of the oxide. In the heat maps red indicates a high, and blue a low concentration. A protective Au-coating is still present on top of the oxide. The Hf at the top is incorrectly assigned Pt. Ni-spinel can be identified by observing the Ni concentration. One can see enrichment of Y and Hf at most oxide grain boundaries (GBs) and phase boundaries (PBs). In the spinel-GBs Al is enriched.
APT revealed many more features compared to STEM analysis such as small, <5 nm in diameter, Ni-rich grains observed at the very topmost oxide layer, i.e., below the Au-cap (Figs. 4b–4d). The grains were only found on a small fraction of the surface, accounting for about 30% of the area of the APT measurement when viewed from the top. They were surrounded by a Ni-rich spinel containing aluminum. Some enrichment of C and maybe Cr could be found in or around some of these particles (Fig. 4d). Using the isosurface of 32 at% Ni as the boundary of the particles their average composition is Ni48.8Al17.0Cr1.4C1.1Hf0.3O31.3. The compositions are also given in Table 1. The area around this region 1 in Figure 4 has a composition of Ni16.6Al32.3Cr0.8C0.3Hf0.2O49.8. Below region 1, one finds in region 2 a composition of Ni17.2Al30.7Cr0.3Y0.1Hf0.1O51.6. There are two kinds of GBs between different grains with this composition. One, going vertically, is heavily enriched in Hf, Y, and Al, with Gibbsian excesses of ΓHf=1.6 nm−2, ΓCr=1.5 nm−2, ΓY=0.1 nm−2, ΓAl=1.3 nm−2, and ΓO=2.8 nm−2 (Table 2). Two other GBs, which are oriented at an angle of 60° to the vertical one, are parallel to each other and seem to contain less Hf , almost no Y, but do contain Al. Below this spinel region, small aluminum rich grains with Ni0.1Al42.6Cr1.0O56.3 are present in area 3a, but also Cr-enriched areas with Ni0.7Al34.7Cr9.3O55.0 are present in region 3b. A closer look at this region is presented in Figure 4e, where an isosurface for Cr >7 at% is plotted. This shows that this Cr-enriched region indeed is not homogeneous, but contains several precipitates. In Figure 4f the proxigram for the marked precipitate is given. The oxygen content is the same as in the matrix, but the Al-content is lower. No enrichment of other elements was found.
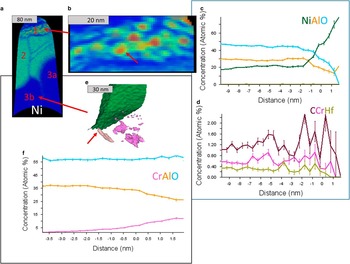
Figure 4 a: Several regions identified in the Ni-rich part of the YHf-sample presented in Figure 3. b: Magnification of the upper region containing Ni-rich particles. c: A proxigram of the major elements through the 32 at% Ni isosurface of the marked (red arrow) particle. Note the low O-concentration in the particle core. d: Same as for (c) but for the minor elements. Carbon is enriched in the particle in comparison with the surrounding material. Cr and Hf are depleted in the particle core. e: A closer look at region 3b with a green isosurface for Ni >10 at% and the pink isosurface for Cr >7 at%. f: The proxigram of the marked [arrow in (e)] Cr particle reveals that the precipitate follows the M2O3 composition.
Table 1 Measured Compositions of Oxides.
Table 2 Gibbsian Excess Values Measured at Grain Boundaries.
The Inner Oxide (YHfB, YHfTi, and YHf Samples)
In this part of the oxide, the alumina GBs are relatively sparsely distributed so that in several APT analyses the GB was missed (despite site-specific sample preparation). These measurements could be up to several 100 nm long and the average composition of the oxide obtained using specimen temperature of 25 K was Ni<0.1Al43.6Cr<0.2O55.9.
In YHfB samples no GB between the alumina grains was successfully investigated and no B-signal was found in the oxide mass spectra. Instead Hf-rich oxide particles have been encountered (Fig. 5). The composition of the particles is Hf32.4Y0.2Zr1.0O66.4, i.e., very close to the stoichiometric value of HfO2. The presence of Zr in the particles is not expected from the nominal composition of the alloy. Furthermore, a Y-enriched area is visible at the interface to the alumina (Al37.8O62.2). This enrichment appears rather as a Y-enriched part of the HfO2 grain than as a mono-atomic layer GB segregation. No enrichment of Ni, Cr, or B at the interface was found. In addition, YHfB samples containing only oxide matrix without any interfaces were analyzed. In these measurements the composition of alumina was Ni<0.1Al41.7Cr<0.2O58.0 (see Table 1).
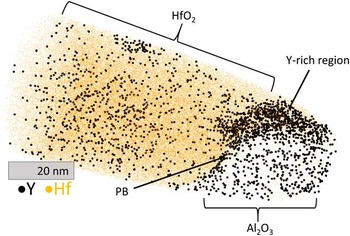
Figure 5 Atom probe tomography of a YHfB-sample in the inner oxide. The interface between a Hf2O and a Al2O3 grain is presented. Y-rich region (indicating possible precipitate) attached to the phase boundary (PB) with segregated Y is visible. Yttrium signal in the oxide grains originates from noise.
Figure 6 represents the heat map of the inner alumina region (but still close to the outer oxide) in a YHfTi sample. GBs between three different alumina grains (1, 2, and 3) are present in the analyzed volume and segregation of Hf, Ni, and Cr is apparent. However, no Ti was found at this interface. The Gibbsian excesses of the GB between grain 1 and 3 were calculated as ΓHf=1 nm−2, ΓCr=6.3 nm−2, ΓY=0.1 nm−2. Apparently the Y, which is not easily visible in Figure 6, is present, but Ni is not enriched in this part. However, the presented Gibbsian excesses have to be interpreted with caution as a Cr- and Ni-enriched region is nearby. Furthermore, the Cr content is so high that this region could be considered a precipitate. An analysis of the Gibbsian excesses of the other GBs was not possible as they are too close to each other and the analyzed GBs too small.
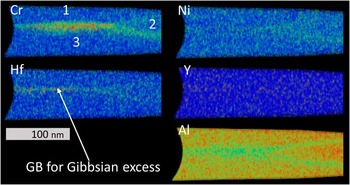
Figure 6 Atom probe tomography of a YHfTi sample below the spinel-rich region. At the alumina grain boundaries between the three grains 1, 2, and 3, an enrichment of Hf, Ni, and Cr is obvious. The enrichment of Y is barely visible due to the high noise level.
In Figure 7, a GB region between the α-alumina grains far away from other interfaces is analyzed for YHf. The concentration profile through the GB reveals the presence of several elements at the interface. The concentrations of other elements but Al and O in the matrix is 0 within the margin of error. To improve the visibility of the peaks, the profiles are shifted along the y axis. Again, the Gibbsian excess was calculated as ΓHf=1.5 nm−2, ΓCr=1.4 nm−2, ΓY=0.64 nm−2 and ΓNi=0.07 nm−2.
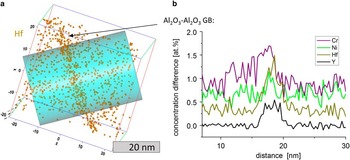
Figure 7 a: Atom probe tomography of alumina grain boundary (GB) in an YHf-sample. b: Concentration profiles of Y, Hf, Cr, and Ni through the GB. To visually separate the lines from each other all profiles except for Y are shifted upward. An enrichment of Y, Hf, Cr, and Ni at the GBs is visible. The concentration of all the elements outside the GB is equal to 0.
DISCUSSION
Determination of the Oxygen Content by APT
The observed deficit of O in the APT analysis of oxides is an issue discussed within the atom probe community as analyses of ceramics using APT have become possible. Until quite recently the reasons behind the missing oxygen ions were not well understood. However, it seems that there does exist a good explanation for the observed nonstoichiometry of many oxides at present. It is proposed, with the support from density functional theory simulations for MgO, that the evaporation of oxygen as neutrals is the underlying reason for the observations (Karahka & Kreuzer, Reference Karahka and Kreuzer2013). The basic idea is that field evaporated O+ ions can recombine with oxygen at the surface and are then released as a neutral O2-molecules, thereby being undetected. As a consequence, one may expect difficulties to differentiate between spinels, NiO, and alumina based on O content. However, it is still possible to identify the oxides based on their metallic content.
Oxide Formation
The results from APT analyses are in a good agreement with STEM investigations showing the occurrence of two different layers in the oxide scale, namely, the protective large oxide grains in the innermost part of the scale and an area with smaller equiaxed grains on the top (Fig. 1). However, APT allows for more detailed analyses with respect to the chemistry of the layers. Thus, it is possible to identify not only the Ni-rich spinel enriched in Cr (about 1 at% Cr) close to the surface, but also small precipitates with diameters of about 5 nm embedded in this spinel (see Fig. 3). Below this region another Ni-spinel, with practically no Cr and higher amount of Ni, is found. Identifying these two phases as Al2−x Ni1+x O4 spinels is very reasonable, considering that some O is lost in the APT measurement and that Al can be replaced by Cr in the oxide. The region containing spinels is followed by an alumina layer containing areas with an average of 9 at% Cr and <1 at% Ni.
The above-mentioned findings can be explained by the oxidation process. At the very beginning, a rapid oxidation takes place on the metal surface. This process favors not only the formation of Ni-rich spinel, but also simultaneous nucleation of various other Cr-, Ni-, and Al-oxides. After the first oxide layer is formed, the oxidation process slows down and the ability of Al and Cr to form oxides becomes higher than for Ni and thereby an Al- and Cr-rich oxide layer is formed below the Ni-rich layer. When a sufficiently thick oxide scale has been formed, the oxygen partial pressure (pO2) at the metal/oxide interface is so low that it prevents the oxidation of elements other than Al. This results in a purer alumina oxide (α-alumina) in the innermost part of the scale, explaining why the Cr-enriched alumina is found in the outer scale region.
The Ni-rich spinel is thought to be mostly outward growing, i.e., it grows by outward diffusion of metal cations, whereas alumina is an inward growing oxide (grows by inward diffusion of oxygen through the oxide GBs), which explains the formation of the line of voids visible in the STEM images (Fig. 1) between these two oxide regions.
Existence of the nanosized precipitates embedded in Ni-rich spinel situated close to the oxide surface is somewhat puzzling. This feature was observed occasionally, and only in a limited region of the investigated sample. It is clear that the precipitates must have been produced during the later stage of oxidation as if they would have been created during the initial oxidation when Ni-spinels start to form, they would be situated close to the line of voids. One possible explanation would be that the precipitates were created as a result of healing of a micro crack in the mature scale when the bare metal was exposed to oxygen. The APT specimen could have been by chance produced so that it touches on the healed region. Further investigations are needed to reach better understanding in this matter.
Segregation to GBs and Phase Boundaries
Only inner parts of oxide scales formed on boron-rich YHfB and Ti-containing YHfTi materials were successfully analyzed by APT. No segregation of B or Ti to any of the analyzed interfaces and no precipitates rich in these elements were observed. This is consistent with previous TEM investigations (Unocic & Pint, Reference Unocic and Pint2013; Unocic et al., Reference Unocic, Leonard and Pint2014), in which it is proved that the addition of B to the Ni–Cr–Al alloy does not affect the alumina scale microstructure and that there is no Ti segregation to alumina GBs in the oxide part close to the metal. Instead, TEM analyses of Ti-containing Ni-based alloys often reveal existence of Ti-rich oxide grains on the scale surface.
Contrary to boron and titanium, yttrium and hafnium both segregate to GBs between spinel grains and alumina grains and also to boundaries between different oxide phases (see Table 3). Furthermore, segregation of Ni and Cr is found at α-alumina GBs close to the surface and within the protective alumina oxide. Segregation of Y and Hf was previously reported in TEM studies (Unocic & Pint, Reference Unocic and Pint2013), but segregation of Ni (Fig. 7) is a new finding, indicating that there should be some growth of the outermost spinel part due to the transport of Ni even when the innermost alumina part of the scale is well developed. This statement is also supported by the observation of segregation of Cr and Al to the Ni-spinel GBs.
Table 3 Segregation of the Different Alloying Elements to the Interfaces.
Y, Yes; N, No.
Comparison of the Gibbsian excess between GBs in the Ni-spinel and the α-alumina parts is noteworthy. It reveals that Hf and Cr populate both types of GBs to the same extent suggesting that the driving force for their segregation is the same along a net of GBs from the surface to the metal (Table 2). Y shows different values for different GBs leading to believe that its segregation may depend on local availability of this element.
Conclusions
We studied oxidation at 1,100°C of three model NiAlCr alloys with different additions of Hf, Y, Ti, and B using APT. The investigation proves the applicability of APT to oxidation issues. The efforts were directed toward analysis of the innermost part of the oxide scale being most responsible for the good resistance to the alloy degradation by oxidation. The segregation of Y and Hf to the grain- and phase-boundaries was observed confirming the importance of these elements on the oxidation kinetics of the alloys. Ti or B were found neither in the oxide matrix nor in any of the investigated interfaces. It is therefore suggested that these elements do not alter the inward diffusion of oxygen through the scale into the metal.
Noteworthy findings are the Al enrichment at GBs of Ni-spinel and Ni enrichment at alumina GBs, which can be an indication for a small amount of outward diffusion of these elements through the GBs. A complete list of all segregations can be found in Table 3. The formation of the Ni-rich precipitates close to the surface is surprising and a complete explanation of this finding has yet to be developed. Nevertheless, the general structure of the oxide scale, especially close to the interface with the air, could be explained as resulting from a shift of rapid oxidation at the beginning to diffusion of metal ions and O ions during the formation of the Ni-spinel and of another shift to predominant inward O-diffusion during the formation of the α-alumina layer.
Acknowledgments
This work is financed by Swedish Energy Agency. Julia Wagner from KNMF at Karlsruhe Institute of Technology is thanked for providing access to the LEAP 4000.


