


Low birth weight is associated with increased risk of cardiovascular disease and type 2 diabetes later in life (Reference Barker, Osmond and ForsenBarker et al, 2005). Likewise, low birth weight has been found to be associated with self-reported depressive symptoms and clinical diagnosis of depression at varying ages (Reference Thompson, Syddall and RodinThompson et al, 2001; Reference Cheung, Khoo and KarlbergCheung et al, 2002; Reference Gale and MartynGale & Martyn, 2004; Reference Patton, Coffey and CarlinPatton et al, 2004). These findings are in agreement with the developmental origins of health and disease hypothesis, which proposes that adverse experiences during critical periods of foetal development can permanently alter or programme the structure and function of the cells and organs, and consequently the function of the organism.
However, challenging any programming effects on depression, a recent study found no association between birth weight and psychiatric ward admission for depression in adult men (Reference Osler, Nordentoft and AndersenOsler et al, 2005). Moreover, the earlier studies gave mixed results in relation to gender (Reference Thompson, Syddall and RodinThompson et al, 2001; Reference Cheung, Khoo and KarlbergCheung et al, 2002; Reference Gale and MartynGale & Martyn, 2004; Reference Patton, Coffey and CarlinPatton et al, 2004). One possible explanation for the discrepancy is that, apart from studies using clinical diagnosis or hospital admission (Reference Patton, Coffey and CarlinPatton et al, 2004; Reference Osler, Nordentoft and AndersenOsler et al, 2005), depressive symptoms have been measured using standardised tools in only one study (Reference Thompson, Syddall and RodinThompson et al, 2001). Finally, it is well known that low birth weight reflects not only foetal growth but also length of gestation, yet gestational length has rarely been a focus in the previous studies – either this information has not been available (Reference Thompson, Syddall and RodinThompson et al, 2001; Reference Osler, Nordentoft and AndersenOsler et al, 2005) or it has been available but assigned the status of a covariable (Reference Cheung, Khoo and KarlbergCheung et al, 2002; Reference Gale and MartynGale & Martyn, 2004). Interestingly, however, recent studies have revealed that independent of birth weight, shorter gestational length predicts increased risk of stroke, cerebrovascular disease and high blood pressure (Reference Järvelin, Sovio and KingJärvelin et al, 2004; Reference Koupil, Leon and LithellKoupil et al 2005; Reference Lawlor, Ronalds and ClarkLawlor et al, 2005). This suggests that body size at birth and gestational length may both have unique predictive power and reflect foetal growth-related processes that are under different physiological controls. Thus, we tested whether smaller body size at birth and shorter length of gestation predict, independently of each other, depressive symptoms rated using the Beck Depression Inventory (BDI; Reference Beck, Steer and GarbinBeck et al, 1988) and the Center for Epidemiological Studies Depression scale (CES–D; Reference RadloffRadloff, 1977) on two separate occasions at ages 61.5 years (BDI) and 63.4 years (BDI and CES–D) among men and women born between 1934 and 1944 at term in Helsinki.
METHOD
The study cohort consisted of men and women born at Helsinki University Central Hospital during the decade 1934–1944. We identified 4630 men and 4130 women who had birth and child welfare records and were living in Finland in 1971 (when a unique personal identification number was allocated to each member of the Finnish population). The population has been described in detail elsewhere (Reference Barker, Osmond and ForsenBarker et al, 2005).
At a mean age of 61.5 years (s.d.=2.9, range 56.7–69.8) – time 1 – a subset of 2690 (1413 women and 1277 men) were invited to participate in the clinical examination. They were selected from the initial study population using random number tables, as described by Barker et al (Reference Barker, Osmond and Forsen2005). Of this subset, 1075 women and 928 men participated. Fourteen of the non-participants had died, others declined or could not be reached. The participants were more frequently women than the non-participants (P=0.04), reflecting our initial random selection of 200 women to undergo screening for osteoporosis, and subsequent random selection of both genders. After adjusting for the gender difference, participants and non-participants did not differ significantly from each other in body size at birth (weight, length, head circumference), length of gestation, maternal characteristics (height, weight in late pregnancy) or social class at birth based on father's occupation (all P>0.07), except that the participants had higher ponderal index (kg/m3) at birth (P=0.05) and their mothers were older (P=0.01) and had a higher body mass index (kg/m2) in late pregnancy (P=0.04) (data not shown).
At a mean average age of 63.4 years (s.d.=2.9, range=59.7–70.7) – time 2 (mean interval between time 1 and time 2 1.9 years, s.d.=0.7, range 0.4–3.3) – a psychological survey was sent by post to the members of the randomly selected sample who were still traceable (n=1975). Of this group, 1704 participants (951 women and 753 men) returned the survey. Of the 1664 participants having complete data available on depressive symptoms at time 1 and time 2, 1371 (752 women and 619 men) were born at term (259–294 days’ gestation). They formed the sample of the current study: they were more likely to be women (P=0.0001), and, even after adjusting for the gender difference, they were taller as adults (P=0.005) and less depressed (P<0.002) when compared with the rest of the randomly selected subset of the randomly selected participants at time 1 born at term (data not shown). These groups did not differ from each other in body size at birth, length of gestation, in maternal characteristics (age, height, weight, body mass index in late pregnancy) or in social class at birth based on father's occupation, or in age, weight, body mass index or level of education at time 1 (all P>0.20) (data not shown). The ethics committee of the National Public Health Institute approved this project, and all participants gave written informed consent.
Measures
The BDI (Reference Beck, Steer and GarbinBeck et al, 1988) and the CES–D (Reference RadloffRadloff, 1977) were used to measure the severity and frequency of depressive symptoms. These measures are the two most frequently used and well-validated self-report screening tools for depressive symptoms. The BDI consists of 21 items assessing symptoms of depression during the previous 2 weeks. Each item contains four statements reflecting varying degrees of symptom severity. Respondents are instructed to circle the number (0–3) that corresponds with the statement that best describes them; higher scores indicate increasing severity. Ratings are summed to calculate a total BDI score, which can range from 0 to 63. The CES–D consists of 20 items assessing the frequency of depressive symptoms during the preceding week. Each item is rated on a four-point scale ranging from 0 (not at all/less than a day) to 3 (all the time/5–7 days a week). Ratings are summed to calculate a total CES–D score, which can range from 0 to 60. Although the BDI and the CES–D are designed to screen but not diagnose major depression, BDI cut-off scores of 10, 19 and 30 or more are indicative of mild to moderate, moderate to severe and severe depressive symptoms respectively, and a CES–D cut-off score of 16 or more suggests more frequent experience of depressive symptoms. The internal reliability coefficients (Cronbach's α) of the BDI and the CES–D ranged from 0.81 to 0.91. The BDI scores measured at time 1 and time 2 (r=0.79, P<0.001) and the BDI and the CES–D scores measured at time 2 (r=0.64, P<0.001) were significantly associated.
Data on the newborn's date of birth, weight (g), length (cm) and head circumference (cm), and the mother's height (cm) and weight (kg) in late pregnancy, age and the date of the last menstrual period, as well as social class (lower, lower middle, upper middle, middle) based on father's occupation, were extracted from birth records. Adult height (cm) and weight (kg) as well as level of education (elementary school, vocational school, senior high school, college/university degree) were measured in conjunction with the clinical examination at time 1. Body mass index (BMI) was calculated in kg/m2.
Statistical analyses
We used multiple linear regression analyses to assess the relation of body size at birth and length of gestation with depressive symptoms. Because depressive symptoms measured by the BDI at time 1 and time 2 were significantly associated, and the mean level of the scores did not show significant change over time (F(1,1369)=1.36, P=0.24 in repeated-measures analysis of covariance adjusting for gender), the BDI scores were averaged across time 1 and time 2 for the analyses. We adjusted for gender and length of gestation in the analyses of body size, and for gender and birth weight in the analyses of duration of gestation (r=0.30, 0.29 and 0.28 between duration of gestation and weight, length and head circumference at birth respectively; all P<0.001). We repeated the analyses after further adjusting for other factors potentially confounding the associations, i.e. social class at birth, adult level of education, age at the time of measuring depressive symptoms and adult BMI.
Despite the significant rank order and mean level stability of the BDI scores from time 1 to time 2, and concurrent consistency of the BDI and the CES–D scores at time 2, these were not in perfect agreement. Therefore, by using logistic regressions we assessed the effect of body size at birth and length of gestation on dichotomised variables describing the consistency of depressive symptoms across time (BDI scores at time 1 and time 2) and across measures (BDI and CES–D scores at time 2). By using the widely accepted cut-off points of 10 or above for the BDI (indicating at least mild symptom severity; Reference Beck, Steer and GarbinBeck et al, 1988) and 16 or above for the CES–D (indicating more frequent experience of depressive symptoms; Reference RadloffRadloff, 1977), we compared first participants who had BDI scores of 10 or above at both time 1 and time 2 with participants whose BDI scores were below 10 on both occasions, and second, participants whose BDI and CES–D scores were both at or above the cut-off points at time 2 with those who scored below these cut-off points on the two measures. The logistic regressions were adjusted for the same variables as the linear regressions described above.
We used body size at birth (weight in kg, and length and head circumference in cm) and length of gestation (days) in the analyses as continuous measures. However, because there are data suggesting that individuals born weighing 2.5 kg or less are particularly susceptible to later physical adversities and depressive symptoms (e.g. Reference Gale and MartynGale & Martyn, 2004), we tested in additional analyses, whether those born weighing 2.5 kg or less differed from those weighing more than 2.5 kg in depressive symptomatology. The BDI and the CES–D scores were log-transformed (log+1) to normalise the skewed distributions. However, to facilitate interpretation, exponential function was used to reconvert the coefficients. We also tested whether any of these associations varied for men and women by including interaction terms in the models. In no instance was there a significant gender interaction term (P>0.15) (data not shown). For this reason we report the results in both genders combined.
RESULTS
Table 1 presents the characteristics of the sample categorised by gender. Compared with the women, the men were heavier, taller and had a greater head circumference at birth. The women scored higher on depressive symptoms and more frequently belonged to the groups exhibiting increased depressive symptoms. Analyses testing the effect of the other confounders on depressive symptoms showed that, after adjusting for gender, scores of depressive symptoms were higher among those who were older (BDI, P=0.001; CES–D, P=0.06), had lower levels of education in adulthood (P<0.008) and had greater BMI in adulthood (P<0.004). Depressive symptoms scores were not affected by social class at birth (P>0.08) (data not shown).
Table 1 Characteristics of the sample

| Men (n=619) | Women (n=752) | t | χ2 | P | |||
|---|---|---|---|---|---|---|---|
| At birth | |||||||
| Gestation, days: mean (s.d.) | 278.4 | (8.4) | 279.1 | (8.3) | -1.4 | <0.15 | |
| Weight, kg: mean (s.d.) | 3.5 | (0.5) | 3.4 | (0.4) | 5.5 | <0.001 | |
| Length, cm: mean (s.d.)1 | 50.8 | (1.9) | 50.1 | (1.7) | 7.2 | <0.001 | |
| Head circumference, cm: mean (s.d.)2 | 35.5 | (1.4) | 34.9 | (1.4) | 8.8 | <0.001 | |
| Adult at time 1 | |||||||
| Age, years: mean (s.d.) | 61.5 | (2.8) | 61.6 | (3.1) | -0.3 | <0.77 | |
| BDI score: mean (s.d.) | 4.7 | (4.4) | 6.5 | (5.6) | -6.3 | <0.001 | |
| Symptom severity, n (%) | |||||||
| None (<10) | 541 | (87.4) | 574 | (76.3) | 28.3 | <0.001 | |
| Mild (10-18) | 69 | (11.1) | 150 | (19.9) | |||
| Moderate (19-29) | 7 | (1.1) | 24 | (3.2) | |||
| Severe (≥30) | 2 | (0.3) | 4 | (0.5) | |||
| Adult at time 2 | |||||||
| Age, years: mean (s.d.) | 63.3 | (2.7) | 63.5 | (3.0) | -1.75 | <0.09 | |
| BDI score: mean (s.d.) | 4.6 | (5.4) | 6.7 | (6.5) | -7.7 | <0.001 | |
| Symptom severity, n (%) | |||||||
| None (<10) | 530 | (85.6) | 566 | (75.3) | 24.0 | <0.001 | |
| Mild (10-18) | 66 | (10.7) | 143 | (19.0) | |||
| Moderate (19-29) | 21 | (3.4) | 35 | (4.7) | |||
| Severe (≥30) | 2 | (0.3) | 8 | (1.1) | |||
| CES—D score: mean (s.d.) | 8.2 | (7.6) | 10.2 | (8.6) | -4.5 | <0.001 | |
| Symptom frequency, n (%) | |||||||
| None (<16) | 531 | (85.8) | 599 | (79.7) | 8.8 | <0.003 | |
| More frequent (≥16) | 88 | (14.2) | 153 | (20.3) | |||
Length of gestation and depressive symptoms
Table 2 shows that, after adjusting for gender and birth weight, depressive symptom scores increased by 0.8–0.9% per day decrease in length of gestation. Adjusting further for the other confounders (social class at birth, educational attainment, age at the time of testing, adult BMI) did not alter the magnitude of these associations (Table 2).
Table 2 Percentage change in depressive symptom scores according to unit change in length of gestation and body size at birth
| BDI1 | CES—D2 | |||
|---|---|---|---|---|
| Characteristic at birth as a continuous variable | B (95% CI) | P | B (95% CI) | P |
| Length of gestation, days | ||||
| Adjusted for gender | -0.9 (-1.4 to -0.4) | 0.001 | -0.7 (-1.3 to -0.2) | 0.007 |
| Adjusted for gender and birth weight | -0.9 (-1.4 to -0.4) | 0.001 | -0.8 (-1.3 to -0.2) | 0.009 |
| Fully adjusted3 | -0.9 (-1.4 to -0.4) | 0.001 | -0.8 (-1.3 to -0.2) | 0.01 |
| Weight, kg | ||||
| Adjusted for gender | -3.5 (-13.3 to 5.9) | 0.46 | -3.5 (-14.5 to 6.9) | 0.51 |
| Adjusted for gender and length of gestation | 1.8 (-8.0 to 12.1) | 0.70 | 1.0 (-10.1 to 12.3) | 0.85 |
| Fully adjusted3 | -1.2 (-11.4 to 8.8) | 0.81 | -0.1 (-10.4 to 12.4) | 0.87 |
| Length, cm | ||||
| Adjusted for gender | -0.1 (-3.3 to 1.4) | 0.46 | -2.1 (-4.7 to 0.5) | 0.11 |
| Adjusted for gender and length of gestation | 0.0 (-2.2 to 2.8) | 0.72 | -1.1 (-3.8 to 1.6) | 0.44 |
| Fully adjusted3 | 0.0 (-2.2 to 2.6) | 0.87 | -1.0 (-3.7 to 1.7) | 0.49 |
| Head circumference, cm | ||||
| Adjusted for gender | -2.1 (-5.1 to 0.1) | 0.16 | -0.5 (-3.9 to 2.8) | 0.77 |
| Adjusted for gender and length of gestation | -0.1 (-3.8 to 2.5) | 0.71 | 0.1 (-2.5 to 4.4) | 0.61 |
| Fully adjusted3 | -0.1 (-3.6 to 2.5) | 0.75 | 1.2 (-2.3 to 4.7) | 0.51 |
When we compared participants whose BDI scores were 10 or above (the commonly accepted cut-off score for mild depressive symptoms) at both time 1 and time 2 (45 men and 107 women) with participants whose BDI scores were below 10 at both times (497 men and 485 women), we found that the odds of belonging to the former relative to the latter group increased significantly for each day's decrease in length of gestation (OR=0.96, 95% CI 0.94–0.98; i.e. a 4.2% increase in risk) (Table 3). The difference was independent of gender and birth weight. Also independently of gender and birth weight, the odds of belonging to the group whose BDI and CES–D scores both exceeded the cut-off points at time 2 (53 men and 108 women) rather than the group in which neither score exceeded these levels (495 men and 521 women) was increased significantly for each day's decrease in length of gestation (OR=0.97, 95% CI 0.95–0.99, i.e. a 3.1% increase in risk). Adjusting further for the other confounders did not change these associations (Table 3).
Table 3 Comparison of length of gestation and body size at birth of individuals without (–DS) and with (+DS) depressive symptoms across time and across measures.
| -DS v. +DS across time1 | -DS v. +DS across measures2 | |||
|---|---|---|---|---|
| Characteristic at birth as a continuous variable | B (95% CI) | P | B (95% CI) | P |
| Length of gestation, days | ||||
| Adjusted for gender | 0.96 (0.94 to 0.98) | 0.0001 | 0.97 (0.95 to 0.99) | 0.001 |
| Adjusted for gender and birth weight | 0.96 (0.94 to 0.98) | 0.0001 | 0.97 (0.95 to 0.99) | 0.002 |
| Fully adjusted3 | 0.97 (0.94 to 0.99) | 0.002 | 0.97 (0.95 to 0.99) | 0.004 |
| Weight, kg | ||||
| Adjusted for gender | 0.79 (0.38 to 1.18) | 0.26 | 0.85 (0.58 to 1.24) | 0.39 |
| Adjusted for gender and length of gestation | 1.01 (0.66 to 1.54) | 0.97 | 1.03 (0.69 to 1.54) | 0.87 |
| Fully adjusted3 | 0.94 (0.61 to 1.46) | 0.79 | 1.04 (0.69 to 1.56) | 0.86 |
| Length, cm | ||||
| Adjusted for gender | 0.97 (0.88 to 1.07) | 0.52 | 0.95 (0.87 to 1.05) | 0.31 |
| Adjusted for gender and length of gestation | 1.03 (0.93 to 1.14) | 0.57 | 1.00 (0.91 to 1.10) | 0.99 |
| Fully adjusted3 | 1.04 (0.94 to 1.16) | 0.42 | 1.00 (0.90 to 1.11) | 0.99 |
| Head circumference, cm | ||||
| Adjusted for gender | 0.95 (0.84 to 1.08) | 0.41 | 0.91 (0.81 to 1.03) | 0.14 |
| Adjusted for gender and length of gestation | 1.02 (0.89 to 1.16) | 0.77 | 0.97 (0.85 to 1.10) | 0.61 |
| Fully adjusted3 | 1.03 (0.90 to 1.17) | 0.72 | 0.98 (0.86 to 1.12) | 0.78 |
Body size at birth and depressive symptoms
Multiple linear regression analyses showed that – after adjusting for gender and length of gestation – weight, length and head circumference at birth showed no significant linear association with depressive symptom scores (Tables 2 and 3). However, when we compared participants weighing 2.5 kg or less at birth (15 men and 16 women) with those weighing over 2.5 kg at birth (604 men and 736 women) we found that those in the low birth weight group had 47.4% (95% CI 11.9–94.3, P=0.006) higher BDI scores and 35.5% (95% CI 0.00–84.2, P=0.05) higher CES–D scores, and were 3.1 times (95% CI 1.3–7.4, P=0.01) more likely to have BDI scores exceeding the mild severity cut-off point at both time 1 and time 2, and 3.7 times (95% CI 1.6–8.6, P=0.002) more likely to have both BDI and CES–D scores exceeding mild severity and moderate frequency cut-off points at time 2, independent of gender and length of gestation. Adjusting for the other confounders did not change these associations (P<0.02), except that association with CES–D scores was rendered non-significant (P=0.07) (data not shown). Figure 1 compares the BDI and the CES–D scores for the two birth-weight groups.
DISCUSSION
The underlying causes of depression are incompletely understood. The importance of studying early origins of depression is highlighted by the developmental origin of health and disease hypothesis as well as by previous epidemiological studies. This study of depressive symptoms among members of the Helsinki Birth Cohort Study born in the years 1934–1944 is unique in that randomly selected members were followed up to the average age of 64 years. The study sample represented term births, i.e. gestational length 259–294 days, and was therefore not beset by the confounding symptoms and disorders that often accompany prematurity and postmaturity. Furthermore, depression was measured on two separate occasions during the follow-up a mean of 2 years apart, at mean ages of 61.5 years and 63.4 years. Two of the most frequently used and well-validated screening tools for severity (the BDI) and frequency (the CES–D) of depressive symptoms were used, and detailed maternal and neonatal characteristics were available from birth records.
Our results indicate that length of gestation, at term range of gestation, consistently predicted depressive symptoms later in life. Although the associations were not large in magnitude – 0.8–0.9% increase in depressive symptoms per day decrease in gestational length – they represent effects that are continuous and not accounted for by birth weight or gender, or by social class at birth, educational attainment, age at the time of testing or BMI score in adulthood. Further, the risk of depressive symptom scores staying above the cut-off point of mild severity (BDI ≥10) for a mean period of 2 years (range 0.4–3.3) was increased by over 4%, and above the cut-off points of mild severity (BDI ≥10) and moderate frequency (CES–D ≥16) on the two measures concurrently was increased by over 3% per day decrease in gestational length. These effects were not accounted for by birth weight, gender or the other covariates.
After adjusting for gender and length of gestation there was no association between any measure of depressive symptoms and the full range of variation in birth weight, length and head circumference. However, after adjusting for gender and length of gestation, a comparison of those whose birth weight was 2.5 kg or less with those born weighing over 2.5 kg showed that the former scored significantly higher on depressive symptoms, had a 3.1 times greater risk of experiencing increased depressive symptoms over time and a 3.7 times greater risk of experiencing increased depressive symptoms across measures. These associations did not change when adjusting further for social class at birth, educational attainment, age at the time of testing and adult BMI.
An association between lower birth weight and depression, evaluated at the age of 68 years by means of the self-reported Geriatric Depression Scale and the Geriatric Mental State semi-structured interview conducted by trained research nurses, has been shown among men born in Hertfordshire, England (Reference Thompson, Syddall and RodinThompson et al, 2001). However, the data from the Hertfordshire cohort did not include length of gestation, and thus it remains unclear whether the association is attributable to slower intrauterine growth, shorter length of gestation, or both. A role of slow intrauterine growth is argued for by studies in 26-year-old women (Reference Gale and MartynGale & Martyn, 2004) and in women and men at ages 23, 33 and 42 years (Reference Cheung, Khoo and KarlbergCheung et al, 2002) showing that the association between lower birth weight and depressive symptoms, measured by the self-reported Malaise Inventory (Reference Rutter, Thizard and WhitmoreRutter et al, 1970) is present – even though slightly weakened – after adjustment for gestational length. Associations between gestational length and depression were not, however, reported in these studies (Reference Cheung, Khoo and KarlbergCheung et al, 2002; Reference Gale and MartynGale & Martyn, 2004). Together with the results of our study, these findings suggest that mechanisms linking early environment with late-life susceptibility to depressive symptoms might include mechanisms leading to shorter duration of gestation as well as those related to slower intrauterine growth.
Early physiological adaptation – particularly of the hypothalamic pituitary–adrenal (HPA) axis – to hormonal responses, to maternal-foetal malnutrition and to other adverse intrauterine events may lie beneath the associations. Supporting the role of maternal–foetal undernutrition in mental ill health are findings from the Dutch Hunger Winter of 1944–1945, showing that male and female foetuses exposed to famine during middle to late gestation may experience major affective disorders in adulthood (Brown et al, Reference Brown, Susser and Lin1995, Reference Brown, van Os and Driessens2000). In support of a role for hormonal mechanisms, altered activity of the HPA axis is among the most consistently demonstrated biological abnormalities in depression (Reference Brown, Varghese and McEwenBrown et al, 2004); this hormonal axis is involved in the timing of parturition (Reference McLean and SmithMcLean & Smith, 2001) and increased activity of the axis in adulthood characterises individuals who were born earlier in gestation and smaller (Reference Phillips, Walker and ReynoldsPhillips et al, 2000; Reference Kajantie, Phillips and AnderssonKajantie et al, 2002). Other hormonal mechanisms may be involved as well. Nor can we rule out genetic mechanisms: there is evidence that depressive symptoms are at least moderately heritable (Reference Agrawal, Jacobson and GardnerAgrawal et al, 2004). Evidence also exists linking maternal prenatal distress with shorter length of gestation (Reference Glynn, Wadhwa and Dunkel–SchetterGlynn et al, 2001) and with less optimal psychological development of the offspring (Reference O'Connor, Heron and GoldingO'Connor et al, 2003; Reference Van Den Bergh, Mulder and MennesVan den Bergh et al, 2005). Thus, the association found between shorter length of gestation and depressive symptoms might reflect an underlying genetic mechanism: mothers with depression might through associated hormonal mechanisms be predisposed to earlier parturition, and the more severe and intense depressive symptoms in the offspring might reflect the heritable component of this disorder. Further support for a role for genetic mechanisms is provided by a recent study of twins aged 8–17 years in which a greater increase in depressive symptoms per unit decrease in birth weight was reported for individuals at genetic or familial risk of depression (Reference Rice, Harold and ThaparRice et al, 2006). Although the study adjusted birth weight for gestation, the effect of length of gestation per se was not studied (Reference Rice, Harold and ThaparRice et al, 2006).
Furthermore, our findings on the foetal origins of depressive symptoms may shed some light on the associations between depressive symptoms and increased risk of cardiovascular disease, type 2 diabetes (Reference Evans, Charney and LewisEvans et al, 2005) and the various risk factors for these diseases (Reference Räikkönen, Matthews and KullerRäikkönen et al, 2002). As proposed by Thomson et al (2001) it is indeed probable that depression and the associated disease risk share a common underlying basis that might be attributable to a less than optimal foetal environment.
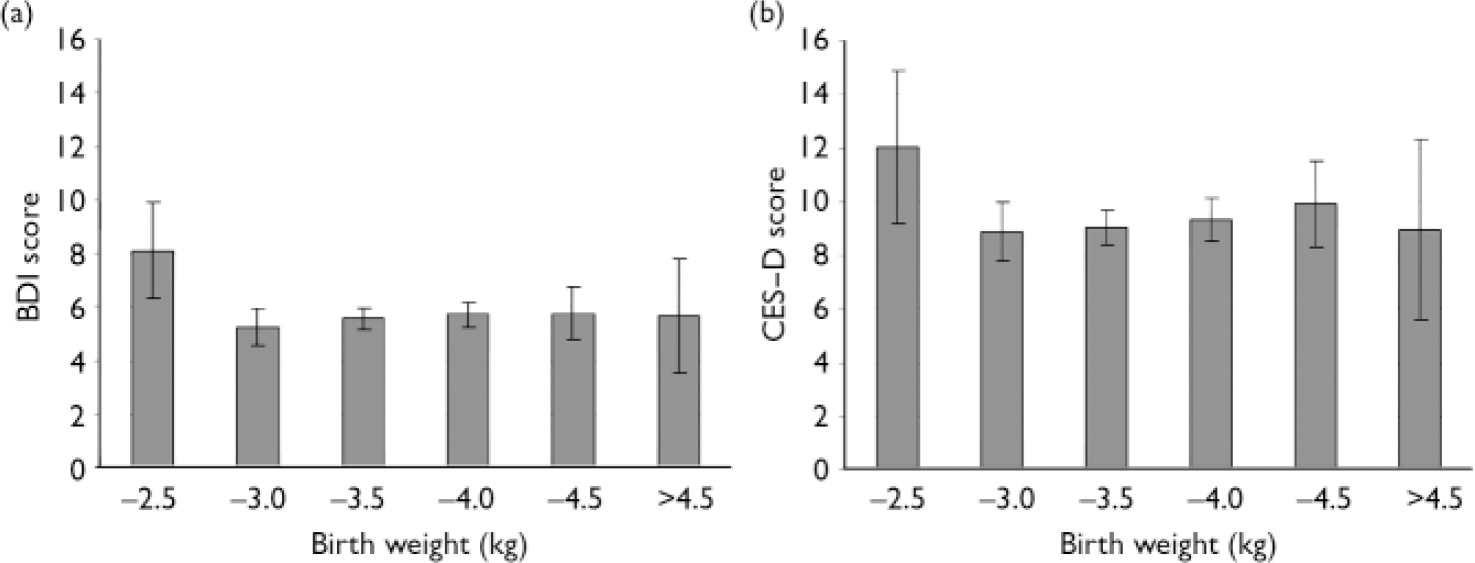
Fig. 1 Beck Depression Inventory (BDI) and Center for Epidemiological Studies – Depression scale (CES–D) scores (means and 95% confidence intervals) according to birth weight (n=31, n=219, n=562, n=433, n=104 and n=22 for the six categories from the lightest to the heaviest group respectively). Log-transformed depressive symptom scores have been adjusted for gender, length of gestation, social class at birth, educational attainment, age and body mass index in adulthood, and then back-transformed to the original scale for display.
Limitations
There are limitations to our study. In 1934–1944 gestation was estimated by the date of the last menstrual period, which might make the length of gestation, even at the term gestational range, as well as body size adjusted for gestational length, to some extent imprecise. Although this introduces inaccuracy, misclassification of gestational age would only weaken our ability to detect associations with depression in adulthood. Moreover, length of gestation and body size at birth are affected by many factors that could have long-term neurodevelopmental consequences; however, the data available to us do not allow detailed evaluation of the specific pathophysiological mechanisms that are reflected by these proxies. Cohort members who died before 1971 were excluded from our survey. Loss of follow-up across decades is also inevitable. However, over 86% of the randomly selected, still traceable cohort members were available for the psychological survey. Participation in the follow-up was more frequently related to female gender and (even after adjusting for this difference) to lower level of depressive symptoms. Participation in follow-up was not, however, related to any of the neonatal or maternal characteristics. Finally, the age range of the sample ought to be considered in light of external validity of the findings, as depressive symptoms in later and in earlier life may differ.
We conclude that implications of earlier birth and smaller body size at birth persist into later adulthood. These results confirm earlier studies relating birth weight to symptoms of depression (Reference Thompson, Syddall and RodinThompson et al, 2001; Reference Cheung, Khoo and KarlbergCheung et al, 2002; Reference Gale and MartynGale & Martyn, 2004; Reference Patton, Coffey and CarlinPatton et al, 2004). Moreover, they add to the previous literature by showing that independently of birth weight, shorter length of gestation at the term gestational age range shows continuous associations with depressive symptoms, and may thus serve as another marker of early environmental influences in the cascade of events leading to more severe and frequent depressive symptoms later in life.
Acknowledgements
This study was supported by grants from the Academy of Finland, University of Helsinki, the British Heart Foundation, the Finnish Foundation of Cardiovascular Research, the Finnish Diabetes Research Foundation, the Finnish Medical Society (Duodecim), Finska Läkaresällskapet, the Päivikki and Sakari Sohlberg Foundation, the Juho Vainio Foundation, the Yrjö Jahnsson Foundation, the Signe and Ane Gyllenberg Foundation and the Finnish Foundation for Paediatric Research.


eLetters
No eLetters have been published for this article.