


1. Introduction
Human activity recognition (HAR) is a process of automatically recognizing the activity of an individual or group. HAR is an emerging challenge among researchers. HAR has many possible uses in a variety of fields, including healthcare [Reference Gupta, Gupta, Pathak, Jain, Rashidi and Suri1], sports [Reference Gupta, Gupta, Pathak, Jain, Rashidi and Suri1], and security [Reference Gupta, Gupta, Pathak, Jain, Rashidi and Suri1]. The area is widely used in various applications such as video surveillance in the military, human–computer interaction, sports, etc. [Reference Zhang, Li, Zhang, Shahabi, Xia, Deng and Alshurafa2]. There are two methods for identifying human activity: one relies on wearable sensors and visual sensors. A sensor that can record the body’s acceleration, angular velocity, gravity, etc., is attached to the body in the wearable-based system. In the vision-based system, an RGB camera captures the subject’s activities. Various joint information is gathered from each frame with depth-based sensors [Reference Zhang, Zhang, Jin, Cen, Voronin and Wan3]. An ensemble model is proposed for local correlation that makes use of intra-class variability and class center reliability. The suggested pedestrian attention module aids in focusing on certain features, while the proposed priority-distance graph convolutional network (PDGCN) module predicts class center nodes and determines distances [Reference Gao, Xuan, Zhang, Wan and Choo4]. AFCDL, an adaptive fusion, and category-level dictionary learning paradigm, has been proposed to solve drawbacks such as shifting angles of view, background clutter, and movement patterns. AFCDL enhances sample reconstruction for action recognition by learning adaptive weights for each camera. With a 3% to 10% gain in recognition accuracy across four multiview action benchmarks, it trumps cutting-edge techniques.
Microsoft Kinect and other low-cost, high-mobility sensors are widely used for recognizing human motion [Reference Gupta, Gupta, Pathak, Jain, Rashidi and Suri1]. Several techniques have been developed that use the information from the skeleton joint to identify human indications. Computer vision researchers have paid particular attention to Kinect’s ability to monitor skeleton joints. Elements are independent of a person’s size, look, and changing camera angles that can be extracted using the skeleton join feature of the Kinect [Reference Zhang, Li, Zhang, Shahabi, Xia, Deng and Alshurafa2]. Recognition of activity with conventional cameras may be complex due to illumination variations, stance variations, and cluttered backgrounds. Kinect can record motion information even in changing illumination, poses, and complex environments.
If we talk about the skeleton joint’s features, it cannot identify human activities. Some modifications or adding more features are required for efficient activity classification. The gain in momentum in center of mass coordinates, velocity, and acceleration, as well as other derived features like a person’s height and the different joints angles, and distance between joints, can be calculated for identification during actions like walking, vomiting, situps, or differentiate between similar motion activities, etc. Such features are programmatically engineered because they cannot be directly calculated by convolution neural network and long short-term memory (LSTM) architecture [Reference Nair, Thomas and Jayagopi5] approaches. In this study, the Kinect-generated features are inputted into a deep learning network and a collection of hand-engineered kinematic features. Using a Kinect V2 sensor, we first applied skeletal tracking algorithms and gathered 3D joint locations for each frame. To improve the model’s performance, a new set of features, that is, distance feature, different joints angle, etc., have been created with the help of Kinect-generated features. Natural body coordinates have been utilized to calculate velocity, acceleration, and joint angle properties. The dataset is preprocessed once the features are extracted and fed into the deep learning models. The proposed model is a fusion model of CNN and bidirectional long short-term memory (BiLSTM). In the proposed model, the output of each convolutional block is added to the following convolutional block output to prevent the network from vanishing gradient and to improve the feature quality. In the proposed model, input feature vector passes through two feature extraction branches: on one side, features are inputted to the CNN and BiLSTM layer series and generate new feature vectors. Conversely, the input feature vector passes through the BiLSTM layer to generate a new feature vector. Finally, these spatial and temporal features are concatenated and inputted into a fully connected network for a probabilistic classification score. The manuscript’s significant contributions are as follows:
-
1. A dataset named “LNMIIT-KHAD (LNMIIT-Kinect Human Activity Dataset)” has been developed from 20 individuals and has seven indoor activities such as eating, walking, headache, handshake, situps, exercise, and vomiting with all possible variations.
-
2. A hybrid deep learning classification model comprising CNNs and BiLSTM Layers has been proposed. The model can extract spatiotemporal features from the input feature sets to classify human activities efficiently and precisely. The model also consists of a dropout and regularizing layer to improve the model performance and prevent the model from overfitting.
-
3. A comparative analysis has been done for different deep learning models with the LNMIIT-KHAD dataset. The model has been evaluated on publicly available datasets to check the model performance.
-
4. To protect user privacy, a set of auto-generated features and hand-engineered kinematic features has been used as an input feature vector for the proposed hybrid deep learning model instead of the visual input.
The paper consists of five sections. Section 2 is related to the literature survey. Section 3 is associated with the dataset description. Section 4 describes the proposed methodology, which includes data collection and preprocessing, data normalization and scaling, feature selection, windowing and segmentation, and the proposed classification model. Section 5 describes experimental results followed by references.
2. Related Works
Existing literature [Reference Zeng, Nguyen, Yu, Mengshoel, Zhu, Wu and Zhang6, Reference Dhanraj, De and Dash7] used inertial measurement unit (IMU)-enabled devices on their waists, wrists, and feet to capture human activity data in the form of acceleration, angular velocity, and other metrics. Before further processing, several prepossessing steps, such as noise reduction and normalization, have been applied to raw data. The human behavior is then classified using a feature extraction and model training procedure. Several methods for simulating and recognizing human actions have been presented. Early researchers mainly employed decision trees, support vector machines (SVMs), naive Bayes, and other machine learning methods to identify the data gathered by IMU sensors. Researchers have developed classification models for recognizing human activity using various methods. For instance, Wang et al. [Reference Wang, Chen, Hao, Peng and Hu8] presented a DF network, a profoundly fully connected network to attain an exemplary data structure collated with a synthetic neural network. The original skeleton graphs were converted by Ke et al. [Reference Ke, Bennamoun, An, Sohel and Boussaid9] into pseudo-frames in four human body areas, and CNN was used to extract spatial attributes from the pseudo-structures. Additionally, Liu et al. [Reference Liu, Tu and Liu10] proposed that by encoding skeletal joints into spatial and temporal volumes, a three-dimensional convolutional neural network (CNN) was used to collect spatial and time sequence information at a local timescale. By considering the three-dimensional geometric relationship between the human parts that used body part rotations and its translations in 3-dimensional space, Vemulapalli et al. [Reference Ding, Liu, Belyaev and Cheng11] proposed that new skeleton representation has been presented. The authors classified human activities using Lie algebra and described human actions as curves in the Lie group. Scana et al. [Reference Scano, Chiavenna, Malosio, Tosatti and Molteni12] development of an automated system for motor assessment of individuals with neurological disorders used the Kinect sensor. They assessed the reaching performance scale score derived from the Kinect data, and the results were comparable to the visual score derived in a clinical setting. Vishwanath et al. [Reference Bijalwan, Semwal and Gupta13] have proposed a methodology for recognizing human activity using human gait patterns. They used an IMU sensor with three degrees of freedom to capture seven different activities. They also introduced kinematic features and Kinect-generated features for classifying activities. Rahul Jain et al. [Reference Jain, Semwal and Kaushik14] proposed a methodology to achieve the walking pattern classification. For that, human lower extremity activities are considered to understand walking behavior. An IMU has been used as a wearable device to capture the walking movement of different lower limb joints. For activity classification, two different deep learning models, namely CNN and LSTM, have been used. Vishwanath et al. [Reference Bijalwan, Semwal, Singh and Mandal15] proposed a hybrid deep learning approach for post-stroke rehabilitation. Microsoft Kinect V2 has been used to capture the targeted activities. Different combinations of deep learning models have been used for classification; CNN-Gated recurrent unit (GRU) achieved the highest accuracy. Vijay Bhaskar Semwal et al. [Reference Semwal, Gupta and Lalwani16] proposed multitasking human walking activity recognition using human gait patterns. IMU sensor has been used to capture different walking patterns of the candidates. Various combinations of deep learning models have been used for activity classification; GRU-CNN achieved the highest accuracy. Nidhi Dua et al. [Reference Dua, Singh and Semwal17] proposed a multi-input hybrid deep learning model for HAR. Wearable sensors like gyroscopes and accelerometers have been used to collect human activity data. The model achieved a classification accuracy of 95%. Santosh et al. [Reference Yadav, Tiwari, Pandey and Akbar18] proposed a deep architecture fusion of CNN and LSTM. The final model achieved an accuracy of 98% for a self-collected dataset.
The author uses principal component analysis to reduce feature dimensions by extracting Euclidean distance and spherical coordinates between normalized joints. HAR is carried out using statistical characteristics and principal component analysis, proposed in ref. [Reference Ashwini, Amutha and raj19], and globally contextualized attention LSTM [Reference Liu, Wang, Hu, Duan and Kot20]. To tackle the sensor-based HAR challenges, ref. [Reference Yan, Liao, Zhao, Wang, Ma, Lv, Xiong and Wang21] presented a multilayer ResGCNN (graph convolutional neural network) residual structure. The deep transfer learning tests utilizing the ResGCNN model demonstrate excellent transferability and few-shot learning performance. Table I lists the dataset utilized in this study. Some of the works related to HAR have been listed in Table I.
Table I. Related work-based human action recognition system.

3. Proposed methodology
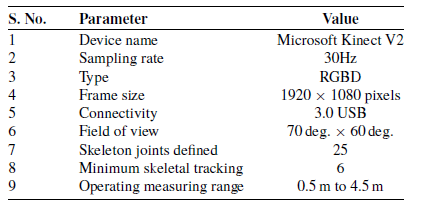
To track and identify human activity in the interior environment, we conducted extensive ablation research, created a new dataset, and created a novel hybrid model based on deep learning. In the first step, the activity is recorded with the help of the Kinect V2 sensor at 30 FPS. There is a possibility of null value detection due to no activity recorded for that time. As per our algorithm for a null value, it shows no activity. The recorded data may also contain some outliers. The linear interpolation method has been used to remove outliers. The feature set has been normalized to reduce duplication using the 3D joints method indicated in Eq. (1). Table II shows details about Kinect V2 sensor specifications. In addition to Kinect-generated information, certain valuable features have been retrieved for recognizing various activities, such as velocity, acceleration, the angle between joints, a person’s height, and the distance between joints. Next, a set of selected features is made out of Kinect-generated and kinematic features. Finally, the modified input feature sets are shaped according to the deep learning classification models and input to the state-of-the-art deep learning models for classification score generation. Figure 1 shows the proposed methodology:
 \begin{equation} X_{\text{norm}}=\frac{x-x_{\min}}{x_{\max}-x_{\min}} \end{equation} $X_{\text{norm}}$
= normalized value of a feature value
$X_{\text{norm}}$
= normalized value of a feature value

Figure 1. Proposed methodology.
Table II. Kinect motion sensor V2 specification.
 $x_{\min}$
= minimum value of a feature vector
$x_{\min}$
= minimum value of a feature vector $x_{\max}$
= maximum value of a feature vector
$x_{\max}$
= maximum value of a feature vector
3.1. Dataset collection and preprocessing
An in-depth examination of the data gathering and improvement process is provided in this section. We created our own dataset and presented it in this publication. A set for dataset collection has been shown in Fig. 2. The proposed dataset consists of seven activities, that is, walking, situp, eating, handshaking, headache, exercise, and vomiting, collected from 20 people (13 males and 7 females) between the ages of 25 and 40 years. Microsoft Kinect sensor V2 can identify 25 distinct joints in the human body. We extract camera and orientation coordinate values from every joint in the human body and save them in comma separated values (CSV) files. We gathered data from 20 distinct volunteers, each completing a task for 20 s, as shown in Table III. Each task has 400 samples, with each participant doing it 10 times (70 samples per participant). The files for each activity are concatenated.

Figure 2. Dataset recording setup.
Table III. Dataset description.

After assembling all the necessary data, the raw data are subjected to different preprocessing techniques. Only a few of the skeleton’s joints are instructive for a given task, as ref. [Reference Chen, Wang, Xue and He29] noted, so not all skeletal joints are useful. In our situation, we omitted joints such as the Spine Base. Head, Shoulder Left, Elbow Left, Hand Left, Shoulder Right, Elbow Right, Hand Right, Hip Left, Knee Left, Ankle Left, Foot Left, Hip Right, Knee Right, Ankle Right, and Foot Right as shown in Fig. 3 that are not crucial for identifying the intended activity. Table IV describes the list of tracked skeleton joints, a set of Kinect-generated features, derived features, and activity class labels. Some evaluated images of State of the art (SOTA) datasets, that is, WISDM, UCI-HAR, and NTU-RGBD datasets, are shown in Fig. 4. For model evaluation on SOTA datasets, MediaPipe framework has been used to extract the joint’s motion information as shown in Fig. 5.

Figure 3. Joints details as per activity.

Figure 4. Samples from WISDM, UCI-HAR, and NTU-RGBD datasets.

Figure 5. Classification process for NTU-RGBD, UP-FALL, and UR-Fall datasets.
Table IV. Set of features specifications.

3.1.1 Windowing and segmentation
Windowing and segmentation are used in many HAR applications [Reference Banos, Galvez, Damas, Pomares and Rojas30]. Segmentation is typically used during the preprocessing stage to facilitate data analysis. Windowing is a frequent segmentation technique. The sampling frequency used in Kinect V2 activity recording is 30 Hz (30 samples per second). Figure 6 depicts data splitting into an allotted frame (Window) of 2.57 s (80 attributes set) with a 0.5 intersection.

Figure 6. Windowing and segmentaion.
3.2. Geometric and Kinematic feature calculation
The coordinates of the joints in the 3D human skeleton are utilized to evaluate various features and build feature vectors. Feature vectors are programmatically calculated by using Kinect V2 features generated for each frame. These are the unique features that easily distinguishe each activity with one another. As per the dataset, only 16 joints are selected for activity classification as mentioned in Fig. 3.
3.2.1 Angle between skeleton joints
An illustrated skeleton is created by connecting the 3D coordinates of the various body joints with a line. As per our dataset, six relevant joints, namely elbow right, elbow left, knee left, knee right, hip left, and hip right, are utilized for the angle feature calculation. Figure 7 presents a distance and angle calculation method. The average difference between the hip-to-knee and ankle-to-knee values is used for calculating the angle value. If joint1 is the hip joint, joint2 is the knee joint, and joint3 is the ankle joint, and then the angle between skeletons is as follows:
 \begin{equation} \Theta =\frac{\text{joint1joint2joint3}}{\text{joint1joint2 * joint2joint3}} \end{equation}
 \begin{equation} \text{joint1joint2joint3}=\text{joint1}_{1}*\text{joint1}_{2}+\text{joint2}_{1}*\text{joint2}_{2}+\text{joint3}_{1}*\text{joint3}_{2} \end{equation}
 \begin{equation} \text{joint1}_{1}=x1-y1,\text{joint2}_{1}=x2-y2,\text{joint3}_{1}=x3-y3 \end{equation}
 \begin{equation} \text{joint1joint2}=\sqrt{\text{joint1}_{1}^{2}+\text{joint2}_{1}^{2}+\text{joint3}_{1}^{2}} \end{equation}
 \begin{equation} \text{joint2joint3}=\sqrt{\text{joint1}_{2}^{2}+\text{joint2}_{2}^{2}+\text{joint3}_{2}^{2}} \end{equation}
 \begin{equation} \text{Angle}=\frac{\cos^{-1}{\theta }*180}{\pi } \end{equation}

Figure 7. Geometric and kinematic features.
3.2.2 Velocity prediction
The velocities of the X, Y, and Z axes are calculated using the difference between the human skeleton’s coordinates at time t and time t + 1. Along with measuring velocity, the differences between succeeding frames are also utilized to detect acceleration in the X, Y, and Z axes. We included average acceleration and average velocity as a characteristic as well. In a HAR application that detects human gestures or body movements, velocity can be utilized to distinguish between slow and fast motions and recognize certain movement patterns. Analyzing velocity patterns allows users to distinguish between different activities or gestures, detect irregularities or sudden changes in motion, and characterize movement speed. It can be calculated as:
 \begin{equation} \text{Velocity}(t)=\text{distance between joints}/\text{time Elapsed} \end{equation}
 \begin{equation} \upsilon (t)=\frac{\sqrt{(\text{Joint}_{x}(t+1)-\text{Joint}_{x}(t))^{2}+(\text{Joint}_{y}(t+1)-\text{Joint}_{y}(t))^{2}}}{(t+1)-t} \end{equation}
where Joint $_{x}$
(t + 1) is value of position x of respective joint at t + 1;
$_{x}$
(t + 1) is value of position x of respective joint at t + 1;
Joint $_{y}$
(t + 1) is value of position y of respective joint at t + 1;
$_{y}$
(t + 1) is value of position y of respective joint at t + 1;
joint $_{x}$
(t) is value of position x of respective joint at t;
$_{x}$
(t) is value of position x of respective joint at t;
Joint $_{y}$
(t) is value of position t of respective joint at t.
$_{y}$
(t) is value of position t of respective joint at t.
3.2.3 Distance prediction
Through the dataset, we also included a displacement feature vector that included the distances between the hands, between the hand and the head, and the distance between the hand and the spine base:
 \begin{equation} \text{Distance}(t)=\sqrt{(\text{Joint}_{x}(t+1)-\text{Joint}_{x}(t))^{2}+(\text{Joint}_{y}(t+1)-\text{Joint}_{y}(t))^{2}} \end{equation}
3.2.4 Height prediction
The distance between the extreme joints at the top and bottom of the body determines the height. Because every person’s height varies, this factor normalizes other feature vectors.
3.3. Classification models
The completed dataset and its derived features are fed into the deep learning network in this stage for classification. Different classification techniques have been employed, including CNN, LSTM, ConvLSTMs, and the proposed hybrid deep neural network.
-
1. Convolutional Neural Network Architecture [Reference Jiang, Lu, Lu and Zhou22]: First, the activity recognition has been implemented using the CNN [Reference Jiang, Lu, Lu and Zhou22]. Let $X_{t}$
be the 1D feature vector consisting of Kinect-generated and derived features. The convolutional layers output can be given as:(11)where l is the layer index and
\begin{equation} \text{Out}^{l,j_{}}_{i}=\sigma \!\left(\text{Bi}_{j}+\sum _{^{m=1}}^{M}\text{wt}^{j_{}}_{m}*X^{0,j}_{i+m-1}\right) \end{equation}
$\sigma$
is the sigmoid activation function.
$\text{Bi}_j$
is the bias associated with the
$j\text{th}$
feature, and M is the filter size. wt is the weight for the
$j^{\text{A normalization}}$
and the
$m\text{th}$
to normalize the input values and lead to more accurate activation. Kernel regularizer and dropout layers are used to minimize the overfitting of the model.
$X_{t}$
be the 1D feature vector consisting of Kinect-generated and derived features. The convolutional layers output can be given as:(11)where l is the layer index and
\begin{equation} \text{Out}^{l,j_{}}_{i}=\sigma \!\left(\text{Bi}_{j}+\sum _{^{m=1}}^{M}\text{wt}^{j_{}}_{m}*X^{0,j}_{i+m-1}\right) \end{equation}
$\sigma$
is the sigmoid activation function.
$\text{Bi}_j$
is the bias associated with the
$j\text{th}$
feature, and M is the filter size. wt is the weight for the
$j^{\text{A normalization}}$
and the
$m\text{th}$
to normalize the input values and lead to more accurate activation. Kernel regularizer and dropout layers are used to minimize the overfitting of the model.
-
2. Long Short-Term Memory Architecture [Reference Mekruksavanich and Jitpattanakul31]: Second, we have implemented activity recognition using LSTM, an improved version of recurrent neural network (RNN), which avoids the vanishing gradient problem and consists of memory cells. A single-cell, three-gate LSTM module can selectively learn, unlearn, or retain knowledge from each entity. LSTM’s cell state facilitates an uninterrupted flow of information between units by allowing a few linear exchanges. Each component has inputs, outputs, and forget gates that can add or remove data from the cell state. The forget gate uses a sigmoid function to choose whether to ignore information from previous cell states. The input gate regulates the flow of information about the current cell state by performing point-wise multiplication of “sigmoid” and “tanh.” The output gate determines which data have to be sent at the conclusion.
Studies have been done on the impact of different batch sizes, hidden layers, and learning rates. Two stacked LSTM layers with 100 neurons each for 7 classes, a learning rate of 0.0025, and a batch size of 128 yielded the best results. The Adam optimizer was used to calculate losses using the softmax loss function.
-
3. ConvLSTM Architecture [Reference Khan, Afzal and Lee32]: Next, we applied ConvLSTM [Reference Khan, Afzal and Lee32] to classify our dataset. CNN and LSTM were combined to create ConvLSTM. Here, CNN was used to extract spatial characteristics, LSTM to predict sequences, and dense layers to map the features to create a more separable space. The hyperparameters had been optimized for the size, number of layers, steps, batch size, and learning rate (0.0001). The shape of the feature vector is first set to a 3D tensor, including batch shape, steps, and input feature dimension. Then after the convolution operation, features again reshape to the 3D array as (batch size, time steps, and sequence length). We used Adam for optimization. The model got the precision and F1 score of 97.89% and 97.75%.
-
4. Proposed Hybrid Deep Learning Architecture: We proposed the hybrid approach in which parallel feature learning methodology has been used. The input features vector has been applied to the 1D convolution and BiLSTM layers. The architecture shown in Fig. 8 has two parallel paths. One path has layers of 1D convolution layer, 1D max-pooling layers, and a BiLSTM layer. The path extracts both spatial and temporal features. In this path, input features are also added to the spatial features extracted from convolution layers. The path extracts spatial and temporal features without losing any input characteristic. The second path extracts only temporal features. These features are concatenated into a single feature vector. The combined feature has been passed through a BiLSTM layer. They were finally flattening the features. Two dense classification layers and the softmax activation function generate a probabilistic classification of activities. Table V shows the proposed hybrid deep learning model summary:
(12)
\begin{equation} y_{t}=w_{y}*h_{t} \end{equation}


Figure 8. Proposed classification model.
Table V. Proposed hybrid deep learning model summary.

4. Experimental results
The experimental findings employing CNNs, LSTMs, ConvLSTM, and the suggested hybrid deep learning model are presented in this section. The proposed model has been tested using cutting-edge datasets, that is, NTU-RGBD, UP-FALL, UR-Fall, WISDM dataset, UCI-HAR, and the recently gathered LNMIIT-KHAD dataset (samples are shown in Fig. 9) captured by the Kinect V2 sensor. Dataset development and preprocessing are the main steps described in Section 4. After different variation in the hyperparameters, final values of the hyperparameters for the proposed model are shown in Table VI.

Figure 9. Human activity samples from LNMIIT-KHAD dataset.
Table VI. Hyperparameter used for model training.

4.1. Model evaluation
In this section, we performed different experiments using deep learning approaches such as CNNs, LSTMs, ConvLSTM, and the suggested hybrid deep learning model. The proposed hybrid model combines the characteristics of CNNs, BiLSTM, and residual connections to efficiently capture spatial and temporal data in HAR. The architecture intends to manage sequential data and exploit local and global dependencies within input sequences. The CNN component, which is at the core of the architecture, is responsible for extracting spatial characteristics from the input skeleton data to represent joint positions over time. To downsample the feature maps and decrease spatial dimensions while preserving critical data, max-pooling layers and ReLU activation layers are added.
The sequence of joint features extraced by the CNN is then processed using the BiLSTM component. Bidirectional LSTMs enable the model to take into account both past and future information for each time step, facilitating the capture of temporal dependencies in both directions. The model’s capacity to identify long-range dependencies within the sequences is improved by stacking LSTM layers. The hybrid model includes residual connections to effectively handle the difficulties of deep network training. By introducing skip connections provided by these connections, the network can learn residual functions and achieve a smoother gradient flow during training. The residual connections improve gradient propagation by reducing the degradation problem in very deep networks.
Algorithm 1. Proposed HAR algorithm

The characteristics from the CNN and BiLSTM routes are combined during the fusion and classification stage. Fully connected layers are utilized to do classification and predict the label for human activity using the fused characteristics. In order to successfully combine local and global properties, this comprehensive strategy makes use of the spatial awareness of CNNs, the sequential information handling of BiLSTMs, and the skip connections of residual connections. The proposed hybrid model has exceptional performance in HAR, correctly categorizing a wide variety of behaviors beyond the training set. It offers a potential option for HAR applications in the real world, where accurate and dependable activity recognition is crucial.
We evaluate the performance of these models on our proposed dataset and states-of-the-art datasets, that is, Wisdom Dataset [Reference Salim, Alaziz and Abdalla33], and UCI-HAR dataset [Reference Khatun, Yousuf, Ahmed, Uddin, Alyami, Al-Ashhab, Akhdar, Khan, Azad and Moni34], NTU- [Reference Shahroudy, Liu, Ng and Wang35], UP-FALL [Reference Martínez-Villaseñor, Ponce, Brieva, Moya-Albor, Núñez-Martínez and Peñafort-Asturiano36], and UR-Fall [Reference Lotfi, Albawendi, Powell, Appiah and Langensiepen37] which are shown in Fig. 10.

Figure 10. Model accuracy variation w.r.t batch size variation during training.
A ratio of 60:20 was used to divide the dataset into train and validation sets, leaving 20% for testing. The validation dataset assessed the trained model’s performance and accuracy, whereas the training set was utilized for training the classifier. Due to categorical cross-usefulness entropy for evaluating the performance of the last layer with softmax activation, the model loss is calculated using this metric. All of the models underwent 120 epochs of training. Precision, recall, F1-score, and accuracy are metrics used to assess the system’s performance.
The accuracy and loss curves using LSTM, CNN, ConvLSTM, and proposed are shown in Fig. 11.

Figure 11. Accuracy and loss versus epochs graphs for different deep learning models.
We assess the performance of the various deep learning models outlined above on our suggested dataset and two other cutting-edge datasets. When compared to other models, our proposed model had the best accuracy. Table VII displays the experimental outcomes of SOTA and proposed deep learning models. Table VIII presents the precision, recall, and F1-score values for different algorithms performed with ±1 percentage change.
Table VII. Comparison table for different datasets for different deep learning models.

Table VIII. F1-score, recall, and precision for different deep learning models and proposed model.

All the accuracy and plot are calculated for 120 epochs and a batch size of 128. The accuracy is also varied concerning frame size and batch size. For that, we performed various models on our proposed dataset with different batch sizes and found that the proposed model performed well for a batch size of 128 and frame size of 80, which is shown in Figs. 10 and 12.

Figure 12. Model accuracy variation w.r.t feature frame size.
4.2. Prominent features of proposed hybrid architecture
The proposed model has been performing well on state-of-the-art datasets, proposed dataset, and also outperforms state-of-the-art deep learning models. The following are the key aspects of the proposed hybrid architecture for HAR:
-
1. Robust Handling of Illumination Variation : The model mitigates the influence of shifting illumination conditions by effectively gathering and weighting essential joint angle information, ensuring consistent and accurate activity classification. Extensive testing on a variety of datasets confirms the model’s exceptional performance, demonstrating its robustness in real-world circumstances. This breakthrough holds potential for applications such as health monitoring, surveillance, and interactive systems, where lighting variance is a typical issue.
-
2. Hand-Engineered Kinematic Features: The model includes novel hand-engineered kinematic elements in addition to joint positioning and orientation data. These characteristics capture the kinematic qualities of human motion, improving the model’s capacity to distinguish various activities.
-
3. Cluttered Background Resilience: The proposed model displays robustness to cluttered backgrounds without relying on depth-based data by using Kinect features and kinematic features. The Kinect features extract spatial information from skeleton joint data, allowing the model to focus on important body angles while ignoring background noise. Furthermore, the incorporation of hand-engineered kinematic features provides vital insights into motion dynamics, assisting in the differentiation of activities among clutter. This technology guarantees accurate HAR even in difficult circumstances where cluttered backdrops may interfere with conventional depth-based methods.
-
4. Real-Time Data Performance: The proposed architecture performs well in real-time data scenarios, suggesting its viability for practical deployment in real-world applications. Figure 13 shows the comparison between different classification models on real-time implementation.
-
5. Temporal Information Learning: The inclusion of bidirectional LSTM (BiLSTM) layers allows the model to capture temporal dependencies in motion sequences well. By bidirectionally analyzing joint angle data, the model acquires a thorough grasp of activity dynamics, improving its capacity to make accurate conclusions. This temporal information learning is critical for robust human activity detection, guaranteeing that the model can handle complicated and dynamic motion patterns across several activities.
-
6. State-of-The-Art Performance: The proposed hybrid architecture for HAR achieves state-of-the-art performance in terms of accuracy and robustness. The model effectively captures both spatial and temporal characteristics from joint motion and kinematic data by fusing CNNs and BiLSTM with residual connections. It is clearly stated from Fig. 14 percentage improvement of 2.97% in walking, 2.02% in eating, 1.85% in exercise, 3.3% in situps, and 2.94% in headache activity.
-
7. Robust Generalization across Activity Categories: The proposed model exhibits outstanding generalization capabilities, accurately identifying a varied range of activities that extend outside the training set. This demonstrates its outstanding adaptability and versatility to many activity categories, making it a powerful tool for real-world human activity identification applications.

Figure 13. Real-time accuracy comparison of different classification models.

Figure 14. Confusion matrices for proposed and state-of-the-art architectures.
As the proposed model has a fusion of the CNN and BiLSTM layers, BiLSTM networks process input sequences simultaneously in the forward and backward directions. This enables the network to gather contextual data from both previous and upcoming time steps. It facilitates a deeper comprehension of the sequence’s components’ connections and dependencies and handles long-term dependencies. Due to that, the proposed model has less misclassification error as a comparison to state-of-the-art models, as shown in Fig. 15.

Figure 15. Classification error for different deep learning models.
In the proposed methodology, the complete video has been converted into video frames. Trained model has been predicted the activity based on the video frame set of 80. Figures 16 and 17 show the prediction accuracies for walking and vomiting activity. The accuracy of our proposed model outperforms existing state-of-the-art deep learning models. Precision, recall, and F1-score are also better than state-of-the-art deep learning models, which is shown in Tables VIII and IX. The Precision, recall, and F1-score curve for LSTM, CNN, convLSTM, and the proposed approach are shown in Fig. 18.

Figure 16. Accuracy calculation for walking activity using different classification models.

Figure 17. Accuracy calculation for vomiting activity using different classification models.

Figure 18. Precision, recall, and F1-score variation for different deep learning models.
Table IX. Performance comparison table for LNMIIT-KHAD and NTU-RGBD dataset.

5. Conclusion and future scope
A hybrid deep learning model and a single Kinect V2 sensor have been used as an activity identification system that protects user privacy. Primary skeleton coordinates and geometrical and kinematic information are inputted into the proposed deep learning network. The user’s privacy is safeguarded since the system only uses derived features and basic skeleton joint coordinates, not the user’s real photographs. On the LNMIIT-KHAD dataset and leading datasets, the performance of the deep learning-based classification algorithms such as CNN, LSTM, ConvLSTM, and the suggested model has been compared. The recommended approach correctly identifies human behaviors, including eating, exercising, situps, headache, vomiting, shaking hands, and walking. The proposed model’s accuracy of 99.5 % surpasses that of CNN, LSTM, and ConvLSTM, which have accuracy rates of 95.76 %, 97 %, and 98.89 %, respectively. To evaluate the performance of the proposed model, it has been tested on other additional datasets, that is, NTU-RGBD [Reference Shahroudy, Liu, Ng and Wang35], UP-FALL [Reference Martínez-Villaseñor, Ponce, Brieva, Moya-Albor, Núñez-Martínez and Peñafort-Asturiano36], and UR-Fall [Reference Lotfi, Albawendi, Powell, Appiah and Langensiepen37]. The testing accuracies are shown in Table X. The suggested method has been tested in real time and discovered to be independent of the stance, individual, clothes, etc. The dataset sample is accessible to the general public. In the future, we want to include more complicated physical activities and develop a model that can detect the activity of several people at once. We will also investigate advanced deep learning-based approaches such as reinforcement, lifetime, incremental, and active learning for activity recognition. We also have plans to create a sizable HAR dataset, including a variety of daily activities and physical activities.
Table X. Model testing accuracy on different SOTA datasets and proposed dataset.

Author contributions
Rabul Laskar, Joyeeta Singha, and Sandeep Saini conceived and designed the study. Manoj kumar sain conducted data gathering, performed model analyses, and wrote the article.
Financial support
The paper is supported by DST (Govt. of India) under the SEED Division $[SP/Y O/407/2018]$
. Dr. Joyeeta Singha is the principal investigator.
$[SP/Y O/407/2018]$
. Dr. Joyeeta Singha is the principal investigator.
Competing interests
The authors declare no Competing interests exist.
Ethical approval
Not applicable.
Dataset availability
The author declares that the dataset will be available on request. Please contact the corresponding author.
Declaration
The author declares that the manuscript is prepared as per the journal’s guidelines for authors.


