


1. Introduction
Nucleate boiling is one of the most efficient heat transfer modes, with a heat-dissipation ability up to two orders of magnitude greater than that produced by liquid convection (Dhillon, Buongiorno & Varanasi Reference Dhillon, Buongiorno and Varanasi2015). However, beyond critical heat flux (CHF), a vapour layer develops between the liquid and the hot solid surface, leading to severe heat transfer deterioration. This phenomenon, referring to as the boiling crisis, limits the application of nucleate boiling under the very-high-heat-flux conditions. Thus an increasing number of researchers have paid attention to the technologies focused on the enhancement of boiling in recent years. In 1981, a boiling phenomenon called microbubble emission boiling (MEB) was observed in the transition boiling region under highly subcooled conditions by Inada et al. (Reference Inada, Miyasaka, Izumi and Owase1981). MEB has been proved to be able to achieve a heat flux several or even ten times higher than CHF (Suzuki, Saitoh & Matsumoto Reference Suzuki, Saitoh and Matsumoto2002; Ueno, Hattori & Hosoya Reference Ueno, Hattori and Hosoya2011; Ando et al. Reference Ando, Horiuchi, Saiki, Kaneko and Ueno2016; Inada et al. Reference Inada, Shinagawa, Lllias, Sumiya and Jalaludin2016; Tang et al. Reference Tang, Mo, Sun and Yan2017; Sinha et al. Reference Sinha, Ranjan, Kumar, Qaisar Raza and Raj2020) and is a potential cooling method for devices characterized by very large heat release.
The heat transfer mechanisms of nucleate boiling and MEB are distinguishable due to the significantly different bubble behaviours. In nucleate boiling under subcooled conditions, vapour bubbles experience growth, coalescence, departure, rising and condensation (Kim & Park Reference Kim and Park2022). Lakkaraju et al. (Reference Lakkaraju, Stevens, Oresta, Verzicco, Lohse and Prosperetti2013) reported that the buoyancy of detached bubbles in nucleate boiling drove the liquid near the wall to enhance natural convection, especially under subcooled conditions. Therefore, in recent years, a series of studies have used two-phase thermal convection induced by bubbles to enhance heat transfer, especially in Rayleigh–Bénard systems where the fluid domain is heated from below and cooled from above (Guzman et al. Reference Guzman, Xie, Chen, Rivas, Sun, Lohse and Ahlers2016; Wang, Mathai & Sun Reference Wang, Mathai and Sun2019). Wang et al. (Reference Wang, Mathai and Sun2019) added a small concentration of a heavy liquid with a low boiling point into a water-based turbulent convection system and found that the biphasic species kinematics and their induced agitation could enhance heat transfer significantly. Different form nucleate boiling, no bubble departure has been observed in MEB where an oblate vapour bubble constantly attaches on the heating surface with partial collapse and volume oscillation (Tang, Yan & Sun Reference Tang, Yan and Sun2015; Tang et al. Reference Tang, Mo, Sun and Yan2017; Kobayashi et al. Reference Kobayashi, Hayashi, Kurose and Ueno2022). However, the recent studies of Tang et al. (Reference Tang, Sun, Du, Liu, Mo and Bao2019), Li et al. (Reference Li, Tang, Sun, Li, Bao and Liu2020) and Kawakami et al. (Reference Kawakami, Sakamoto, Tanigawa and Tsuruta2021) showed that the convection induced by bubble collapse and oscillation might be the avenue by which efficient heat transfer occurs in MEB. The experiments of Li et al. (Reference Li, Tang, Sun, Li, Bao and Liu2020) and Kawakami et al. (Reference Kawakami, Sakamoto, Tanigawa and Tsuruta2021) showed that restricting the space above the heating surface limited the development of near-wall convection and then inhibited the occurrence of MEB. However, adding an extra acoustic streaming to enhance the near-wall convection by ultrasound could trigger MEB in such a confined space (Li et al. Reference Li, Tang, Sun, Li, Bao and Liu2020). Ando et al. (Reference Ando, Horiuchi, Saiki, Kaneko and Ueno2016) tracked several microbubbles above the heating surface to show the near-wall liquid flow, and found that the local liquid might be drawn towards the heating surface in MEB. Ito, Natazuka & Saito (Reference Ito, Natazuka and Saito2017) also used microbubbles as tracer particles to measure the flow field and discussed the temporally averaged velocity characteristics in MEB. The tracked microbubbles formed via bubble collapse, resulting in their uneven spatial distribution in the bulk, and temporal variations in their sizes. Thus the temporal and spatial variations in the liquid flow induced by bubbles have still not been reported in detail. The characteristics of the interactions between these bubbles and the near-wall subcooled liquid, and the effect of these interactions on the heat transfer mechanism of MEB, are still open questions.
In the present study, we measure the temporal and spatial changes in the flow field outside the bubble in nucleate boiling and MEB conditions using the high-speed two-phase particle image velocimetry (PIV) method. We present the unique flow characteristics of MEB and their differences from those of nucleate boiling. Then we discuss the relationship between the bubble-induced oscillating flow and the heat transfer mechanism in MEB.
2. Experimental method
The experimental set-up involving subcooled pool boiling is shown in figure 1; the experimental set-up consisted mainly of a water tank with three visualization windows, and a copper heating block heated by five cartridge heaters (J3A111-AE12H, Watlow Inc.). The top section of the block had a circular cross-sectional area with diameter 10 mm insulated by a ceramic thimble to provide one-dimensional conduction. The upper surface of this block was taken as the heating surface. Before the experiments, the surface was conditioned with 120-, 400-, 800-, 2000- and 5000-grit sandpapers sequentially, and finally polished by 400-grit sandpaper. Then the surface was cleaned with distilled water, alcohol and distilled water alternately. The roughness of the heating surface was about 0.370  ${\mathrm {\mu }}$m, as measured with a surface roughness meter (SJ-210, Mitutoyo). Three K-type sheathed thermocouples (TJC36-CAIN-020-G, Omega), each of which was 0.5 mm in diameter, were fitted underneath the heating surface at vertical distances of 1 mm, 5 mm and 8 mm. Distilled water was used as the working fluid and was degassed for more than 1 hour before the experiments. The water temperature was controlled by two electric heaters and a copper cooler, and was measured by two thermocouples at positions located 5 mm and 50 mm vertical distances from the heating surface. The thermocouple signals were recorded with a temperature measurement module (PXIe-4353, National Instruments). The heat flux $q$ and wall temperature $T_w$ were calculated by performing least squares fitting on the measured temperature profile based on Fourier's law. The temperature uncertainty was $\pm$0.56 K, as was determined from the maximum temperature uncertainties recorded by the thermocouples ( $\pm$0.5 K) and acquisition system ( $\pm$0.25 K). Based on the error propagation method, the relative heat flux and wall temperature uncertainties were found to be 10.7 % and 2 %, respectively.

Figure 1. Schematic diagrams of the experimental apparatus and image processing method. A series of image filters (Wiener, intensity, erode and dilate filters) are used to reinforce the bubble features and remove the noises of particles. Then the original image is converted to a binary one with the Otsu method. Another original image is masked in regions of bubbles based on the binary image, and then is processed to reconstruct the PIV image using the PIVlab software. Finally, the bubble and PIV images are merged.
The bubble behaviours and liquid flow field were recorded simultaneously using the high-speed two-phase PIV technique (Maeng & Park Reference Maeng and Park2021; Kim & Park Reference Kim and Park2022). The PIV system consisted of a high-speed video camera (Photron: Fastcam AX100), a continuous-wave laser (OEM-V-532, CNI) with wavelength 532 nm, and an LED light with a long-pass optical filter (with a 680 nm cut-on wavelength). Fluorescent particles (SrAlSiN3: Eu) with diameters 1–2  ${\mathrm {\mu }}$m and density 1.1 g cm $^{-3}$ were used as tracer particles and were dispersed in water with the help of ultrasound before experiments. The exciting wavelength range of these particles was 490–550 nm, and the peak emission wavelength was 610 nm. The maximum power of the laser was 12 W to ensure the brightness of the fluorescence emitted by the particles at a camera frame rate over 10 000 fps (frames per second). The camera viewed the boiling process through a 105 mm lens with a filter (cut-off length 590 nm), and the green laser light was blocked using an optical filter and the backlight compensation results obtained in clear snapshots of the vapour bubbles and PIV particles. The PIV images were processed using the PIVlab software (Thielicke & Stamhuis Reference Thielicke and Stamhuis2014). The same particles at different times were paired using the cross-correlation algorithm based on the fast Fourier transform, and the results were applied to calculate liquid velocity using the formula $u = K\,{\rm \Delta} s/{\rm \Delta} t$. Here, $K$ is a scale factor used to convert the image units into actual values, and ${\rm \Delta} s$ and ${\rm \Delta} t$ are the particle displacement and time interval between two consecutive frames, respectively. The velocity uncertainty was determined by assessing the error propagation of the indirect measurements and the effect of the three-dimensional nature of the flow (about 5 %) (Murakami & Takakoshi Reference Murakami and Takakoshi2020). The uncertainties of $K$ and ${\rm \Delta} t$ were found to be 0.62 % and 0.5 % for the present visualization system. The ${\rm \Delta} s$ uncertainty was found to be 0.05–0.1 pixels for the PIVlab algorithm, leading to a relative uncertainty of 5 % for the minimum particle movement distance (2 pixels). Thus the maximum velocity uncertainty resulting from indirect measurements was less than 6.12 %, and the total velocity uncertainty was estimated to be no more than 12 %.
3. Results and discussion
3.1. Effect of the boiling mode on bubble-induced flow
Figures 2 and 3 show a series of snapshots exhibiting nucleate boiling and MEB at liquid subcooling  ${\rm \Delta} T_{sub}$ of 25 K (see supplementary movie 1, available at https://doi.org/10.1017/jfm.2023.285, for nucleate boiling, and supplementary movie 2 for MEB). Under low heat flux conditions during nucleate boiling ( $q = 0.32$ MW m $^{-2}$), natural convection drives the hot liquid to move upwards at velocities 0.02–0.04 m s $^{-1}$. As the heat flux increases to 1.58 MW m $^{-2}$, more nucleate sites become active, leading bubbles to merge and form large coalesced bubbles. As these coalesced bubbles grow, the buoyancy force exceeds the surface tension force gradually, resulting in the detachment of the bubbles. Following the formation of the rising bubble column, the hot liquid near the heating surface flows upwards. At a relatively high heat flux 2.53 MW m $^{-2}$, the departed bubbles enlarge and induce a more obvious wake, thus accelerating the velocity of the liquid above the heating surface from 0.1–0.16 m s $^{-1}$ to 0.4–0.5 m s $^{-1}$, as shown in figure 2. This enhanced convection above the heating surface resulting from the rising bubbles accelerates the condensation of the following bubbles, thus affecting the bubble departure diameter and frequency during nucleate boiling.

Figure 2. Bubble behaviour and the induced liquid flow during nucleate boiling: (a)  ${\rm \Delta} T_{sub} = 25$ K, $q = 0.32$ MW m $^{-2}$; (b) ${\rm \Delta} T_{sub} = 25$ K, $q = 1.58$ MW m $^{-2}$; and (c) ${\rm \Delta} T_{sub} = 25$ K, $q = 2.53$ MW m $^{-2}$. Snapshots were recorded at frame rate 10 kfps.

Figure 3. Bubble behaviours and the bubble-induced liquid flow conditions in MEB ( ${\rm \Delta} T_{sub} = 25$ K, $q = 3.80$ MW m $^{-2}$): (a) volume oscillation, (b) collapse on bubble periphery, (c) collapse on bubble top, (d) violent surface wave. Snapshots were recorded at frame rate 10 kfps.
Four typical bubble behaviours observed alternately in MEB were reported in previous studies (Suzuki et al. Reference Suzuki, Saitoh and Matsumoto2002; Tang et al. Reference Tang, Mo, Sun and Yan2017; Kobayashi et al. Reference Kobayashi, Hayashi, Kurose and Ueno2022), i.e. bubble volume oscillations, bubble periphery collapses, bubble-top collapses and violent bubble surface waves. Bubble oscillations have been reported to be the dominating behaviour in MEB; during this process, the bubble expands and shrinks rapidly due to the competition between the evaporation and condensation across the vapour–liquid interface. Both the magnitude and direction of the liquid velocity near the vapour bubble change considerably, as shown in figure 3(a). Driven by the expansion of the vapour bubble, the surrounding liquid is pushed away from the heating surface. Afterwards, the surrounding liquid flows back towards the heating surface when the bubble begins to shrink. In this process, the maximum liquid velocity first increases from 0.05 m s $^{-1}$ to 0.3 m s $^{-1}$, and then decreases to 0.05 m s $^{-1}$. Partial collapse on the periphery of a vapour bubble can be seen in figure 3(b). After a brief period of shrinkage, the bubble suddenly collapses on its right edge. The liquid above the bubble then flows to the right periphery of the heating surface at velocity 0.3 m s $^{-1}$. Then a local liquid jet forms towards the heating surface accompanied by the emission of microbubbles, as was speculated in a previous study by Tang et al. (Reference Tang, Sun, Du, Liu, Mo and Bao2019). A similar phenomenon is observed during the bubble-top collapse, as shown in figure 3(c). As the bubble condenses, intense liquid flow follows the inward-collapsing bubble top towards the heating surface. Unfortunately, due to the blocking of the bubble surface, no high-velocity region near the wall was observed in the present experiments. However, the presence of this region could be forecasted based on the liquid flow conditions near the bubble attached on the heating surface. Notably, between the bubble-top collapse and the subsequent emission of microbubbles, the direction of the near-wall flow changes abruptly, and this process is always observed during the impact of the liquid jet on a solid wall. The above visualization results imply the promoted supply of liquid into the heating surface following CHF via the bubble collapse and oscillation. Regarding the final behaviour, surface waves form on the bubble and cover the heating surface without exhibiting volume oscillation or partial collapse. The velocity of the near-bubble liquid is reduced to below 0.15 m s $^{-1}$, as shown in figure 3(d).
3.2. Characteristics of the liquid flow outside the bubbles
Figure 4(a) shows the variations in the vertical and horizontal components of the liquid velocity over time. Positive values indicate that the liquid flows upwards and rightwards, while negative values indicate movement in the opposite directions. We note that a constantly rising flow forms above the heating surface during nucleate boiling. However, the frequently observed bubble oscillations generate an oscillating flow near the heating surface in MEB. The maximum liquid motion velocities can reach 0.3 m s $^{-1}$ and 0.6 m s $^{-1}$ in the vertical and horizontal directions, respectively. Figure 4(b) shows the oscillation frequency of the liquid velocity in MEB, defined as the reciprocal value of the averaged time interval between two successive positive peaks. The measurement point is 3 mm above the centre of the heating surface. More than 180 periods were counted in 500–1000 ms and used to calculate the averaged frequency. As the heat flux increases or liquid subcooling decreases, the oscillation frequency of the liquid velocity increases. This oscillation frequency has a strong relationship with the oscillation behaviour of the vapour bubbles. Figure 4(c) compares the variations in the bubble surface height $H$ in the central heating surface line with the liquid velocity directly above the bubbles. The bubble boundary was recognized using an image-processing procedure programmed by MATLAB (Tang et al. Reference Tang, Yan and Sun2015). The oscillations of both the bubble boundary and liquid velocity appear to be quasi-periodic. During the bubble expansion period, the vertical liquid velocity above the bubble generally first increases and then decreases. Then, as the bubble shrinks, the direction of liquid flow reverses and its magnitude first increases and then decreases. The previous study of Tang et al. (Reference Tang, Sun, Du, Liu, Mo and Bao2019) showed that the bubble oscillation behaviour in MEB might be the result of the intermittent re-wetting and drying of a liquid layer formed beneath the bubble and of the competition between the condensation and evaporation mechanisms across this interfacial surface. Considering the mass balance of the bubble, one obtains $\rho _v \, {\rm d}V_b/{\rm d}t = m_e - h_c S_c\,{\rm \Delta} T_{sub}/ h_{fg}$. Here, $m_e$ is the evaporation rate, and $h_c$ is the condensation heat transfer coefficient. Due to the unknown development of the vapour–liquid distribution underneath the bubble, $m_e$ cannot be calculated directly in MEB, but this value is reduced considerably during the bubble shrinkage process arising from the dry-out of the heating surface, according to the study of Ono & Sakashita (Reference Ono and Sakashita2009). Therefore, at a relatively high heat flux, the expansion rate is increased due to the increased evaporation rate, leading to enhanced convection around the bubble and accelerating its condensation at the shrinkage stage. This leads to the enlarged oscillation frequencies of the vapour bubble and the increased velocities of the surrounding liquid, as shown in figure 4(b). The experimental results of Ono & Sakashita (Reference Ono and Sakashita2009) showed that in subcooled pool boiling, the thickness of the liquid layer formed beneath the bubble decreases with a heat flux increase, but increases with an increase in liquid subcooling. Thus we suspect that as subcooling increases, a thicker liquid layer can retain the bubble expansion process over a longer period. Although the bubble shrinkage process may be accelerated initially under higher subcooling conditions, the thermal boundary layer around the bubble thickens, and the contact area between the vapour and liquid continues to decrease, thus slowing the shrinkage rate. As a result, the bubble oscillation period increases with increasing liquid subcooling, leading to a reduction in the liquid velocity oscillation frequency, as shown in figure 4(b).

Figure 4. (a) Liquid flow velocity near the heating surface versus time at different measurement points. Nucleate boiling (NB):  ${\rm \Delta} T_{sub} = 25$ K, $q = 2.53$ MW m $^{-2}$. MEB: ${\rm \Delta} T_{sub} = 25$ K, $q = 4.65$ MW m $^{-2}$. (b) Oscillation frequency of liquid velocity in MEB. The measurement point is 3 mm above the centre of the heating surface. More than 180 periods were counted to calculate the averaged frequency. (c) Comparison of bubble surface heights and above-bubble liquid flow velocity variations ( ${\rm \Delta} T_{sub} = 25$ K, $q = 4.65$ MW m $^{-2}$). $t_0$ is the time of the first frame used to measure bubble height and liquid velocity.
In figure 5, we examine the spatial variations in the temporally averaged vertical and horizontal components of the transient liquid velocity and their standard deviations under different subcooling and heat flux conditions. The horizontal component was measured on a horizontal line approximately 1.5 mm above the heating surface. The temporally averaged liquid velocity near the heating surface is not zero. For the horizontal liquid velocity, the average value is positive. However, it is worth noting that the vertical velocity above the heating surface takes a negative valve under low subcooling conditions, but a positive one under high subcooling conditions, indicating that the liquid flow field near the heating surface in MEB represents a superimposition of a steady normal flow and the oscillating flow induced by the bubble oscillation behaviour. The steady flow is very likely the natural convection state resulting from the temperature difference above the vapour bubble. The standard deviation provides an estimation of the oscillating flow, which is five times larger than the temporally averaged velocity near the bubble, showing the dominant role of this oscillating flow. Although  $Std_{vy}$ and $Std_{vx}$ vary with different trends, both decrease with a decay relation of approximately $y^{-2}$ or $x^{-2}$ under different subcooling and heat flux conditions, as shown in figures 5(c,d). Inconsistencies among different directions may result from the non-spherical oscillation of the bubbles above the heating surface and the different effects of natural convection. The visualization results of Li et al. (Reference Li, Tang, Hu, Sun and Bao2022) showed that the bubble width was about four times the bubble height in MEB. As the heat flux increases, the bubble expansion and shrinkage rates become larger due to the increased evaporation rate and enhanced condensation resulting from the strengthened convection; therefore, the velocity fluctuation increases accordingly. As subcooling increases, the bubble expansion process is delayed by the enhanced condensation conditions, and this reduction in the bubble shrinkage rate may be attributable to the thickening of the thermal boundary layer and the weakened convection around the bubble, leading to a decreased velocity fluctuation.

Figure 5. Variation in the averaged liquid velocity and its standard deviation near the heating surface in MEB: (a) averaged vertical velocity components at different vertical measurement points; (b) averaged horizontal velocity component at different horizontal measurement points; (c) standard deviation of the horizontal velocity component, shown as a solid line  $/Std_{vy}\propto y^{-2}$; and (d) standard deviation of the vertical velocity component, shown as a solid line $/Std_{vx}\propto x^{-2}$.
The average vertical and horizontal velocities also show inconsistent trends with either the subcooling or heat flux conditions, as shown in figures 5(a,b). Under low subcooling conditions, a relatively small temperature difference around the bubble results in relatively weak upward natural convection. The averaged vertical velocity above the heating surface is negative, implying that the oscillation behaviour of the bubble generates a circulating flow from the periphery to the centre, especially in the region close to the bubble. This circulating flow may be a key phenomenon for the highly efficient heat transport in MEB. With an increase in the subcooling, the upward natural convection is enhanced but the oscillation-induced downward liquid flow is weakened, making the averaged velocities under these two different sets of conditions comparable. The competing effects lead to a reversal in the averaged liquid flow direction above the bubble from downwards to upwards when the liquid subcooling increases from 25 K to 40 K. As the distance to the heating surface increases, both the oscillating flow and natural convection decelerate in the vertical direction, and the negative vertical velocity gradually increases to approach zero. Under fixed subcooling conditions, the circulating flow induced by these oscillations is intensified by increasing the heat flux. This process leads to an increase and a decrease in the magnitudes of the averaged vertical velocity at subcooling of 25 and 40 K, respectively. The effect of natural convection on the horizontal direction mean velocity distribution is not obvious compared to that in the vertical direction. The different variation trends of  $v_{x,ave}$ with $q$ and ${\rm \Delta} T_{sub}$ are caused mainly by the bubble oscillations. The recent results of Kobayashi et al. (Reference Kobayashi, Hayashi, Kurose and Ueno2022) showed that the bubble oscillated more homogeneously in time and space with the increase in heat flux in MEB. The present PIV results agree with this observation: increasing the heat flux leads to a smaller $v_{x,ave}$.
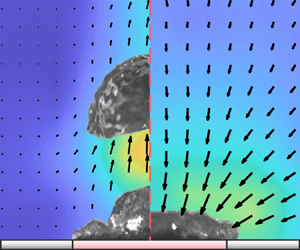
Figure 6 shows the contours of the temporally averaged velocity magnitude outside the bubble. In nucleate boiling, a plume liquid velocity distribution forms above the heating surface due to the natural convection induced by the temperature difference and the flow induced by the growth and rising of the bubble. In MEB, the velocity distribution appears to be more asymmetrical due to the non-uniform oscillation of the bubble attached to the heating surface. Such spatially non-uniform behaviours have been discussed in previous studies (Tang et al. Reference Tang, Mo, Sun and Yan2017; Kobayashi et al. Reference Kobayashi, Hayashi, Kurose and Ueno2022). In the subcooling and heat flux conditions tested herein, the results of which are shown in figures 6(c–f), the high-speed region around the heating surface is approximately a hemisphere. As the heat flux increases or the subcooling decreases, the affected area of this high-speed region roughly expands. Obviously, the liquid convection on the periphery of the heating surface is enhanced, and the affected area in the horizontal direction is extended in MEB compared to that in nucleate boiling. The oscillatory flow induced by the non-uniform bubble oscillations in MEB promotes the delivery of heat from the vapour bubble to the cold bulk, allowing the local subcooling near the heating surface to be maintained. This may help to stabilize the heat transfer in MEB since the occurrence of MEB is inhibited after subcooling decreases to below 20 K (Suzuki et al. Reference Suzuki, Saitoh and Matsumoto2002; Ando et al. Reference Ando, Horiuchi, Saiki, Kaneko and Ueno2016; Inada et al. Reference Inada, Shinagawa, Lllias, Sumiya and Jalaludin2016; Tang et al. Reference Tang, Mo, Sun and Yan2017).

Figure 6. Contours of the averaged liquid velocity magnitudes near the heating surface in (a,b) nucleate boiling (NB), and (c–f) MEB. The averaged flow and vapour fraction fields are calculated by averaging over 1000 sets of transient PIV data and snapshots. The matrices of a series of binary images were averaged to calculate the vapour fraction probability field. In the binary images, the vapour and liquid regions were marked with 1 and 0, respectively.
3.3. Dependence of heat transfer on bubble-induced flow in MEB
To reveal the intensity of the convection induced by the bubble oscillations in MEB, we estimate the ensemble-averaged liquid velocity near the heating surface. We approximate the liquid flow outside the bubble as radially expanding flow with a semicircular affected area based on the PIV results. Due to the shadows of the bubbles in the PIV images, the radial velocity  $v_r$ is averaged spatially and temporally using the PIV data collected in the right quarter of the affected area. The variations in the spatial radial velocity average $v_{r,ave}$ under different subcooling and heat flux conditions are shown in figure 7. Similar to the liquid velocity variations observed at different vertical and horizontal positions in figure 4(a), the spatial distribution of the averaged radial velocity appears to be quasi-periodic. To characterize further the oscillating flow conditions outside the bubble, we further averaged the magnitude of radial velocity temporally as follows. However, due to the inherent decrease of radial velocity in space, this average value, $\langle |v_{r,ave}| \rangle$, decreases as the radius of the semicircular area, $R_{0}$, increases, and this relationship is used to calculate the spatially averaged velocity, as shown in figure 8. The term $\langle |v_{r,ave}| \rangle$ is biased towards the values measured farther away from the bubble, where large $R_{0}$ values occur. Another averaged velocity, $v_c$, is obtained by considering the $1/r^2$ relation of the liquid velocity distribution outside the bubble, and this term is defined as the product of the temporally and spatially averaged $v_r/r^2$ values, and the spatially averaged $r^2$, $v_c = \langle | v_r/r^2 |_{ave} \rangle \langle r^2 \rangle$. As shown in figure 8, $v_{c}$ does not change obviously with $R_0$. The dependence characteristics of $v_c$ at $R_0 =14$ mm on the liquid subcooling and heat flux are presented in figure 9. This characteristic radial velocity increases with an increase in the heat flux and a decrease in the subcooling. Similar to the variations in the oscillation frequency, the variations in $v_c$ are related to the expansion and shrinkage behaviours of the bubble. As $q$ increases, evaporation is enhanced at the bubble root, so the bubble expansion process is accelerated and the liquid velocity fluctuation at the expansion stage increases accordingly, as shown in figure 7. Thereafter, it is suspected that the enhanced near-bubble convection promotes condensation across the vapour–liquid interface, thus accelerating the bubble shrinkage rate and the shrinkage-stage velocity fluctuation. An increasing heat flux is likely to induce a positive feedback effect, thus reinforcing the bubble oscillation behaviour and enhancing the heat transfer. This finding may be one of the reasons why the heat transfer is not deteriorated when the heat flux is constantly increased, even up to 10 MW m $^{-2}$, in MEB. As ${\rm \Delta} T_{sub}$ increases, the enhanced condensation across the bubble surface decelerates the bubble expansion rate, and thereby the liquid velocity around the bubble decreases at this stage. During the bubble shrinkage process, the thicker thermal boundary layer and the weakened near-bubble convection may result in a reduced bubble variation rate and reduced liquid velocity fluctuations. The above results imply that both the oscillating velocity and liquid subcooling are important for the heat transport process from the heating surface to the cold bulk through the bubble in MEB.

Figure 7. Variations in the spatially averaged  $v_{r}$ values under different subcooling and heat flux conditions. The radius of the semicircular affected area is 14 mm.

Figure 8. Comparison of  $\langle |v_{r,ave}| \rangle$ and $\langle | v_{r,ave}/r^2 | \rangle \langle r^2 \rangle$ at liquid subcooling 40 K and heat flux 3.13 MW m $^{-2}$. Here, $R_{0}$ is the radius of the quarter-circle region outside the bubble used to estimate the spatially averaged radial velocity. A total of 3000–5000 samples were used to calculate the temporally averaged values.

Figure 9. Effects of the liquid subcooling and heat flux on the spatially and temporally averaged radial velocity  $v_c$ in a quarter-circle region with radius $R_0=14$ mm. For clarity, error bars are not shown in this figure.
The heat transfer mechanism of MEB has remained elusive until now. Some previous studies implied that macro-convection, quenching and transient conduction played roles in the heat transfer mechanism of MEB. However, these mechanisms do not work well when modelling the heat transfer of MEB due to the complex bubble dynamics and the insufficient understanding of the dry-out process. Regardless of how heat is transported from the heating surface to the bubble, it must be dissipated into the cold bulk rapidly to maintain the local subcooling near the heating surface and avoid MEB failure. Therefore, from a relatively long-term energy balance perspective, the heat transfer of MEB can be estimated using the heat dissipated by convection near the bubble. Based on the vapour fraction distribution shown in figure 6 and the experimental results of (Li et al. Reference Li, Tang, Hu, Sun and Bao2022), the averaged bubble size is slightly dependent on the subcooling and heat flux, and may be related to the size of the heating surface. Thus we assume that the heat flux in MEB is proportional to the liquid-side heat flux of the condensing bubble,  $q_c$. When the convection enhanced by the bubble oscillations dominates, $q_c$ can be calculated as
 \begin{equation} q_c=Nu_c\,\lambda_l\,\frac{{\rm \Delta} T_{sub}}{D}, \end{equation}
where  $Nu_c=h_cD/\lambda _l$ is the condensation Nusselt number, and $D$ is the equivalent bubble diameter. Here, $Nu_c$ is generally scaled with the Péclet number, Reynolds number, Jacob number and Prandtl number based on experimental results. The heat transfer of a pulsating vapour bubble was investigated by Hao & Prosperetti (Reference Hao and Prosperetti2002) using the correlation derived by Ruckenstein (Reference Ruckenstein1959) as $Nu_c\propto Pe^{0.5}$. Here, $Pe = U_bD/\alpha _l$ is the Péclet number, $U_b$ is the relative velocity of the bubble, and $\alpha _l$ is the liquid thermal diffusivity. This correlation and (3.1) allow us to estimate the convection heat flux outside an oscillating bubble with $q_c\propto (\alpha _l\rho _vh_{fg}/D)\,Pe^{0.5}\,Ja$. Here, $Ja = \alpha _l c_{pl}\,{\rm \Delta} T_{sub}/\rho _vh_{fg}$ is the Jacob number, $h_{fg}$ is the latent heat, and $\rho _l$, $c_{pl}$ and $\rho _v$ are the liquid density, specific heat and vapour density, respectively. However, the relationship $Nu_c\propto Pe^{0.5}$ may be applicable only under low subcooling conditions. Previous studies showed that $Nu_c$ was inversely proportional to the Jacob number due to the thickening of the thermal boundary layer around the condensing bubble with increasing subcooling (Warrier, Vijay & Dhir Reference Warrier, Vijay and Dhir2002; Lucic & Mayinger Reference Lucic and Mayinger2010; Tang et al. Reference Tang, Sun, Liu, Liu and Mo2022). Thus, to consider this effect, we re-establish the scaling law by fitting the experimental data of MEB with a $Ja$ exponent less than 1 to obtain the equation
 \begin{equation} \frac{q}{\alpha_l\rho_vh_{fg}/D_h} = A\,Pe_m^{19/20}\,Ja^{2/3}, \end{equation}
where  $A = 2.73$ is a dimensionless constant. Here, $Pe_m$ is the modified Péclet number using the heating surface diameter and $v_c$ as the characteristic length and velocity when considering the effect of the oscillating flow. In general, $Nu_c$ is negatively correlated with $Ja$ within the exponent range $-$0.2 to $-$0.4 for bubble condensation (Tang et al. Reference Tang, Sun, Liu, Liu and Mo2022). Thus the $Ja$ exponent ranges from 0.6 to 0.8 in the heat flux correlations considered herein. Regarding Péclet or Reynolds numbers, the exponents vary from 0.5 to 0.96 under different correlation conditions. In (3.2), the exponents of $Ja$ and $Pe_m$ fall within the above ranges. The prediction curve of (3.2) is shown in figure 10; the curve agrees with the experimental data, indicating that the heat transfer of MEB depends strongly on the oscillating flow induced by the bubble oscillations.

Figure 10. Plot of  $q/(\alpha _l\rho _vh_{fg}/D_h)$ as a function of $Pe^{19/20}_{m}\,Ja^{2/3}$ under different subcooling and heat flux conditions in MEB. The experimental results (symbols) suggest that $q/(\alpha _l\rho _vh_{fg}/D_h) = 2.73\,Pe_m^{19/20}\,Ja^{2/3}$ (as shown by the dashed line).
4. Conclusion
In conclusion, here, we reported synchronous measurements of bubble behaviours and temporal liquid flow variations outside the bubble during nucleate boiling and microbubble emission boiling (MEB) using the high-speed two-phase PIV method. We found that, in contrast to nucleate boiling, the liquid flow near the heating surface is composed of natural convection and oscillating flow induced by the bubble oscillations in MEB. We also observed that the liquid convection at the bubble top and at the edge of the heating surface is enhanced considerably in MEB, and the area affected by this convention is approximated to be nearly hemispherical. The oscillating flow in MEB offers a heat transport process into the cold bulk that differs from that of nucleate boiling. Here, we developed a scaling law for the heat transfer of MEB as a function of Péclet and Jacob numbers based on the PIV results. The present results suggest that the bubble-induced oscillating flow plays a crucial role in the heat transfer of MEB.
Supplementary movies
Supplementary movies are available at https://doi.org/10.1017/jfm.2023.285.
Funding
This work given financial support by the National Natural Science Foundation of China (grant nos 52076144, 12075160 and 51706149) and the Sichuan Science and Technology Program (grant no. 2021YJ0374).
Declaration of interests
The authors report no conflict of interest.


