


INTRODUCTION
In 2011, the National Institute on Aging (NIA) and the Alzheimer’s Association (AA) tasked workgroups with reviewing clinical and research criteria for the diagnosis of Alzheimer’s disease (AD) to update these criteria using knowledge from the latest scientific advances in the field (Jack et al., Reference Jack, Albert, Knopman, McKhann, Sperling, Carrillo and Phelps2011). Workgroups were tasked with reevaluating diagnostic criteria for various stages in the progression toward dementia: (a) an asymptomatic phase (“preclinical AD”); (b) a symptomatic, pre-dementia phase, also known as mild cognitive impairment (MCI; Petersen, Reference Petersen2004); and (c) a dementia phase, or AD. In addition to the recognition of these phases, recommended criteria also included assessment of biomarkers of underlying AD pathophysiological processes and expected clinical syndromes.
This clinical-pathological distinction, which was not made in original diagnostic criteria established in 1984 (McKhann et al., Reference McKhann, Drachman, Folstein, Katzman, Price and Stadlan1984), reflects the fact that AD pathophysiology may be present without any clear clinical symptoms (e.g., Davis, Schmitt, Wekstein, & Markesbery, Reference Davis, Schmitt, Wekstein and Markesbery1999; Hulette et al., Reference Hulette, Welsh-Bohmer, Murray, Saunders, Mash and McIntyre1998; Price & Morris, Reference Price and Morris1999), or with atypical presentations, such as visual impairments (Tang-Wai et al., Reference Tang-Wai, Graff-Radford, Boeve, Dickson, Parisi, Crook and Petersen2004) or loss of language function (Rabinovici et al., Reference Rabinovici, Jagust, Furst, Ogar, Racine, Mormino and Miller2008). It also accounts for development of AD pathology over time and gradual decline in thinking skills, which occurs before significant functional impairment during the MCI phase. Proposed staging schemes for diagnosing MCI (Albert et al., Reference Albert, DeKosky, Dickson, Dubois, Feldman, Fox and Petersen2011) and the preceding stage of preclinical AD (Sperling et al., Reference Sperling, Aisen, Beckett, Bennett, Craft, Fagan and Montine2011) aim to capture the spectrum of cognitive decline from normal cognition to AD dementia.
The proposed schemes for the diagnosis of MCI due to AD incorporate the evaluation of the onset and progression of biomarkers, presumed to follow a chronological order, following the amyloid cascade hypothesis (Jack et al., Reference Jack, Albert, Knopman, McKhann, Sperling, Carrillo and Phelps2011). Biomarkers implicated include those reflecting the retention of amyloid-beta (Aβ) in the brain, the accumulation and phosphorylation of tau protein, and the presence of neuronal degeneration (i.e., brain atrophy, hypoperfusion, or hypometabolism, following topographic patterns and sequential temporal involvement). According to NIA-AA proposed staging of preclinical AD, individuals may progress from having asymptomatic amyloidosis (Stage 1) to amyloidosis and neurodegeneration (Stage 2) to amyloidosis, neurodegeneration, and subtle cognitive decline (Stage 3; Sperling et al., Reference Sperling, Aisen, Beckett, Bennett, Craft, Fagan and Montine2011).
However, there is frequent heterogeneity of brain pathology in the elderly, and the order of appearance of these biomarkers has been disputed. Edmonds, Delano-Wood, Galasko, Salmon, and Bondi (Reference Edmonds, Delano-Wood, Galasko, Salmon and Bondi2015) examined the number and sequence of biomarker abnormalities in cognitively normal participants and found that individuals did not conform to the temporal sequence of NIA-AA criteria. Additionally, they noted that neurodegeneration alone was 2.5 times more common than amyloidosis alone, despite amyloidosis being proposed as the initiating event in the pathophysiological cascade (Jack et al., Reference Jack, Albert, Knopman, McKhann, Sperling, Carrillo and Phelps2011; Sperling et al., Reference Sperling, Aisen, Beckett, Bennett, Craft, Fagan and Montine2011).
To more adequately capture the diversity in the timing, amount, and presentation of symptoms, researchers have more recently proposed a biomarker classification scheme independent of temporal sequence (Jack, Bennett, et al., Reference Jack, Bennett, Blennow, Carrillo, Feldman, Frisoni and Dubois2016; Jack, Bennett, et al., Reference Jack, Bennett, Blennow, Carrillo, Dunn and Elliott2017). Proposed 2018 research diagnostic criteria focus on biomarker profiles rather than the concept of disease staging by dividing the major biomarkers into three binary categories: “A”, the Aβ biomarker; “T”, the tau biomarker; and “N”, the biomarkers of neurodegeneration or neuronal injury (Jack, Bennett, et al., Reference Jack, Bennett, Blennow, Carrillo, Dunn and Elliott2017). According to this classification scheme, each biomarker may be positive or negative for any given individual, e.g. A+/T+/N+ or A+/T-/N-, etc. This scheme has the benefit of incorporating recently developed measurements, such as tau PET, which is not included in prior AD diagnostic schemes. It also does not link biomarkers with cognitive impairment, as in the NIA-AA stages earlier described.
This is useful given that the relative contributions of different biomarkers in the progression of clinical syndromes are unclear (Hampel et al., Reference Hampel, Frank, Broich, Teipel, Katz, Hardy and Hoessler2010). The present study sought to elucidate how the Aβ and Ptau biomarkers of AD differ in their pattern of cognitive decline in a sample of cognitively healthy (i.e., preclinical) older adults, given the presence or absence of either or both biomarkers. Although the preclinical phase of disease is, by definition, conceptualized as one in which cognition is normal, mounting evidence suggests that subtle cognitive changes may be detectable on neuropsychological testing. Furthermore, these changes may not be exclusive to the most advanced preclinical phase (Stage 3), as conceptualized by the NIA-AA working group criteria (Han, Nguyen, Stricker, & Nation, Reference Han, Nguyen, Stricker and Nation2017), but may in fact occur during the earliest phases (Stages 0–2). Few studies to date have conducted comprehensive neuropsychological analysis of preclinical AD using longitudinal design to better characterize the earliest cognitive changes linked to cerebral amyloidosis, tau-mediated neurodegeneration, and their combination.
METHODS
Participants
Data were obtained from the Alzheimer’s Disease Neuroimaging Initiative (ADNI) database (adni.loni.usc.edu). The primary goal of ADNI is to test whether biological markers, neuroimaging, and neuropsychological assessment can be combined to assess the progression of MCI and early Alzheimer’s disease. ADNI is the result of efforts of co-investigators from academic institutions and private corporations. Participants have been recruited from more than 50 sites across the United States and Canada via newsletters, online communication, mail, and press releases. Inclusion criteria include: age 55 to 91 years, permitted medications stable for 4 weeks, study partner who can accompany participant to visits, Geriatric Depression Scale less than 6, Hachinski Ischemic Score less than or equal to 4, adequate visual and auditory acuity, good general health, six grades of education or work history equivalent, and ability to speak English or Spanish fluently. Exclusion criteria for cognitively normal and MCI participants include any significant neurologic disease or history of significant head trauma.
Ethics approval was obtained for each institution involved. This study was conducted according to Good Clinical Practice guidelines, the Declaration of Helsinki, US 21CFR Part 50- Protection of Human Subjects, and Part 56- Institutional Review Boards, and pursuant to state and federal HIPAA regulations. Institutional Review Boards were constituted following State and Federal requirements at each participating location. Study protocols were submitted to appropriate Boards and their written unconditional approval was obtained and submitted to Regulatory Affairs at the ADNI Coordinating Center before the start of the study. All participants and/or authorized representatives and study partners provided written informed consent for the study before protocol-specific procedures. For more information, see www.adni-info.org.
Nine hundred thirty-two nondemented older adults enrolled in ADNI-1, ADNI-Grand Opportunity, and ADNI-2 underwent baseline lumbar puncture and follow-up cognitive exams. Participants were classified as either cognitively normal or MCI at screening evaluation. Criteria for ADNI diagnoses of MCI were (1) subjective memory complaint reported by the participant or informant; (2) Mini-Mental State Examination scores between 24 and 30 (inclusive); (3) global Clinical Dementia Rating score of 0.5; (4) scoring below education-adjusted cutoffs for delayed free recall on story A of the Wechsler Memory Scale-Revised (WMS-R) Logical Memory II subtest; (5) general cognition and functional performance preserved to the extent that one would not qualify for a diagnosis of Alzheimer’s disease (Petersen et al., Reference Petersen, Aisen, Beckett, Donohue, Gamst, Harvey and Weiner2010). Given that this scheme for diagnosing MCI is biased by certain cognitive domains, we did not exclude participants with these ADNI-assigned diagnoses as we did not want to make any assumptions regarding the sequence of biomarker events and cognitive changes.
In contrast to conventional criteria used as part of the ADNI study procedures (described above), the Jak/Bondi neuropsychological criteria define impairment as below −1 SD as opposed to −1.5 or −2 SDs (improving sensitivity), require two impaired scores within a cognitive domain, as opposed to a single impaired test score (improving reliability), and include assessment of instrumental activities of daily living (Jak et al., Reference Jak, Urban, McCauley, Bangen, Delano-Wood, Corey-Bloom and Bondi2009). These more robust, non-biased neuropsychological criteria for MCI have shown superior stability with reduced false positive and false negative rates relative to conventional criteria (Bondi et al., Reference Bondi, Edmonds, Jak, Clark, Delano-Wood, McDonald and Galasko2014; Edmonds et al., Reference Edmonds, Delano-Wood, Galasko, Salmon and Bondi2015). Thus, the final sample of 518 participants were identified as cognitively normal after participants were excluded if they had MCI based on Jak/Bondi neuropsychological criteria (n=414).
Measures
Physiological, clinical, and genetic data
Physiological measures included seated brachial artery systolic and diastolic blood pressures. Body mass index (BMI) was calculated as weight (kg) divided by height (meters) squared. Blood samples were used to determine apolipoprotein E (APOE)-ε4 carrier status. Participants were categorized into those with or without one or more copies of the APOE-ε4 allele.
Vascular Risk Factors
Vascular risk factor burden was obtained from medical history and physical exam at baseline and screening using criteria adapted from the Framingham Coronary Risk Profile (Wilson et al., Reference Wilson, D’Agostino, Levy, Belanger, Silbershatz and Kannel1998) as well as the Framingham Stroke Risk Profile (Wolf, D’Agostino, Belanger, & Kannel, Reference Wolf, D’Agostino, Belanger and Kannel1991). Vascular risk factors included: cardiovascular disease (myocardial infarction, intermittent claudication, angina, heart failure, or other evidence of coronary disease), dyslipidemia (low levels of high-density lipoprotein cholesterol, high levels of low-density lipoprotein cholesterol, or hypertriglyceridemia), type 2 diabetes, atrial fibrillation, evidence of carotid artery disease, and transient ischemic attack or minor stroke.
Neuropsychological data
Cognitive measures included: (1) Rey Auditory Verbal Learning Test (RAVLT): total immediate recall score over Trials 1–5, delayed recall score, recognition score; (2) Trail Making Test: parts A and B, completion times; (3) Animal Fluency: total score, (4) Vegetable fluency: total score, (5) Boston Naming Test (BNT): total score; (6) Digit Symbol: total score.
Biomarker group assessment
Aβ1-42 and Ptau were measured in CSF aliquots following a Roche Study protocol at the UPenn/ADNI Biomarker Laboratory. Preliminary kit manufacturer’s instructions were followed, as detailed in other studies (Bittner et al., Reference Bittner, Zetterberg, Teunissen, Ostlund, Militello, Andreasson and Eichenlaub2016; Shaw et al., Reference Shaw, Fields, Korecka, Waligórska, Trojanowski, Allegranza and Rabe2016). Briefly, aliquots were analyzed on a fully automated Elecsys cobas e601 instrument by the electrochemiluminescence immunoassays (ECLIA) Elecsys β-amyloid(1-42) CSF and Elecsys Phospho-Tau (181P) CSF. The analyte measuring ranges (lower to upper technical limits) were 20 to 1700 pg/mL for Aβ1-42 and 8 to 120 pg/mL for p-tau181p. Participants were characterized as amyloid negative (i.e., unlikely AD) at values of Aβ1-42 of 964 pg/mL and above, and amyloid positive (i.e., likely AD) at values below this threshold. They were characterized as Ptau negative (i.e., unlikely AD) at values of p-tau181p of 23.2 and below, and Ptau positive (i.e., likely AD) at values above this threshold, following guidelines discussed elsewhere (Seibyl et al., Reference Seibyl, Shaw, Blennow, Widmann, Corradini, Wahl and Hansson2017).
Participants categorized into one of four groups: those who were negative on both biomarkers (Aβ-Ptau-), those who were positive on both biomarkers (Aβ+Ptau+), those who were amyloid positive only (Aβ+Ptau-) and those were Ptau positive only (Aβ-Ptau+).
Analysis
Baseline cross-sectional analyses compared physiological, demographic, and clinical data among the four biomarker groups using one-way analyses of variance for continuous variables and chi-square tests for nominal variables. Post hoc least significant difference (LSD) tests and post hoc chi square tests were used in the case of significant effects. Neuropsychological performance at baseline was compared using analyses of covariance with post hoc LSD tests, controlling for age, sex, education, APOE-ε4 carrier status, and BMI. Participants were compared on major cognitive domains impacted during the predementia phase of Alzheimer’s disease, including attention/executive function (Trail Making Test A, Trail Making Test B), memory (RAVLT), language (Animal Fluency, Vegetable Fluency, BNT), and processing speed (Digit Symbol). Trail Making Test A, Trail Making Test B, and BNT scores were highly skewed and kurtotic, which was corrected by log-transformation. Scores on the BNT also had a subset of outliers (n=22 were >3 SDs below the mean) which appeared to drive the pattern of decline in initial analyses; hence, these analyses were re-run with this group excluded.
Longitudinal analyses compared the pattern of neuropsychological decline among the four biomarker profiles using multilevel model analyses with compound symmetric covariance structure and restricted maximum likelihood estimation. Four time points were included in the model (baseline and three annual follow-up visits). Time was entered as a random effect. Group, time×group, age, sex, education, APOE-ε4 carrier status, and BMI were entered as fixed factors. Participants were clustered by site to account for varying biases in recruitment. All tests were two-tailed with significance set at p<.05. Given that this was an exploratory study, we did not apply multiple comparison corrections. Analyses were two-tailed with alpha set at p<.05. All analyses were performed with SPSS for Mac OS X version 21.0 (SPSS, Armonk, NY: IBM Corp) and SAS software, version 9.4 (SAS Institute Inc, Cary, NC). Analyses conducted using Aβ1-42 and Ptau as continuous variables yielded the same pattern of results. Only the blocked group analyses are presented here, given their utility in characterizing various cognitive trajectories linked to specific biomarker profiles that may be of value in preclinical diagnostic assessments.
RESULTS
Physiological, Clinical, and Genetic Data
As shown in Table 1, there were significant group differences on age, APOE e4 carrier status (both p’s<.001), BMI scores (p=.008), and diastolic blood pressure (p=.003). The Aβ-Ptau- group was younger (p’s<.05) compared to all other groups. The Aβ+Ptau+ group had lower BMI scores (all p’s<.05) as well as a higher percentage of APOE-e4 carriers compared to all other groups (all p’s<.01). The Aβ+Ptau- group had more APOE-e4 carriers than the Aβ-Ptau- and Aβ-Ptau+ groups (both p’s<.01). The Aβ-Ptau+ group had lower diastolic blood pressure compared to all other groups (all p’s<.01). There were no group differences on vascular risk burden.
Table 1 Clinical and demographic data

Data are summarized as mean (standard deviation), unless otherwise indicated. Significant differences (p<.05) among medication groups are indicated in boldface type.
APOE=apolipoprotein E; BMI=body mass index; BP=blood pressure.
Neuropsychological Data
As shown in Table 2, there were significant differences at baseline among the biomarker groups on performance on RAVLT Immediate Recall, Trail Making Test B, and Digit Symbol. As shown in Figures 1, 2, 3, 4, and 5, over a 3-year follow-up period, there were significant differences in rates of decline among the groups on RAVLT Immediate Recall, F(3,680)=4.26, p=.005, RAVLT Delayed Recall, F(3,680)=4.15, p=.006, RAVLT Recognition, F(3,680)=9.27, p<.0001, Trail Making Test B, F(3,668)=3.91, p=.009, and Vegetable Fluency, F(3,226)=3.67, p=.01.
Table 2 Baseline neuropsychological data

Note. Data are summarized as mean (standard deviation), unless otherwise indicated. All scores were corrected for age, sex, education, body mass index, and APOE e4 carrier status. Significant differences (p<.05) among medication groups are indicated in boldface type. At baseline, the Aβ+Ptau+ group performed worse than the biomarker negative group on RAVLT Immediate Recall (p=.03), Trail Making Test B (p=.003) and Digit Symbol (p=.0002). It also performed worse than the Aβ-Ptau+ group on RAVLT Immediate Recall and Trail Making Test B (both p’s<.05), and worse than the Aβ+Ptau- group on Digit Symbol (p=.003). The group positive for Aβ only performed worse than the biomarker negative group and the Ptau positive only group on Trail Making Test B (both p’s<.05). It also performed worse than the biomarker negative group on Digit Symbol (p=.02).
RAVLT=Rey Auditory Verbal Learning Test; BNT=Boston Naming Test.
a Scores were log-transformed and are presented to two decimal places.
b Higher scores indicate longer times to completion and, therefore, worse performance.
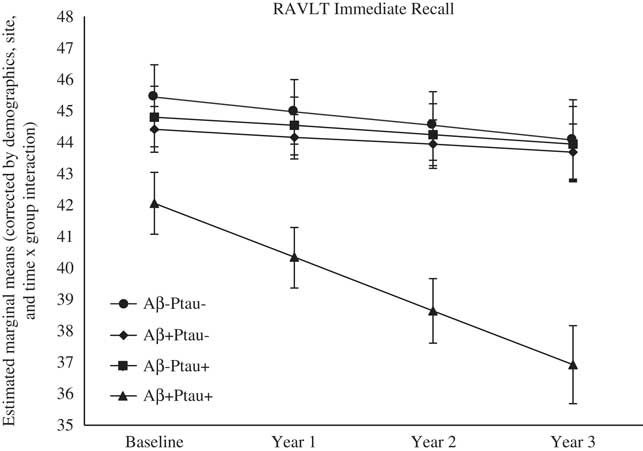
Fig. 1 The Aβ+Ptau+ participants showed greater decline in immediate memory relative to all other groups over follow-up: the Aβ+Ptau- group (p=.002), the Aβ-Ptau+ group (p=.004), and the Aβ-Ptau- group (p<.002).
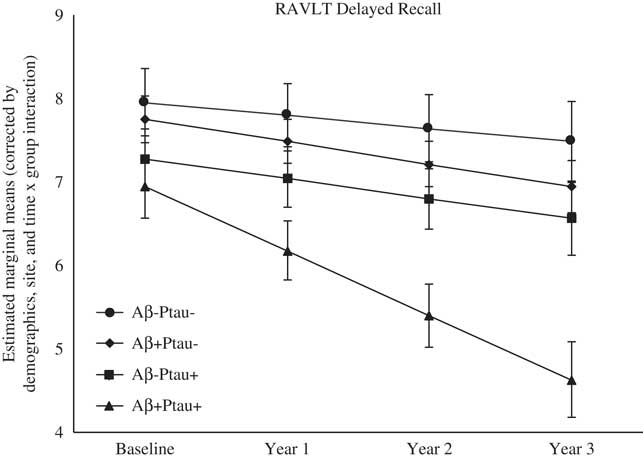
Fig. 2 The Aβ+Ptau+ participants showed greater decline in delayed memory relative to all other groups over follow-up: the Aβ+Ptau- group (p=.02), the Aβ-Ptau+ group (p=.01), and the Aβ-Ptau- group (p<.0005).
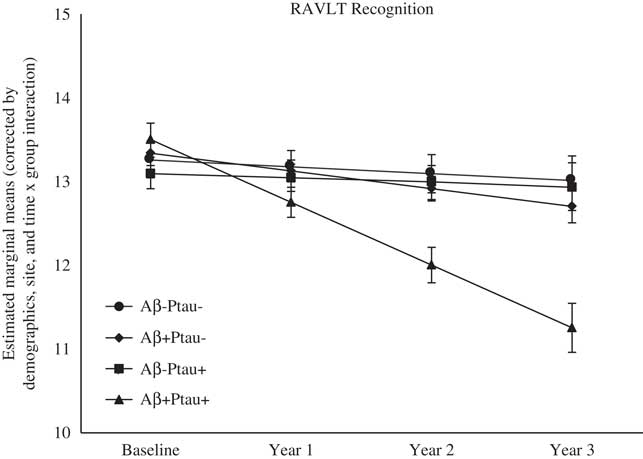
Fig. 3 The Aβ+Ptau+ participants showed greater decline in recognition memory relative to all other groups over follow-up: the Aβ+Ptau- group (p=.0006), the Aβ-Ptau+ and the Aβ-Ptau- group (p<.0001).

Fig. 4 The Aβ+Ptau+ participants showed greater decline in executive function relative to the Aβ-Ptau- group over follow-up (p=.0008). Scores are inverted such that higher values indicate better performance.
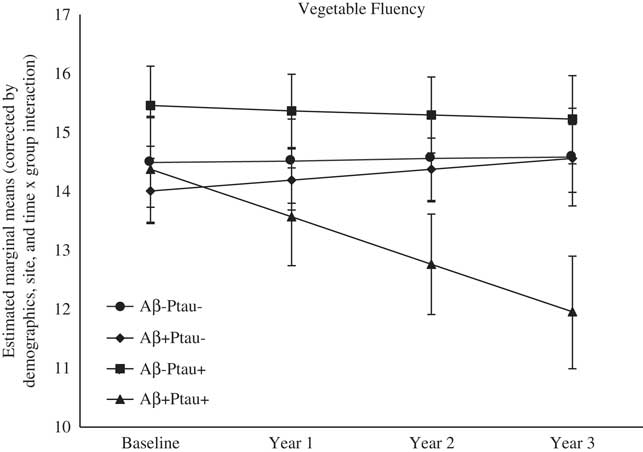
Fig. 5 The Aβ+Ptau+ participants showed greater decline in semantic fluency relative to relative to all other groups over follow-up: the Aβ+Ptau- group (p=.003), the Aβ-Ptau+ group (p=.05), and the Aβ-Ptau- group (p=.004).
Memory
On a list-learning task (RAVLT Immediate Recall, Trials 1–5), baseline performance in participants who were positive for both Aβ and Ptau was worse than the Ptau positive only (p=.03) and biomarker negative (p=.001) groups. As shown in Figure 1, longitudinal comparisons indicated greater decline in list-learning in the Aβ+Ptau+ participants relative to all other groups: the Aβ positive only group, β=−1.46, t(680)=−3.06, p=.002, the Ptau positive only group, β=−1.41, t(680)=−2.93, p=.004, and the biomarker negative group, β=−1.263, t(680)=−3.10, p=.002.
On a test of delayed free recall of a word list (RAVLT Delayed Recall), baseline performance did not differ among the groups; however, the Aβ+Ptau+ group showed the worst decline over time on this measure relative to all other groups: the Aβ positive only group, β=−0.50, t(680)=−2.42, p=.02, the Ptau positive only group, β=−0.53, t(680)=−2.56, p=.01, and the biomarker negative group, β=−0.61, t(680)=−3.48, p=.001.
Baseline performance was not different among the biomarker groups on a test of recognition memory (RAVLT Recognition). However, the Aβ+Ptau+ group showed the worst decline over time on recognition memory relative to all the other groups: the Aβ positive only, β=−0.54, t(680)=−3.47, p=.001, the Ptau positive only, β=−0.69, t(680)=−4.42, p<.0001, and those who were biomarker negative, β=−0.66, t(680)=−4.98, p<.0001.
Attention/executive function
On a test of executive function (Trail Making Test B), participants who were positive for both Aβ and Ptau, as well as participants who were positive for Aβ only, exhibited worse baseline performance than those who were positive for Ptau only (both p’s<.05) and those who were biomarker negative (both p’s<.02). The Aβ+Ptau+ participants did not differ from those who were positive for Aβ only (p>.10).
Longitudinal analyses revealed greater decline in executive function in the Aβ+Ptau+ group relative to the biomarker negative group, β=−0.03, t(668)=−3.38, p=.0008.
There were no group differences on a test of attention (Trail Making Test A) at baseline or on rates of decline over time. Longitudinal analyses revealed a main effect of group, with the Aβ+Ptau+ group performing worse compared to the biomarker negative group (p=.0004), and those positive for Ptau only (p=.01). The Aβ+Ptau- group also performed worse than the biomarker negative group (p=.02).
Language
Baseline performance on tests of confrontation naming (BNT) and semantic fluency (Animal Fluency and Vegetable Fluency) was not different among the biomarker groups. Results on the BNT reported here were obtained after dropping a subset of outliers (n=22, scored >3 SDs below the mean).
The Aβ+Ptau+ group showed the worst decline over time on Vegetable Fluency relative to all the other groups: the Aβ positive only, β=−0.99, t(226)=−2.98, p=.003, the Ptau positive only, β=−0.74, t(226)=−2.00, p=.05, and those who were biomarker negative, β=−0.84, t(226)=−2.96, p=.004. There was also a main effect of group on Animal Fluency, with the Aβ+Ptau+ group performing worse than both biomarker groups: the Aβ positive only (p=.004), and the Ptau positive only (p=.02). The four biomarker groups did not show differences in rates of decline in confrontation naming over time.
Processing speed
At baseline, participants who were positive for both Aβ and Ptau exhibited significantly worse processing speed (Digit Symbol) relative to those who were positive only for Aβ (p=.003) and those who were biomarker negative (p=.0002). Those who were positive only for Ptau performed worse than those who were biomarker negative (p=.02). Longitudinal analyses revealed a main effect of group, with the biomarker positive and the Ptau positive only groups performing worse compared to the Aβ positive only and biomarker negative groups (all p’s<.02).
DISCUSSION
Findings of the present study showed that cognitively normal older adults demonstrated different neuropsychological baseline characteristics and future trajectories based on their biomarker profile. At baseline, individuals who were positive for both biomarkers (Aβ and Ptau) showed subtle memory and executive dysfunction, as well as slowed processing speed, relative to those who were positive for one biomarker or were biomarker negative. Over a 3-year follow-up period, the Aβ+Ptau+ individuals showed the worst decline in immediate, delayed, and recognition memory, as well as semantic fluency, relative to all other groups. The Aβ+Ptau+ group also showed more executive dysfunction than the biomarker negative group.
Our findings are highly consistent with recent reports confirming that the memory domain is affected early in the AD process, and that clear declines are observed in preclinical cases who are biomarker positive for both Aβ and Ptau. Interestingly, the diminished speed of processing was observed at baseline performance, and poor semantic fluency performance was seen longitudinally, potentially suggesting that slowing could occur at least as early as memory changes. Future studies examining subtle deficits in psychomotor speed, visual attention, and semantic network integrity could help clarify the nature of these previously unrecognized neuropsychological characteristics of preclinical AD.
Our longitudinal finding of declines in semantic retrieval (Vegetable fluency) in the Aβ+Ptau+ group corroborates prior work in cognitively normal older adults. Papp et al. (Reference Papp, Mormino, Amariglio, Munro, Dagley, Schultz and Rentz2015) reported that Aβ+ individuals performed worse on category fluency compared to Aβ- individuals over an average of 2.4 years of follow-up. Aβ+ participants also showed greater decline than Aβ- individuals on phonemic fluency ability (generating words to the letters F-A-S); however, this association disappeared after accounting for semantic fluency ability (Papp et al., Reference Papp, Mormino, Amariglio, Munro, Dagley, Schultz and Rentz2015). Taken together, these findings and those of the present study suggest that Aβ positivity may be linked to declines in category fluency with disease progression, even at the earliest, preclinical stage.
Our study also found that amyloid pathology, in the absence of tau pathology, was linked to worse attention and executive function. Similar results, especially with regard to changes in executive function, have been reported in other studies of asymptomatic, preclinical adults (e.g., Clark et al., Reference Clark, Schiehser, Weissberger, Salmon, Delis and Bondi2012; Harrington et al., Reference Harrington, Chiang, Pogoda, Gomez, Thomas, Marion and Zhou2013). In a study examining amyloid status among cognitively healthy older adults, Schott, Bartlett, Fox, and Barnes (Reference Schott, Bartlett, Fox and Barnes2010) found that Trail Making Test B was the only neuropsychological test which differentiated amyloid positive individuals from amyloid negative participants, with the amyloid positive group performing significantly worse than their amyloid negative counterparts. Additionally, baseline CSF amyloid was strongly correlated with brain atrophy, but only in the amyloid positive group.
In a separate study on the utility of selective attention tasks as predictors of early AD, greater within-person variability was found among healthy controls on a test of Task Switching, and this variability was associated with amyloid positivity (Duchek et al., Reference Duchek, Balota, Tse, Holtzman, Fagan and Goate2009). These studies also found amyloid positivity to be linked to a higher likelihood of also having elevated CSF tau or Ptau (Schott et al., Reference Schott, Bartlett, Fox and Barnes2010) or tau/Aβ42 and ptau181/Aβ42 ratios (Duchek et al., Reference Duchek, Balota, Tse, Holtzman, Fagan and Goate2009). Therefore, our study adds to the existing literature by demonstrating impaired attention and executive function in individuals who are amyloid positive without concomitant elevated Ptau.
Current models of preclinical AD presume that subtle cognitive decline will not emerge until patients are biomarker positive for both Aβ and Ptau. The current study found that even in the absence of Aβ retention, older adults exhibiting Ptau elevation demonstrated worse processing speed than those who were biomarker negative and those who were Aβ+Ptau-. Although some investigators have identified Aβ-Ptau+ cases as “suspected non-AD pathology” or SNAP (Jack, Knopman, et al., Reference Jack, Bennett, Blennow, Carrillo, Feldman, Frisoni and Dubois2016), others have pointed out that the Aβ-Ptau+ profile is very common in older adults and may represent a heterogenous group of individuals (Mormino et al., Reference Mormino, Papp, Rentz, Schultz, LaPoint, Amariglio and Johnson2016). More recent diagnostic models are non-biased with regard to the order in which Aβ and Ptau biomarkers emerge, suggesting that the Aβ-Ptau+ subgroup may simply represent an intermediate preclinical stage in an alternative pathway to AD (Jack, Wiste, et al., Reference Jack, Wiste, Weigand, Therneau, Knopman, Lowe and Machulda2017), although this has been disputed by other investigators noting that Aβ-Ptau+ cases do not show greater cerebral Aβ or tau accumulation (Gordon et al., Reference Gordon, Blazey, Su, Fagan, Holtzman, Morris and Benzinger2016).
Despite these controversies, the present findings suggest that Ptau positivity (with or without amyloid positivity) may have a more generalizable effect on processing speed. Prior evidence indicates that AD pathophysiology begins not in the cerebral cortex as traditionally conceived, but in the locus coeruleus (LC) and its diffuse projections to the cortex (Braak & Del Tredici, Reference Braak and Del Tredici2011). The LC-norepinephrine system, which is important in the control and efficiency of task completion (Astro-Jones & Cohen, Reference Aston‐Jones and Cohen2005), has, therefore, been implicated in AD. The present study shows evidence of a possible cognitive manifestation of lesions to this system.
A recent study by the Australian Imaging, Biomarker and Lifestyle (AIBL) group (Burnham et al., Reference Burnham, Bourgeat, Doré, Savage, Brown, Laws and Martins2016) examined differences among cognitively healthy older adults with either Aβ pathology only (A+N-), neurodegeneration only (A-N+, similar to the SNAP group), both Aβ pathology and neurodegeneration (A+N+), or neither (A-N). The authors reported that the A+N- and A+N+ groups had significantly faster rates of cognitive decline relative to the A-N- group. Consistent with the present study findings, with the exception of the slowed processing speed by Aβ-Ptau+ individuals, the AIBL study found that the SNAP group did not show any significant difference in cognitive change over time relative to the A-N- group but did exhibit lower cognitive scores at baseline (0.2 SD less than the A-N- group on a composite cognitive measure).
These results are partly supported by similar findings in other studies which demonstrate that the co-occurrence of Aβ pathology and neurodegeneration appear to accelerate decline in cognitively normal individuals (Vos et al., Reference Vos, Xiong, Visser, Jasielec, Hassenstab, Grant and Fagan2013). Other studies have shown that persons with either pathology alone may exhibit no decline (Machulda et al., Reference Machulda, Pankratz, Christianson, Ivnik, Mielke, Roberts and Petersen2013; Mormino et al., Reference Mormino, Betensky, Hedden, Schultz, Amariglio, Rentz and Sperling2014) or subtle deficits such as diminished practice effects relative to those who are biomarker negative (Mormino et al., Reference Mormino, Papp, Rentz, Schultz, LaPoint, Amariglio and Johnson2016). Results from the present study corroborate these findings, given that Aβ+Ptau+ group showed the most rapid decline on three memory measures over time, relative to all other groups.
Contrary to findings from the AIBL group, our Aβ+Ptau- group did not show significantly greater decline in performance compared to the Aβ-Ptau- group, although this group’s performance did fall between the Aβ-Ptau- and Aβ+Ptau+ groups on all domains examined. This discrepancy is likely due to the AIBL group’s use of a clinical composite score as well as measures of global cognition (e.g., Mini-Mental State Examination scores) in analyses. The present study benefits from the use of individual test scores examining separate domains, allowing for evaluation of various patterns of cognitive presentation.
Additionally, while the AIBL group characterized neurodegeneration status using hippocampal volume measured on MRI, the present study assessed status using CSF p-tau181p. This biomarker is not only an indicator of neuronal change, but also a reflection of the state of tau phosphorylation and, therefore, the formation of tangles observed in AD (Blennow & Hampel, Reference Blennow and Hampel2003). The specificity of CSF phosphorylated tau protein for AD is higher than for both Aβ1-42 and total tau, rendering it of great utility in discriminating between AD and other dementing illnesses (Blennow & Hampel, Reference Blennow and Hampel2003).
The present study is not without limitations. Given the exploratory nature of this study, we did not account for multiple comparisons. The ADNI sample is comprised of participants from over 50 sites in the United States and Canada with varied sampling biases. Thus, we accounted for local sampling biases by clustering participants by site in our analyses. Participants were excluded based on criteria that restricted cerebrovascular disease, limiting generalizability. However, examination of vascular risk burden at baseline revealed no significant differences among our groups. The strengths of the present study include its longitudinal design, large sample size, use of robust neuropsychological criteria that were not biased toward the memory domain, and examination of test-level neuropsychological data to compare biomarker groups on neuropsychological profiles and trajectories.
In summary, individuals in the preclinical stage of AD who may not present with any overt clinical syndromes may still show varying cognitive performance based on the presence or absence of Aβ and Ptau. The cognitive differences found among biomarker groups in this study are underscored by the fact that these groups did not differ significantly on vascular risk factor burden, as evidenced in comparable proportions of prior diagnoses of cardiovascular disease, hypertension, dyslipidemia, type 2 diabetes, transient ischemic attacks, atrial fibrillation, and carotid artery disease. We conclude that cognitive changes in preclinical AD may occur earlier than previously thought and may not exclusively involve memory, although the memory domain may be the most prominently affected over time.
Taken together, our work builds on prior research to support the use of attention/executive function tests, the comparison of semantic versus phonemic fluency ability, as well as assessments of processing speed to distinguish between declines in ability that may be attributable to increasing AD pathology versus regular age-related declines. This is important given that earlier detection of pathological cognitive changes may prompt early treatment or preventative efforts that could have effects on staving off the progression of disease. Future work would do well to examine cognitive change independent of the temporal sequence of appearance of biomarkers and the differential performance that may be observed among various cognitive domains in the refinement of diagnostic profiles of preclinical AD. Finally, neuropsychological markers should be included as any part of preclinical staging schemes, given their utility in identifying early asymptomatic stage changes.
ACKNOWLEDGMENTS
Conflict of Interest: None. Author Contributions: All the authors significantly contributed to the study concept, design, literature review, interpretation of data, and preparation of manuscript. Funding: The study data analysis was supported by NIH/NIA grants (R21AG055034, P50 AG005142 and P01 AG052350) and Alzheimer’s Association grant AARG-17-532905. Data collection and sharing for this project was funded by the Alzheimer’s Disease Neuroimaging Initiative (ADNI) (National Institutes of Health Grant U01 AG024904) and DOD ADNI (Department of Defense award number W81XWH-12-2-0012). ADNI is funded by the National Institute on Aging, the National Institute of Biomedical Imaging and Bioengineering, and through generous contributions from the following: AbbVie, Alzheimer’s Association; Alzheimer’s Drug Discovery Foundation; Araclon Biotech; BioClinica, Inc.; Biogen; Bristol-Myers Squibb Company; CereSpir, Inc.; Eisai Inc.; Elan Pharmaceuticals, Inc.; Eli Lilly and Company; EuroImmun; F. Hoffmann-La Roche Ltd and its affiliated company Genentech, Inc.; Fujirebio; GE Healthcare; IXICO Ltd.; Janssen Alzheimer Immunotherapy Research & Development, LLC.; Johnson & Johnson Pharmaceutical Research & Development LLC.; Lumosity; Lundbeck; Merck & Co., Inc.; Meso Scale Diagnostics, LLC.; NeuroRx Research; Neurotrack Technologies; Novartis Pharmaceuticals Corporation; Pfizer Inc.; Piramal Imaging; Servier; Takeda Pharmaceutical Company; and Transition Therapeutics. The Canadian Institutes of Health Research is providing funds to support ADNI clinical sites in Canada. Private sector contributions are facilitated by the Foundation for the National Institutes of Health (www.fnih.org). The grantee organization is the Northern California Institute for Research and Education, and the study is coordinated by the Alzheimer’s Disease Cooperative Study at the University of California, San Diego. ADNI data are disseminated by the Laboratory for Neuro Imaging at the University of Southern California.


