


Introduction
Changes in mountain glaciers are one of the natural indicators of climate change (Reference OerlemansOerlemans, 1994). With global warming, the glaciers in middle and low latitudes have retreated continually and glacier mass balance has been continuously negative since the 1990s (e.g. Reference Yao, Liu, Pu, Shen and LuYao and others, 2004). Several investigators have shown that glacier shrinkage can contribute substantially to rising sea level (e.g. Reference Zuo and OerlemansZuo and Oerlemans, 1997; Reference Van de Wal and WildVan de Wal and Wild, 2001). Glaciers have an important role in climate change, sea-level rise and flood hazards. This is why investigation of glacier mass-balance and glacier area fluctuations is an important component of the Global Climate Observing System (Reference Haeberli, Cihlar and BarryHaeberli and others, 2000). The Global Land Ice Measurements from Space (GLIMS) project was carried out to monitor land glacier changes using Landsat Enhanced Thematic Mapper Plus (ETM+)/Thematic Mapper (TM), Advanced Spaceborne Thermal Emission and Reflection Radiometer (ASTER) and other remote-sensing images (Reference KiefferKieffer and others, 2000; Reference Kääb, Paul, Maisch, Hoelzle and HaeberliKääb and others, 2002; Reference Paul, Kääb, Maisch, Kellenberger and HaeberliPaul and others, 2002b).
The Chinese Glacier Inventory (CGI), concluded in 2002 (Reference Mi, Xie, Luo, Feng, Ma and JingMi and others, 2002), was a significant step in integrating knowledge of glaciers in China, and forms the key database for further studies on regional glacier fluctuations, their responses to climate change and their influence on water resource variations. A pronounced atmospheric warming of 0.7˚C occurred over western China during the past 50 years (D. Reference Li, Han, Jin, Yang and JiaoLi and others, 2003), with a likely climate shift from warm, dry to warm, wet conditions in northwestern China (Reference Shi, Shen and HuShi and others, 2002). Glacier retreat prevailed in recent decades throughout China, as shown by field observations and satellite remote-sensing monitoring (Reference Ren, Qin and JingRen and others, 1998; Reference Zhen, Sun and ZengZhen and others, 1998; Reference He, Gu and ZhangHe and others, 2003; Reference Li, Han, Jin, Yang and JiaoLi and others, 2003; Reference Liu, Sun, Shen and LiLiu and others, 2003; Reference Yang, Ding, Chen, Liu and LuYang and others, 2003; Reference Jin, Che, Li and WuJin and others, 2004). However, there are still several regional gaps where glacier behavior is presently unknown. In order to characterize the response of glaciers to climate change in different regions with various climatic settings, it is necessary to extend our monitoring of glaciers to regions like the Muztag Ata and Konggur mountains in the eastern Pamirs. This research is also motivated by the fact that water resources are vital to society and economic development in this drought-prone inland region. Glacier runoff here plays an important role as a source of water for one of the key tributaries of the Tarim river, the Kaxgar river, which supports daily life, agriculture, livestock and industry in the city of Kaxgar. The glacier changes in the Tarim basin over the past several decades are estimated (Fig. 1) by comparing the photogrammetrically derived CGI with Landsat TM/ETM+ satellite images acquired more recently. The results of this study will assist investigations of hydrological change, and regional water-resource management.

Fig. 1. Location map of the study region in the Muztag Ata and Konggur mountains. Glacier masks (black) were derived from the digitized CGI of 1962/66.
Study Area
The Muztag Ata and Konggur mountains are located on the eastern Pamir plateau, China (38–39˚ N, 74˚40’–75˚40’ E). They range in elevation from about 3000 m a.s.l. to a maximum of 7546 and 7719ma.s.l. at the two summits, respectively. Several valley glaciers descend from the ice caps, most of them with snowline elevations of 5200–5700 ma.s.l. and terminus positions at 3900–4900ma.s.l., according to the CGI (Reference Yang and AnYang and An, 1989; Reference Liu, Wang and DingLiu and others, 2001). Glaciers in the study region feed three rivers: the Taxkogan river, which is a tributary of the Yarkant river, and two tributaries of the Kaxgar river, the Kusan and Gezhe rivers (Fig. 1).
These glaciers are of an extremely continental type, with one of the coldest environments in low- and mid-latitude regions (Reference ZhangZhang, 1980; Reference Su, Liu and WangSu and others, 1989; Reference Wu, Yao, Xu, Li and BaoWu and others, 2003; Reference Li, Yao, Tian, Xu, Wu and ZhuLi and others, 2004) and one of the driest glacierized areas in China. The data at Taxkogan meteorological station (37˚46’ N, 75˚14’ E; 3090.9 m.a.s.l.) show that annual precipitation remains below 70mm and mean summer temperature (June–August) is as high as 15.1˚C. It is estimated that monthly mean air temperatures can be higher than 0˚C over glacier terminus areas during the warm season (May–September), so intensive ablation may occur in June–August.
According to the CGI, there are more than 302 glaciers in the Muztag Ata and Konggur mountains, covering a total area of 1067.24 km2 (Reference Yang and AnYang and An, 1989; Reference Liu, Wang and DingLiu and others, 2001). The majority are small glaciers, as shown in Figure 2 (53.5% of them are <1 km2), but because there are some larger glaciers the mean glacier area is 2.82 km2.
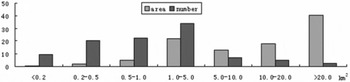
Fig. 2. Frequency of glacier area and number according to different area classes. The numerous glaciers in the 1–5 km2 range cover about 21.3% of the total glacierized area in the Muztag Ata and Konggur mountains.
Methods and Data Sources
The data sources used in this study are listed in Table 1. Glacier outlines from the CGI were interpreted and measured by stereophotogrammetry from aerial photographs at a scale of 1 : 46 000/50 000 taken during 1962/66. They were transferred to 1 : 100 000 topographic maps in the Universal Transverse Mercator (UTM) coordinate system referenced to the World Geodetic System 1984 (WGS84). Finally, the glacier outlines were digitized as Geographic Information System (GIS)-based vector files (total 302 glaciers) for further processing. The 1981 digital elevation model (DEM) was produced by digitizing the 40 m interval contours and spot heights from the same topographic maps, using ArcView software. Two Landsat TM images and two Landsat ETM+ images with almost no cloud and snow cover were chosen and used. Composite images from bands 5, 4 and 3 (30m resolution) were produced first and merged with the band 8 (15 m resolution) Landsat ETM+ image. These images were orthorectified with the Orthobase Generic Pushbroom package using the 1 :100 000 topographic maps and the 1981 DEM. Twenty independent verification points (Reference DwyerDwyer, 1995; Reference Zhen, Sun and ZengZhen and others, 1998) were selected from each image in order to check the accuracy of co-registration. The result showed that the residual root-mean-square error (rmse) of all images was <44.9 m (Table 1).
Table 1. Data sources used in this study

Different methods have been suggested for image classification to extract glacier borders (Reference PaulPaul, 2000; Reference Zhang, Lu and LiuZhang and others, 2001; Reference Paul, Kääb, Maisch, Kellenberger and HaeberliPaul and others, 2002b), with image ratio and supervised classification the most commonly used. Compared with other methods, the ratio of TM3/TM5 (Reference RottRott, 1994) with a threshold larger than 2.1 gives the best result in this work because of the influence of slope shadows. Due to the limitations of the method employed (Reference Paul, Huggel, Käab, Kellenberger and MaischPaul and others, 2002a), misidentification is frequent, for instance, on seasonal snowpatches adjacent to glaciers or on debris-covered surfaces which are difficult to distinguish from bedrock owing to their similar spectral properties. In these cases, visual interpretation was applied, combined with multispectral satellite images and the 1981 DEM (Reference Paul, Huggel and KääbPaul and others, 2004a). Glacier extents in 1990 and 1999 were obtained by these methods. The error in area for most glaciers was generally < 1% for both Landsat ETM+ and TM. Unfortunately, 27 glaciers of <0.2 km2, derived from Landsat TM in 1990, had to be excluded because of the limited spatial resolution of Landsat TM and the geometric correction error of 6–9% of glacier area (Reference Paul, Huggel, Käab, Kellenberger and MaischPaul and others, 2002a). In addition, two cloud- and three debris-covered glaciers (total area 229.03 km2) were also excluded since it was difficult to determine where the glacier boundary was. Thus, the first results of glacier changes derived from the 1962/66 CGI and observed from 1990 and 1999 satellite images were computed for a sample of about 297 glaciers of the Muztag Ata and Konggur mountains.
Results
Glacier area changes
Glacier area has decreased significantly between 1962/66 and 1999 in the Muztag Ata and Konggur mountains (Table 2), with a total area loss of 66.02 km2, which is equivalent to 7.9% of the original area in the early 1960s. Area reduction of glaciers of 1–5 km2 contributes 44.6% of the total area loss. The mean size of glaciers in the Muztag Ata and Konggur mountains decreased from 2.82 km2 to 2.63 km2 between 1962/66 and 1999. The rate of area reduction was 1.01 km2 a−1 between 1962 and 1990, but increased more than four times to 4.26 km2 a−1 in the period 1990–99, clearly showing that glacier retreat in the region is accelerating.
Table 2. Summary of glacier area data in the Muztag Ata and Konggur mountains according to area class

Larger glaciers have lost more total area than small glaciers (Fig. 3a). As for the relative changes of glaciers of different sizes, small glaciers usually show a higher percentage area reduction than large glaciers (Fig. 3b), and thus greater sensitivity to climate change. The few exceptions to this area-loss result are glaciers within some of the size classes that showed an area increase throughout the period (Fig. 3b), but three glaciers (World Glacier Monitoring Service IDs CN5Y663B17, CN5Y662D25 and CN5Y662F1) disappeared. One reason that glaciers <0.2 km2 and 5–10 km2 in size showed relatively little change may be the offset effect of advancing glaciers.

Fig. 3. Net (a) and relative (b) glacier area changes, 1962–99. The changes are averaged for the area classes shown in Figure 2 (bold line). The smaller the glaciers, the higher their average percentage area loss. Two exceptions to the area loss are found in glaciers <0.2 km2 and in the 5–10 km2 range.
A comparison with glacier changes in other regions of China is presented in Table 3. Glacier changes in the Muztag Ata and Konggur mountains appear larger than in other extreme continental-type regions (Reference Yang, Ding, Chen, Liu and LuYang and others, 2003; Reference LiuLiu and others, 2004) and parts of subcontinental-type regions in China. However, they are smaller than in maritime-type and other parts of subcontinental-type regions (Reference He, Gu and ZhangHe and others, 2003; Z. Reference Li, Han, Jin, Yang and JiaoLi and others, 2003; Reference Yang, Ding, Chen, Liu and LuYang and others, 2003). These results suggest that glaciers in the Muztag Ata and Konggur mountains have disintegrated rapidly since the 1960s.
Table 3. Comparison of glacier changes in China

Glacier frontal changes
In general, an average 9.9% glacier front retreat was detected during the 1962/66−1999 period. Figure 4a and b, respectively, show the absolute and relative length changes of individual glaciers against their lengths in the early 1960s. Comparisons of glacier terminus positions in the last few decades indicate that 167 glaciers were retreating, about 40 were advancing and that changes of about 90 glaciers cannot be determined. Similar to the change in glacier area, glaciers experienced a slow retreat in length at a mean rate of 6.0 ma−1 between 1962 and 1990 and a much more rapid retreat of 11.2 m a- 1 in the 1990s. Thus, in the 1990s the glaciers shortened 1.9 times more quickly than in the approximately 30 years before 1990.

Fig. 4. Net (a) and relative (b) glacier front position changes, 1962–99.
As most values are above the diagonal line, relative change in area is larger than the corresponding change in length for most of the glaciers during the time-span under consideration (Fig. 5). It is also worth noting that the change in glacier area is not always synchronous with the change in glacier length. Some retreating glaciers expanded in area due to the increase in accumulation area but decreased at the terminus, and the opposite for advancing glaciers. This implies that change can occur on any part of a glacier. The ratio of mean retreat rate of glacier fronts during the 1990−99 period to that during 1962−90 (1.9) is less than the ratio (4.0) for glacier area. However, length changes (9.9%) are greater than area changes (7.9%) when all the sampled glaciers are considered.

Fig. 5. Glacier area changes vs frontal changes (in %), 1962–99.
Temperature, Precipitation and Glacier Changes
There are only a few meteorological stations, with relatively short-term instrumental records, in western China, especially in the mountain regions. The Taxkogan meteorological station is the only meteorological station on the Pamir plateau located above 3000 m a.s.l. (Fig. 1). The station has been operating since 1957. The summer temperature and annual precipitation at the Taxkogan station from 1957 to 2000 are shown in Figure 6. The summer temperature rose by 0.7˚C between 1957 and 2000, and the winter temperature, not shown, did not rise appreciably. This time-span included three cold periods: 1961–68, 1973–77 and 1985–93. Annual precipitation has increased slightly in the last four decades, which represents favorable climatic conditions for glaciers. Therefore, we believe that glacier retreat during the past 40 years can be attributed mainly to air-temperature rise in the Muztag Ata and Konggur mountains. We also expect that a sharp retreat of glaciers in the region may occur in the future due to the warming in the most recent decade. However, some glacier advances might be a response to the three periods of cooling and the increase of annual precipitation, along with the glacial dynamics responses of individual glaciers.

Fig. 6. Changes in mean summer air temperature (June–August) and mean annual precipitation at Taxkogan meteorological station.
The study of Reference Pu, Yao and DuanPu and others (2003) verifies that surface ablation on an occasionally observed glacier was intensified by atmospheric warming from the 1960s/80s to 2001 in the Muztag Ata mountain region. Hydrological analysis gives the result that glaciers in the Kangxiwa river valley headwaters of the Kaxgar river have been losing mass at a rate of 123.5 mm a−1 (Reference Shen, Xie, Ding and LiuShen and others, 1997).
Conclusion
The present study supports previous findings (e.g. Reference Khromova, Dyurgerov and BarryKhromova and others, 2003; Reference Paul, Kääb, Maisch, Kellenberger and HaeberliPaul and others, 2004b) that cold, high-mountain glaciers have been disintegrating rapidly since the 1970s. Our measurements show that glacier areas and frontal positions have decreased by 7.9% and 9.9%, respectively, between 1962 and 1999 in the Muztag Ata and Konggur mountains. Furthermore, a drastic acceleration of retreat since the 1990s is found. The mean frontal retreat of glaciers increased from 6.0ma−1 in the 1962/66−1990 period to 11.2 m a−1 in 1990−99, and the area shrinkage of glaciers in 1990−99 increased about three times, to 1.01 km2 a−1, from the annual rate in 1962/66−1990. These accelerations are consistent with climate warming during recent decades.
Changes in glacier frontal positions and glacier area are easily observed phenomena with which to study the impact of climate change (Reference OerlemansOerlemans, 1994) and its influence on water resources in arid regions (Reference Yao, Liu, Pu, Shen and LuYao and others, 2004). Glacier frontal changes are strongly enhanced but indirect, filtered and delayed signals of climate change (Reference OerlemansOerlemans, 2001). They can be used to show that the few direct studies of mass-balance variability are representative (Reference Hoelzle, Haeberli, Dischl and PeschkeHoelzle and others, 2003) and to reconstruct historical climate variability (Reference OerlemansOerlemans, 1994). The instrumental record at the Taxkogan meteorological station, which is >50km away from the glacierized region, is not adequate to analyze climate changes in the Muztag Ata and Konggur mountains in detail. Nevertheless, glacier retreat is occurring and this has accelerated in the 1990s. Furthermore, glacier ice mass loss since the 1980s has increased the magnitude and frequency of flash floods in the Gezhe river because ablation of the glacier surface accelerated as a consequence of atmospheric warming (Y. Reference Li, Han, Jin, Yang and JiaoLi and others, 2003). Recently initiated mass-balance measurements and ice-core records from the Muztag Ata and Konggur mountains will assist detection of the climate-glacier-meltwater interaction.
Although glacier retreat in recent decades such as observed in the Muztag Aga and Konggur mountains is a response to climate fluctuations, other factors also cause the glaciers to change: glacier terrain, kinematics, dimensions, the sensitivity of different types of glaciers to climate change, etc. Owing to the dynamic response, glacier fluctuations usually lag climate change by 5−20years for medium-sized glaciers (Reference DingDing, 1995; Reference Liu, Wang, Ding and XieLiu and others, 1999). This characteristic means that some glaciers advance under conditions of regional atmospheric warming. As for the glacier dimensions, the narrow lowest parts and wide higher, ablation, area on most glaciers also influence the ratio of glacier area and glacier length variations.
Acknowledgements
Special appreciation is due to Pu Jianchen, Wu Guangjian and Duan Keqin for their helpful suggestions on this paper and to Liu Chaohai for his careful review. We are grateful to the reviewers and the scientific editor for suggestions and comments that significantly improved the paper. We thank GLIMS for maintaining parts of the satellite data and software through the EROS (Earth Resources Observation Systems) Data Center. This research is supported financially by the National Natural Science Foundation of China (grants 90202013 and 40371026) and the Chinese Academy of Sciences (grant KZCX3-SW-345).


