


Introduction
Amyotrophic lateral sclerosis (ALS) is a progressive neurological condition with a hallmark pathology of motor neuron degeneration. Patients experience gradual paralysis of the limbs, speech dysfunction, and swallowing difficulties.Reference Kiernan, Vucic and Cheah 1 The precise mechanisms of motor neuron degeneration are unknown at present; however, 5%-10% of ALS cases are familial, with mutations recognized in SOD1,Reference Rosen, Siddique and Patterson 2 TARDBP,Reference Sreedharan, Blair and Tripathi 3 FUS,Reference Vance, Rogelj and Hortobagyi 4 and C9ORF72 Reference Renton, Majounie and Waite 5 , Reference DeJesus-Hernandez, Mackenzie and Boeve 6 genes. In addition to motor cortexReference Roccatagliata, Bonzano, Mancardi, Canepa and Caponnetto 7 and corticospinal tract (CST)Reference Agosta, Pagani and Rocca 8 , Reference Sage, Van Hecke and Peeters 9 degeneration, frontotemporal lobar degenerationReference Abrahams, Goldstein and Suckling 10 , Reference Mezzapesa, Ceccarelli and Dicuonzo 11 is present in a significant number of patients.
The clinical presentation of ALS involves a combination of upper and lower motor neuron (UMN and LMN) signs and symptoms, and features of cognitive and behavioral impairment in a subset of patients. There is no diagnostic test for ALS, and clinicians rely on the identification of subjective and insensitive signs of UMN and LMN dysfunction for diagnosis.Reference Brooks, Miller, Swash and Munsat 12 Electromyography can provide sub-clinical evidence of LMN involvement. Studies have explored the potential of neuroimaging techniques to provide objective evidence of UMN or cerebral involvement. These report global and regional brain atrophy,Reference Mezzapesa, Ceccarelli and Dicuonzo 11 , Reference Kassubek, Unrath and Huppertz 13 and hyperintensity of the CSTReference Hecht, Fellner, Fellner, Hilz, Neundörfer and Heuss 14 , Reference Ngai, Tang, Du and Stuckey 15 and hypointensity of the precentral gyrusReference Hecht, Fellner, Fellner, Hilz, Neundörfer and Heuss 14 , Reference Ngai, Tang, Du and Stuckey 15 on T2-weighted and fluid-attenuated inversion recovery (FLAIR) images; however, these changes have inadequate accuracy to be reliable indices of cerebral degeneration to confirm diagnosis or monitor progression. Thus, routine MRI only serves to exclude diseases that mimic ALS.Reference Filippi, Agosta and Abrahams 16 An objective biomarker is needed that can aid in evaluating cerebral degeneration and provide a tool to evaluate novel treatments in clinical trials.
Texture analysis (TA) is a computational image processing method that quantifies pixel interrelationships and patterns (“texture features”) that may be indiscernible to the human eye.Reference Kassner and Thornhill 17 Texture features are best understood as properties of an image such as its roughness, smoothness, brightness, and contrast and can be used to classify medical images according to pathology. In a multiple sclerosis study, TA successfully distinguished between patients with active lesions from those with non-active lesions.Reference Yu, Mauss, Zollner, Namer and Chambron 18 In patients with epilepsy, TA demonstrated 83% sensitivity and 100% specificity in identifying focal cortical dysplasia.Reference Antel, Collins and Bernasconi 19 Texture analysis has also been used in evaluating brain tumorsReference Mahmoud-Ghoneim, Toussaint, Constans and Jacques 20 , Reference Herlidou-Meme, Constans and Carsin 21 and detecting cerebral changes in Alzheimer’s disease.Reference Maani, Yang and Kalra 22 Recently, using a novel three-dimensional (3D) method,Reference Maani, Yang and Kalra 22 we demonstrated changes in texture features on T1-weighted images in ALS.Reference Maani, Yang, Emery and Kalra 23 The objective of this study was to determine whether TA could improve upon the ability to classify T2-weighted images. We hypothesized that TA can detect cerebral changes in T2-weighted images with greater accuracy than by visual inspection alone. Our second hypothesis was that the performance of TA is dependent on image resolution, with higher-resolution images yielding better results.
Materials and Methods
Subjects
The study was approved by the local institutional research ethics board, and all participants provided written consent. We recruited patients with UMN signs on examination who had a diagnosis of possible ALS, probable lab-supported ALS, probable ALS, or definite ALS according to the El Escorial criteriaReference Brooks, Miller, Swash and Munsat 12 from a multidisciplinary ALS clinic. None of the subjects had a family history of ALS, or frontotemporal dementia. Subjects were ineligible if they had a history of other neurological disorders or a contraindication for MRI. Finger- and toe-tapping rates, which are clinical measures of UMN function, were calculated by averaging the total number of taps in 10 seconds over two trials. Scores from the left and the right side within patients did not differ significantly and therefore were averaged to give a single score for each patient. Disease severity was assessed using the ALS Functional Rating Scale-Revised (ALSFRS-R), which ranges from 0 to 48, with lower scores indicating increasing disability. Patients’ disease duration was defined as the time between the onset of symptoms and the MRI scan. We also recruited age-matched healthy controls without neurological or psychiatric diseases.
MRI Data Acquisition
MRI was conducted on a 4.7 T whole-body scanner (Varian Unity Inova console; Varian, Palo Alto, CA, USA). High-resolution, 2D fast-spin echo T2-weighted images were acquired (TR=4000 ms, TE=33.3 ms, echo spacing=16.7 ms, 8 echoes, voxel size=0.5×0.5 mm2, slice thickness=2 mm, no slice gap, matrix size=385×512, number of slices=20, acquisition time=4 minutes) with a coronal angulation that yielded images with the region of the precentral gyrus rostrally and the descending CST through to the cerebral peduncles caudally; this maximized inclusion of disease-relevant regions of the brain.
Image Processing
Images were down-sampled to 1×1, 2×2, 3×3, and 4×4 mm2 in-plane spatial resolutions using the bicubic interpolation algorithm in ImageJ (http://rsbweb.nih.gov/ij/). Non-uniform image intensity was corrected using bias-field correction in SPM8 (http://www.fil.ion.ucl.ac.uk/spm). The single coronal slice that maximally included the precentral gyrus and the CST, including the internal capsule, was selected for each subject under the supervision of a neurologist; this slice was masked by manually drawing an region of interest (ROI) from the cortex to the peduncles using ITK-SNAP (http://www.itksnap.org). The ROI included gray and white matter (GM and WM) (Figure 1). This anatomical region was selected for TA to (a) include maximally affected structures in ALS and (b) exclude the skull. The mean pixel intensity was calculated from the histogram of the ROI from patients and controls to ensure the absence of image intensity differences that may affect the extracted texture features.
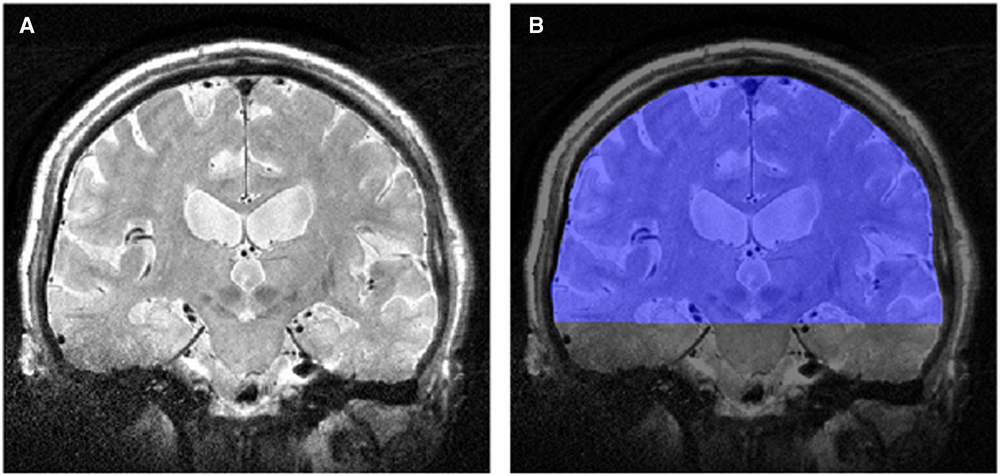
Figure 1 (A) T2-weighted image in the coronal plane, and (B) the region of interest (in blue) for the texture analysis.
Texture Analysis
Texture features were calculated from the ROI using in-house-developed software for SPM8. Features were estimated using the gray-level co-occurrence matrix (GLCM) technique, which is a second-order statistical method for feature extraction.Reference Haralick, Shanmugam and Dinstein 24 Gray-level co-occurrence matrix was selected to estimate texture features because statistical methods of calculating features achieve higher discriminatory results than structural methods in medical imaging.Reference Castellano, Bonilha, Li and Cendes 25 A GLCM is designed based on the relationships and the frequencies of pairs of pixel gray levels that occur within a neighborhood of pixels in an image.Reference Kassner and Thornhill 17 Pixel intensities within the ROI were scaled down, or quantized, to 16 gray levels to reduce computation time. The GLCM was created for gray levels over a pixel distance of 1 and averaged over four directions (0°, 45°, 90°, and 135°). Texture features were calculated and extracted from the GLCM, reflecting various pixel gray-level properties and relationships of the original image. In total, 22 different texture features (f 1, f 2, … , and f 22) were extracted from the GLCM (see Supplemental Table 1).
Visual Review of MRI
MRI were initially classified independently by two of the authors blind to the subjects’ diagnosis into either the patient or control group. These evaluators were not involved with conducting the TA. Subjects were classified as patients if there was, in the opinion of the evaluator, abnormal hyperintensity along the CST. The CST was selected because it is the anatomical region that is frequently assessed on routine clinical MRI studies for suspected ALS patients. Next, both authors convened and agreed upon a final classification of participants. Data sets at the native resolution and the optimal resolution based on the texture features’ performance results were used for this analysis.
Statistical Analysis
The non-parametric Mann-Whitney U test was used to test for differences in texture features between patients and controls. Associations between texture features and clinical measures were examined using Spearman’s rank correlation. Type I errors were controlled by using the false discovery rate method for multiple comparison correction and statistical significance was set at an adjusted p<0.05 for each statistical test. Uncorrected significance levels of p<0.05 are reported where results were not significant after correction for multiple comparisons. Texture features’ performance at different image resolutions was investigated by comparing area under the curve (AUC) of their receiver operating characteristic (ROC) curve. Classification results from visual analysis were evaluated using sensitivity and specificity scores along with ROC curve analysis. Logistic regression models were used to investigate the classification performances of (a) combining top-performing texture features and (b) combining those texture features with expert visual classification of subjects. The cutoff value for optimal sensitivity and specificity values for each test was determined using the Youden index in MedCalc for Windows, version 16.4.3 (MedCalc Software, Ostend, Belgium). All other statistics were carried out using SPSS for Windows, version 22 (IBM Corp. Armonk, NY).
Results
Demographics
In total, 12 ALS patients (57.4±10.0 years) and 19 age-matched healthy controls (57.0±10.5 years) were recruited. There were seven and eight male ALS and control participants, respectively. The median disease duration was 13.5±6.8 months, with a mean ALSFRS-R score of 37.8±8.9. Table 1 summarizes the participants’ characteristics.
Table 1 Table shows the characteristics of the participants in our study

ALS=amyotrophic lateral sclerosis; ALSFRS-R=ALS Functional Rating Scale-Revised; IQR=interquartile range.
Median of the disease duration is presented to give an accurate presentation, as one patient had a disease duration of 86 months at the time of the scan, which skewed the mean disease duration.
Textural Differences Between ALS Patients and Healthy Controls
There was no statistically significant difference (p=0.16) in the mean pixel intensities from the histogram of the ROIs between ALS patients (2676.41±302.97) and healthy controls (2919.49±531.84). Differences in texture between patients and healthy controls were dependent on image resolution (Table 2). At 2×2 mm2, 11 features were different in ALS after correction for multiple comparisons (Table 3). Images at 1×1 mm2 did not have differences in texture features when corrected for multiple comparisons; however, at uncorrected p<0.05, seven features were different between ALS patients and healthy controls. Images at 3×3 and 4×4 mm2 demonstrated no differences in texture; however, at 3×3 mm2 resolution, one feature was different at uncorrected p<0.05. Texture features were not different at either corrected or uncorrected significance levels at the 0.5×0.5 mm2 resolution.
Table 2 Texture features that were significantly different on T2-weighted MRI between amyotrophic lateral sclerosis patients and healthy controls at different resolutions

ns=not significant.
*p<0.05; **false discovery rate-corrected p<0.05.
Table 3 Significant texture features at 2×2 mm2 resolution

ALS=amyotrophic lateral sclerosis; AUC=area under the curve.
Values are shown as mean ± SD along with their receiver operator curve analysis results.
Correlations between Clinical Measures and Texture Features
Correlations were dependent on image resolution (Table 4). Texture features f 2, f 17, and f 22 demonstrated significant correlations with toe-tapping after correcting for multiple comparisons at 0.5×0.5 mm2 and 1×1 mm2 resolutions. Table 4 shows the correlations between clinical measures and texture features at uncorrected significance.
Table 4 Correlations between clinical measures and texture features at different resolutions

ALSFRS-R=ALS Functional Rating Scale-Revised; ns=not significant.
Spearman’s rank correlation coefficient is provided in brackets.
*p<0.05; **false discovery rate-corrected p<0.05.
Classification Performance
Texture features that were different between ALS patients and healthy controls after correcting for multiple comparisons were selected for ROC analysis to examine their diagnostic accuracy. Features f 2, f 7, f 8, f 9, f 10, f 11, f 12, f 17, f 18, f 21, and f 22 showed significant differences at 2×2 mm2 and were selected for further analysis. An AUC was calculated for each feature at all five resolutions.
Every feature improved in its performance (with increasing AUC), with decreasing image resolution from 0.5×0.5 mm2 to 1×1 mm2 to 2×2 mm2 (Figure 2). A peak in the AUCs was observed at 2×2 mm,2 after which the features’ AUCs declined with further reductions in resolution. The exceptions to this trend were features f 8 and f 12 that peaked at 1×1 mm2 and declined with decreasing resolution. The highest AUCs were achieved at 2×2 mm2 by features f 10 (0.785) and f 7 (0.781), both with a sensitivity and specificity of 100% and 58%, respectively. In addition, at 2×2 mm2 AUCs for all features were clustered around the mean AUC, whereas at other resolutions a wider spread of values was observed. Average AUCs of the texture features at each resolution are presented in Table 5.
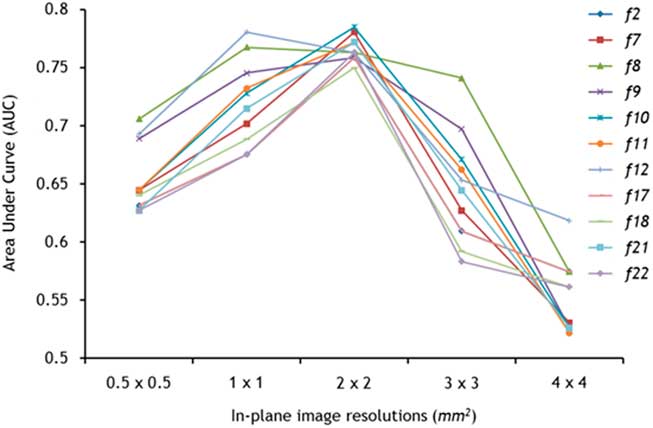
Figure 2 The discriminatory ability of texture analysis was dependent on image resolution. Nine of 11 texture features followed a trend with superior classification (highest area under the curve) peaking at 2×2 mm2.
Table 5 Image resolution dependence of the average area under the curve (AUC) of 11 texture features (f 2, f 7, f 8, f 9, f 10, f 11, f 12, f 17, f 18, f 21, and f 22) that were significant at 2×2 mm2 after correction for multiple comparisons

The 0.5×0.5 mm2 and 2×2 mm2 resolution data sets underwent a visual examination and consensus classification by two experts. Ten of the 31 subjects were classified as patients from the 0.5×0.5 mm2 data set, of whom seven were true positives. The remaining 21 subjects were classified as controls, of whom 16 were true negatives. Sensitivity and specificity were 58% and 84%, respectively, and AUC was 0.713. From the 2×2 mm2 data set, nine subjects were classified as patients, of whom five were true positives. In total, 22 subjects were classified as controls, of whom 15 were true negatives. This data set had a sensitivity of 42%, specificity of 79%, and AUC of 0.603.
Two combination diagnostic models were also assessed for their classification performance. In model 1, texture features f 10 and f 7 at 2×2 mm2 were selected as they had the highest AUCs of 0.785 and 0.781, respectively, each with a sensitivity of 100% and specificity of 58%. Combined, these features had a sensitivity and specificity of 92% and 63%, respectively, with an AUC of 0.785. In model 2, texture features f 10 and f 7 were combined with human classification of the 2×2 mm2 images, resulting in a higher AUC of 0.851 with sensitivity and specificity at 83% and 79%, respectively. The Hosmer and Lemeshow test suggested that both models were a good fit to the data (p>0.05).
Discussion
In this study, we demonstrated the presence of differences in MRI-based texture features in ALS patients. Texture features also correlated with clinical measures of disability and UMN function. To the best of our knowledge, there have not been other studies in the literature reporting TA on T2-weighted MRI in ALS.
Neuroimaging studies have examined morphological and microstructural alterations in ALS. Region of interest-based and voxel-based analyses of T1-weighted MRI have demonstrated cortical thinning and a reduction in the GM density of the precentral gyrus.Reference Roccatagliata, Bonzano, Mancardi, Canepa and Caponnetto 7 , Reference Agosta, Pagani and Rocca 8 Furthermore, WM microstructural alterations characterized by decreased fractional anisotropy and increased mean diffusivity have been noted in the CST and extra-motor regions of the brain with diffusion tensor imaging.Reference Agosta, Pagani and Rocca 8 , Reference Sage, Van Hecke and Peeters 9 These MRI metrics have elucidated the in vivo patterns of cerebral degeneration in ALS and have been proposed as potential biomarkers for the disease.Reference Muller, Turner and Grosskreutz 26 , Reference Walhout, Westeneng and Verstraete 27 However, these markers and advanced MRI have not yet been validated and are not routinely acquired clinically. Texture analysis can be performed on clinically acquired sequences such as T1- and T2-weighted MRI, and it has been shown to correlate with pathological changes in other diseases.Reference Zhang, Moore and Laule 28
Prior studies on T2-weighted imaging in ALS report hyperintensities along the CST with poor diagnostic potential. A recent study found the evaluation of hyperintense regions along the CST in ALS to have a diagnostic accuracy of 46.4%, sensitivity of 43.8%, and a specificity of 60.7%.Reference Cervo, Cocozza and Saccà 29 In another study, T2-weighted images were found to have 62.5% sensitivity when distinguishing definite and probable ALS patients from controls.Reference Charil, Corbo and Filippi 30 Visual assessment of CST hyperintensity in our data sets by expert reviewers yielded similar results; however, TA outperformed their classification: f 10 and f 7 each had a sensitivity of 100%, although the specificity was 58%. By contrast, visual inspection yielded classification with poor sensitivity and moderate specificity. The greatest classification with an AUC of 0.851 was achieved with the combination of texture features f 10 and f 7 and expert classification of images at 2×2 mm2 resolution. This was an improvement over using texture features and expert classification in isolation that yielded AUCs of 0.785 and 0.603, respectively.
These findings support the potential of TA of MRI images in discriminating ALS patients from healthy controls. These preliminary results suggest that there may be a role for TA to be paired with an expert clinician in the diagnosis of ALS. One approach would be to use a texture feature as a screening measure to first select cases as it has very high sensitivity, followed by confirmation by visual inspection of images by a clinician.
The greatest number of significantly different texture features between ALS patients and controls were present at 2×2 mm2 resolution, which suggests the presence of pronounced T2-weighted textural changes at this resolution. In addition, the performance of the texture features, as measured by their AUCs, demonstrated less variability and converged at the 2×2 mm2 resolution. These findings have several important implications. First, high-resolution imaging is time-consuming and not feasible in routine clinical practice; yet, our results show that TA is most robust at the resolution acquired in clinical imaging. Second, a unitary set of texture features could be used in clinical trials as a marker for cerebral changes.
Several studies in the literature have attempted to delineate the effect of imaging parameters on TA. In a phantom MRI study, TA achieved a classification accuracy of over 90% accuracy even in low-resolution images.Reference Jirák, Dezortová and Hájek 31 Studies addressing slice thickness suggest that a thin image slice thickness is not required for high TA performance.Reference Herlidou-Meme, Constans and Carsin 21 , Reference Savio, Harrison and Luukkaala 32 Together, these studies support our findings, suggesting that optimal TA performance may not require high-resolution images.
The pattern of TA performance in our study could be caused by changes in the signal-to-noise rate (SNR) because of changes in image resolution. Post hoc SNR analysis of our data set showed a rise in SNR with decreasing resolution (data not shown). This is expected, as with down-sampling to lower resolutions noise is reduced, but signal remains unchanged. Increasing SNR does not fully explain the peak TA performance at 2×2 mm2, as it declined at higher SNRs (lower resolutions above 2×2 mm2). The unique pattern of TA performance across different resolutions is likely a product of a variety of factors in addition to SNR, including TA-relevant parameters such as neighborhood size, pixel distance, and quantization levels. We used a pixel distance of 1, which translates to 0.5 mm in the 0.5×0.5 mm2 resolution data set and 2 mm in the 2×2 mm2. This could indicate that signal changes occur on a larger scale in ALS. To investigate this and uncover the robustness of TA, future studies should study effects of changing TA parameters at different image resolutions on classification accuracy in clinical data sets.
Previously we have shown that TA in T1-weighted images showed significant textural changes in the CST and the precentral gyrus using a novel 3D voxel-wise approach.Reference Maani, Yang, Emery and Kalra 23 In the present study, however, we did not acquire whole-brain T2-weighted images, which restricted our analysis to 2D. A study that used TA in ALS evaluated texture features from deep gray nuclei (DGN) structures in T1-weighted MRIReference Albuquerque, Anjos and Maia Tavares de Andrade 33 and found significant changes in texture features f 3, f 4, and f 17 between patients and controls. In our study, we observed different texture features to be significant because our ROI included the CST and was not specific to DGN structures. Various regions of the brain could have discrete textural changes depending on the imaging modality and local pathology. Very few studies have examined the relationship between MRI measures and pathological findings in ALS. An early study cited astrocytosis and iron deposition as the cause of T2-weighted signal changes in the motor cortex.Reference Oba, Araki and Ohtomo 34 Neuronal loss, myelin dysfunction, and astrocytosis have also been reported to cause altered T1-weighted signals in the motor cortex and subcortical WM of post-mortem ALS patients.Reference Meadowcroft, Mutic and Bigler 35 As texture features characterize MRI signal alterations, it is possible that the observed changes in texture are caused in part by the pathological correlates observed in previous studies.
There are several limitations in this study. First, we used an ROI that covered regions from the cortex to the cerebral peduncles and included GM and WM, whereas the visual assessment was performed primarily on the CST. Images could not be segmented into GM and WM owing to sub-optimal GM/WM contrast on T2-weighted images. Smaller region-specific ROIs were not compatible with TA at lower resolutions, because the neighborhood size was larger than the ROI. Observations from this study could therefore be from any tissue class in the ROI, and future studies should aim to perform TA on structure-specific locations. Second, recent studies have demonstrated improved sensitivity for detecting signal intensity changes using optimized T2-weighted FLAIR and susceptibility-weighted images.Reference Vázquez-Costa, Mazón and Carreres-Polo 36 The performance of TA methods could potentially improve if optimized sequences are used. Third, the study has a small sample size from a heterogeneous disease population. A larger sample with an equal number of patients and gender-matched control groups in a future study would provide more robust evidence. Last, data were down-sampled from high to low resolutions instead of additional data being acquired at lower resolutions.
Conclusion
This study demonstrated that TA using GLCM can discriminate between ALS patients and controls with T2-weighted MRI. Performance was optimal at 2×2 mm2 in-plane resolution. We believe that TA has the potential to be a marker for cerebral changes that occur in ALS. Future studies should apply TA methods to other MRI modalities such as magnetization transfer imaging and FLAIR to investigate its diagnostic performance in images with different contrasts. Larger studies with longitudinal data and disease controls are required for further validation.
Acknowledgments
This manuscript was supported by research grants from ALS Association, ALS Society of Canada, and CIHR.
Disclosure
AI, RM, JS, PS, DM, AHW, SN, and Y-HY do not have anything to disclose. SK has the following disclosures: ALS Association, ALS Society of Canada, Canadian Institutes of Health Research.
Statement of Authorship
AI designed the study, performed the analysis, and wrote the manuscript; RM designed the software for the study; JS performed the analysis; PS acquired the MRI data; DM recruited participants for this study; SK conducted the visual assessment for the MRI data; Y-HY conceptualized and designed the study; and SK conducted the visual assessment and conceptualized and designed the study. All authors reviewed and edited the manuscript.
Supplementary material
To view supplementary material for this article, please visit https://doi.org/10.1017/cjn.2018.267


