


1. Introduction
Services play an important role in economic development. Because services account for a significant share of total output in even very poor countries, the operation of services sectors matters for overall economic performance. The importance of services for development is augmented because of their role as inputs into production for a broad cross-section of industries, including agriculture as well as manufacturing. The cost, quality, and variety of services available in an economy helps determine the productivity of ‘downstream’ sectors. Services also matter for the achievement of the sustainable development goals (SDGs); improving access to health, education, and finance or enhancing connectivity through investment in information and communications technologies and transport and logistics networks all involve services activities.Footnote 1
Restrictive trade and investment policies may impact negatively on firms using services as inputs, reduce the competitiveness of services exporters, and increase prices and/or lower the quality of services available to households.Footnote 2 Trade in services is like trade in goods in allowing specialization according to comparative advantage, inducing competitive pressures and knowledge spillovers, but differs in that often it is more dependent on cross-border movement of providers, whether legal entities (firms) or natural persons (services suppliers). A consequence is that trade in services involves a much broader range of policy instruments than trade in goods (Francois and Hoekman, Reference Fiorini and Hoekman2010).Footnote 3
Well-known data weaknesses hamper analysis of how policies towards imports and exports of services, foreign direct investment, and, more generally, regulation affects the operation of services sectors. Although data on services activities in developing economies has been improving, in part as the result of periodic firm-level surveys that have resulted in large panel datasets (e.g., the World Bank enterprise surveys), comparable information on external service-sector policies of developing countries is very limited, information on policies is often patchy at best, and time series data on relevant policy variables generally are not available on a cross-country, comparable basis.
This situation began to change in the late 2000s with a World Bank project to collect information on services trade and investment policies and to create services trade restrictiveness indicators (STRIs) that constitute a numerical summary of applied services policies believed to affect trade flows (Borchert et al., Reference Borchert, Gootiiz and Mattoo2014). These STRIs in turn have been used to estimate sectoral ad valorem tariff equivalents for 103 countries (Jafari and Tarr, Reference Hoekman and Shepherd2017). The OECD has gone further than the World Bank by compiling STRIs for its member countries as well as major emerging economies that span a broader range of policies and services sectors, including both discriminatory and regulatory measures. The OECD STRI is available on an annual basis starting in 2014 and covers 45 countries. The general characteristics of the two STRI projects are set out in Table 1.
Table 1. Comparison of key characteristics of OECD and World Bank STRIs
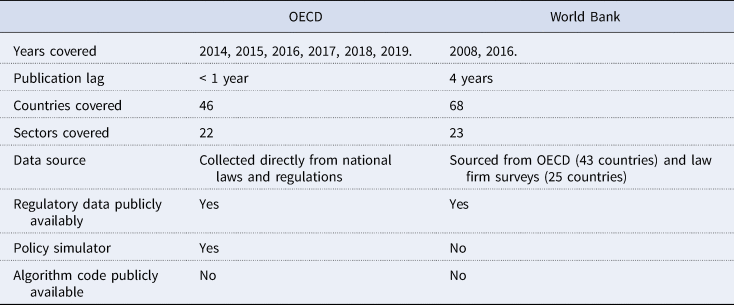
A problem for applied policy research on developing country services trade policies is that the OECD STRI database covers only a small number of emerging countries, while the World Bank STRI data are only available periodically, with the latest STRI covering 2016 policies released in early 2020. As a result, extant empirical research on developing country services trade policies has largely been constrained to cross-section analysis, using increasingly outdated information.
The 2020 edition of the World Bank STRI is supported by a collaborative data collection effort with the WTO secretariat. A first result of this joint venture was the publication in November 2019 on the jointly managed Integrated Trade Intelligence Portal (I-TIP) website of a database of applied services trade policies for the year 2016. These data span many emerging and developing economies as well as OECD member countries. In January 2020, the World Bank released its own STRI based on these data.
In this paper, we utilize the World Bank–WTO information on 2016 services policies to generate new indicators of services policy restrictiveness in eight services sectors for 23 countries not included in the OECD STRI.Footnote 4 The new data provide an opportunity to analyze services trade policies using information that post-dates the 2008 global financial crisis. In addition to developing a methodology to effectively extend coverage of the OECD index using the new data, we show that it is a strong predictor of bilateral services trade at the sectoral level.Footnote 5 Finally, we take advantage of the recent release of the World Bank's STRI to compare performance of the various indicators in an empirical setting.
A challenge in generating indicators of services trade policy from information on applied measures is the need to appropriately weigh and aggregate policies on a sector-by-sector basis. A contribution of this paper is to apply a machine-learning algorithm to the policy data to construct indicators that are broadly consistent with the STRI methodology used by the OECD in that they correlate well with the OECD STRIs. Because the full detail of the methodology used to produce the OECD indices is proprietary and not published, it is not possible to simply apply the OECD methodology to generate STRIs that are strictly comparable to those reported in the OECD database. A similar problem arises in relation to the World Bank STRI released in 2020. Although staff of both organizations have published papers outlining their methodologies, it is challenging for independent researchers to collect data for new countries and calculate compatible indices. Our approach provides a straightforward approach that researchers anywhere can reproduce to calculate their own STRIs based on newly collected policy data. An added benefit of our approach is that it highlights the individual policy measures that have the greatest explanatory power in terms of the sectoral STRIs and offers the perspective of streamlining data collection efforts in the future.
The plan of the paper is as follows. In Section 2, we discuss briefly the new data on 2016 services policies published by the WTO. Section 3 describes the methodology used to generate services policy indicators (SPIs) from this information. Section 4 validates the SPIs by assessing their ability to act as statistically significant predictors of trade flows using a standard structural gravity model of total trade and specific services sectors. Section 5 concludes.
2. New Data on Services Policies
In November 2019, the World Bank and WTO released an update to their jointly managed I-TIP platform containing extensive data on national services policies. In its raw state, the dataset includes 68 countries, 25 sectors, and three modes of supply: cross-border trade in services (Mode 1 in WTO speak), Mode 3 (establishment of a commercial presence in a foreign country – essentially foreign direct investment in a services sector), and Mode 4 (temporary cross-border movement of services suppliers). The data exclude Mode 2, where trade occurs through movement of consumers to a foreign country (e.g., tourism) as this is generally unrestricted.
The dataset pertains to policies observed in 2016 that potentially affect services trade. It has nearly a quarter of a million observations (244,949), distinguishing up to 445 different measures, both sector specific and horizontal. If attention is restricted to countries and sectors for which information is reported fully at the level of these individual measures, the coverage falls to 68 countries and 24 sectors.Footnote 6 I-TIP data are freely downloadable from the WTO website. Borchert et al. (Reference Borchert, Gootiiz, Magdeleine, Marchetti and Mattoo2019) discuss database creation, including sourcing and access. The source for 45 of the 68 countries is the OECD STRI database, so that I-TIP adds information on 23 countries not covered by the OECD (Appendix Table 1 lists the countries). As with the 2008 iteration of the World Bank STRI, questionnaires administered to law firms in the countries of interest generated the raw data, treated by the World Bank and WTO team to ensure consistency and correctness. Table 2, taken directly from Borchert et al. (Reference Borchert, Gootiiz, Magdeleine, Marchetti and Mattoo2019), lists the general categories of measures included in the database.
Table 2. Classification of World Bank/WTO services policy data

Source: Borchert et al. (Reference Borchert, Gootiiz, Magdeleine, Marchetti and Mattoo2019).
3. Constructing an Index of Services Policies from I-TIP Data
There are two key analytical decisions in designing an STRI given the choice to collect data on particular measures: weighting the measures and aggregating them into an index. The first problem can be solved through application of purely statistical methods, such as factor analysis, or by using external expert judgment, as in the OECD STRI, which is based on a weighting and aggregation system driven by expert input (Grosso et al., Reference Gootiiz and Mattoo2015). Aggregation is then by weighted sum. The World Bank STRI, by contrast, appears to use the judgment of World Bank analysts to motivate the mapping of measures to quantitative scores. Then aggregation uses a constant elasticity of substitution function with parameters chosen again by the judgment of World Bank analysts.
As noted above, the selection of I-TIP data we use span 455 individual policy measures in 68 countries and 24 sectors. The challenge is to produce an overall index of services policy by sector using those data. We use the OECD index as our basis for this problem because it appears to us to represent the best currently available STRI.Footnote 7 It is quite possible that a superior index will be designed in the future, but, at the present time, we do not believe there is a better benchmark than the OECD STRI. There is an active research program based on it, showing that the index is robustly linked with trade in services (e.g., Nordås and Rouzet, Reference Nordås2017) and investigating questions such as the extent and effects of regulatory heterogeneity (Nordås, Reference Miroudot and Shepherd2016, Reference Nordås2018) and the services content of regional integration in the EU (Benz and Gonzalez, Reference Benz and Gonzales2019).Footnote 8 Moreover, we are interested in showing the potential for commonplace statistical techniques to extend coverage of an index to new countries as additional data become available.
The first problem we address in this paper is how to extend the OECD STRI to the countries included in I-TIP but not in the OECD database. The purpose of undertaking this exercise is to show that commonplace quantitative methodologies can reproduce the STRI very well, even without the detailed information contained in the aggregation algorithm, which has not been made public. Our analysis illustrates it is possible to obtain a comparable index across all 68 countries quickly and at very low cost, without the need to develop a new methodology.
Equivalently, our problem can be seen as one of dimensionality reduction. We start with up to 445 individual policy measures per country in I-TIP and attempt to reduce those measures to one score per country–sector pair. Our objective in reducing dimensionality is to reproduce the OECD STRI as closely as possible.
This class of problem is well suited to a basic machine learning application. We construct a dataset containing OECD STRIs by sector and all horizontal and sector specific policy measures from I-TIP for all 68 countries for which full data are available. For the analysis to be feasible, we limit consideration to those sectors that correspond well between the two databases, taking simple averages of measures where necessary. This approach is made necessary by the different levels of aggregation in the data: subsectors in I-TIP, and more aggregate sectors in the publicly available OECD data. The result is to reduce the number of sectors we can work with easily to eight: accounting, legal, commercial banking, insurance, air transport, road freight transport, distribution, and telecom. We believe these sectors represent a large share of services activity in most countries. Although we lose some of the nuance in the I-TIP data – which distinguishes sectors at a micro level, such as insurance versus reinsurance, or air passenger transport versus air cargo transport – we believe this approach is justifiable given our overall objectives as set out above.
We split the sample into three groups. We randomly assign 75% of observations for which there is an OECD STRI to a training subsample, with the remaining 25% assigned to a prediction subsample. Finally, those countries and sectors where no OECD STRI is available are assigned to an out of sample prediction subsample. The basic empirical strategy is to apply machine learning models to the training subsample only, with the aim of using the disaggregated policy data to predict an index score by sector, which can then be compared with the OECD STRI. By having the model produce indices for the prediction subsample, we can assess how it performs on data that were not used for training. Once an appropriate model has been selected, it can be used to make out of sample predictions for countries not in the OECD data.
3.1 Developing Services Policy Indices with Simple Machine Learning
Machine learning refers to a family of techniques commonly used in computer science and data science, whereby statistical algorithms are used to find patterns in data, and to make predictions based on those patterns. These types of approaches power many familiar consumer interfaces, such as movie suggestions on Netflix, or predictive text in Google searches or Gmail emails. To date, machine learning has been applied infrequently in economics, but Athey and Imbens (Reference Athey and Imbens2019) identify features of machine learning techniques that can potentially be of use to applied economists. An important example of such an approach is Athey et al. (Reference Athey, Bayati, Doudchenko, Imbens and Khosravi2017), who use machine learning to assist in developing a causal inference framework. The remainder of this section sets out our general approach. Readers who do not require the technical background can skip to the next section.
We apply a type of machine learning model called an elastic net as a prediction tool. The model itself can be understood as similar to the standard regression framework familiar to economists, with independent variables (inputs) and a dependent variable (output), with the relationship between the two summarized in a set of coefficients that are estimated by solving an optimization problem. In this case, the input is the set of policy measures from I-TIP, and the output is the OECD STRI. Model selection and performance assessment proceed by comparing the model's predictions of the STRI with what is observed. A good model is one that uses the inputs to reproduce the OECD's STRI to a high degree of accuracy, and which exhibits similar accuracy for the subsample of data used to train the model, and the remainder of the sample that was not used in training. A subsidiary consideration is model parsimony, namely the ability to achieve strong predictive performance while using a relatively small number of variables. The machine learning techniques we use automatically drop policy measures (inputs) with little explanatory power for the OECD STRI (the output) and identify a set of policy measures that have the greatest explanatory power, typically much smaller than the starting data set. We discuss the policy implications of this feature of the algorithms below.
In technical terms, the elastic net solves the following problem, where  $\hat{\beta }$ is the vector of parameters of interest:
 $$\hat{\beta } = {\rm argmi}{\rm n}_\beta \left\{{\displaystyle{1 \over {2n}}\mathop \sum \limits_{i = 1}^n {\lpar {y_i-x_i{\beta }^{\prime}} \rpar }^2 + \lambda \left[{\alpha \mathop \sum \limits_{\,j = 1}^p \vert {\beta_j} \vert + \displaystyle{{1-\alpha } \over 2}\mathop \sum \limits_{\,j = 1}^p \beta_j^2 } \right]} \right\}$$
The first term is the standard ordinary least squares (OLS) loss function. λ is a penalty term that shrinks parameter estimates towards zero in two ways, with a higher parameter resulting in greater shrinkage. The first term in square brackets penalizes coefficients that are large in absolute value, while the second performs shrinkage based on the square of the parameter value. With λ = 0, the elastic net collapses to standard OLS. With nonzero λ and α = 1, it is the least absolute shrinkage and selection operator (LASSO), while with α = 0, it is ridge regression. The essence of the procedure is that λ is iterated for given values of α, with zero coefficients dropped from the model progressively due to the shrinkage effect. Iteration continues until a model is selected based on its cross-validation performance, i.e. the ability of a model estimated on the training subsample only to produce close estimates of the values in the prediction subsample. By proceeding in this way, we can identify a subset of variables that have the best explanatory power in terms of the observed OECD STRI, and then use the estimated values from the elastic net regression to predict values out of sample, where no OECD STRI exists.
The elastic net is well suited to prediction problems with large numbers of potential predictors, even exceeding the number of observations, and deals well with situations where they are closely correlated. These characteristics are unlike OLS, where the number of potential predictors cannot be greater than the number of observations. More fundamentally, the objective of OLS is typically inference, whereas the objective of the elastic net is prediction. As a result, we do not report standard errors or statistical significance, which are typically important outputs of an OLS model. Instead, we report cross-validation performance, namely the ability of the model to make predictions that closely track observed values in the subsample not used to train the model in the first place.
To power the tool, we construct a set of explanatory variables that is all sectoral policy measures from I-TIP, all horizontal policy measures from I-TIP, and a set of sector dummies. We then also create interactions to allow for nonlinear effects and dependencies. Specifically, we interact all policy measures with all other policy measures, and we create a triple interaction between all horizontal policy measures, all sector specific policy measures, and the sectoral dummies. The I-TIP dataset contains missing entries for many response variables, presumably because they are believed to only be relevant to certain sectors. To facilitate the empirical analysis, we therefore code these missing values as zero, which means that they do not have any restrictive impact on trade in sectors where World Bank and WTO analysts have made an a priori determination of no effect.
Proceeding in this way gives a dataset of 544 observations, which is eight sectors for 68 countries. By interacting all the potential explanatory variables, as set out above, we have 16,974 variables. Many of those variables are constant within subsamples, often zero, and so are automatically dropped from the model. In practice, the elastic net works with a starting set of 1,606 variables. A standard regression technique like OLS cannot handle this problem given the number of observations, but the elastic net can, because the optimization problem has kinks due to the absolute value and square terms. Since OLS is unavailable we use two other dimension reduction techniques on the sectoral and horizontal measures to give a point of comparison but ignoring interaction terms: principal factor analysis and a simple mean. In both cases, we apply the relevant measures to the disaggregated policy data at the level of sectors, to produce a single index that summarizes, according to the assumptions of each, the variation in the disaggregated policies. As a robustness check on our machine learning models, we also set α = 1, which yields LASSO estimates, and α = 0, which yields ridge estimates.
Given that the problem in this case is prediction, not inference, we do not report coefficient estimates. For the training sample (272 observations), the elastic net retains 59 variables, a mix of measures in levels and interactions, and selects α = 0.25. The LASSO retains 55 variables, while the ridge estimator retains the full set of informative variables, namely 1,606. Table 3 summarizes the performance of the three machine learning methods, looking separately at the training and prediction subsamples.
Table 3. Output from Elastic Net, LASSO, and ridge applications to OECD STRIs using I-TIP data in levels and interactions

The three methods perform quite similarly on the training subsample: model fit is tight considering the relatively small amount of information used. The mean value of the OECD STRI is 0.279, so a mean squared error of only 0.005 using the elastic net indicates that model fit is good. Comparing the two parts of Table 3 shows that of the three machine learning methods, the elastic net has the best performance: R2 is highest both on the training and prediction subsamples. We therefore prefer the elastic net's predictions, but we note that it is relatively close in performance to the other two models.
Table 4 reports the correlations at the sectoral level among the various measures computed as described above. The elastic net again is the strongest performer on this overall criterion, although the other two machine learning methods also perform well. The comparator indices, constructed using principal factor analysis and a simple mean, have a negative correlation with the OECD index, and thus represent a radically different way of summarizing the data. The evidence in Table 4 suggests that the OECD approach to weighting and aggregating measures results in an output that is substantially different from what can be obtained by naïve methods that focus only on the characteristics of the data, without using external knowledge on the effects of particular policies. It is an important finding that the OECD index, and by extension, ours, does not correlate strongly or even positively with naïve measures. But our three simple machine learning applications, using limited data, do a remarkable job of reproducing the OECD index. Moreover, our preferred method, the elastic net, produces predicted values that lie exclusively between zero and unity, as does the original OECD index. The alternative approaches do not have this property, nor would a simple OLS regression model. Given that the indices only have an ordinal interpretation, it is useful to investigate the rank correlation as well. We find that the OECD STRI and our SPI have a rank correlation coefficient of 0.788, which is again evidence of a strong correspondence between the two measures.
Table 4. Correlation between OECD STRI and alternative services policy index (SPI) estimates (common sample)

Figure 1 shows the correlation in a common sample of elastic net predictions for all countries in the I-TIP sample, i.e. those already covered by the OECD and those that are new, which we name the Services Policies Index (SPI), and the OECD STRI at the sector level. The association with the OECD index is not perfect, as would be expected with any statistical approach to reproduction of an existing index, but the figure shows that our SPI fits the original data well, which gives us confidence that out of sample estimates for the countries not in the OECD database should perform well, in particular given the similarity of the R2 measures for the training and prediction sub-samples, as noted above. Summary statistics show that the new countries added to the sample are more restrictive than those in the original OECD sample, with an average STRI across sectors of 0.333 compared with 0.281; however, ranges in both cases are wide: the new countries have scores ranging from 0.096 to 0.872, compared with 0.157 to 0.960 for those in the OECD sample.

Figure 1. Correlation between the STRI and SPI, sector level (common sample)
To avoid terminological confusion in what follows we refer consistently to the OECD STRI as the STRI. Our constructed indices based on I-TIP data are referred to as Services Policy Indices (SPIs). The difference in terminology highlights that we are simply mimicking the OECD's original approach using a broader dataset. Ownership of the full methodology used to produce the OECD's indices lies with that organization, and we use a commonplace data-driven technique to extend database coverage.
4. Validating the SPI with Trade Data
We have already shown that our SPI closely mirrors the OECD's STRI, in our view currently the best available benchmark for measuring applied services policies. An important additional step in validating the SPIs is demonstrating their ability to act as statistically significant predictors of trade flows. Thus far, we have not used any information on trade flows to produce the SPI, but only the weights implied by the OECD's expert judgment system, which we have mimicked using machine learning. This second step is therefore quite independent of the first, and is designed to show that our index has explanatory power for bilateral trade, which we believe is an important criterion for any index that seeks to measure services trade policies.
We estimate a standard structural gravity model of services trade at the sectoral level in line with current best practice, as embodied by Anderson et al. (Reference Anderson, Larch and Yoto2018). Estimation is by Poisson Pseudo Maximum Likelihood (PPML), which means that estimates are robust to heteroskedasticity, take account of zero flows, and produce fixed effects (by exporter and by importer) that correspond exactly to the quantities prescribed by theory in Anderson and Van Wincoop (Reference Anderson and Van Wincoop2004)-type models (Fally, Reference Egger, Francois, Hoekman, Manchin, Francois and Hoekman2015).
The gravity model takes the following form, considering a single year and single sector cross-section only:
 $$X_{ij} = F_iF_jt_{ij}^{-\theta } e_{ij}\;$$
where: Xij is exports from country i to country j; the F terms are exporter and importer fixed effects; tij is bilateral trade costs; θ is a parameter capturing the sensitivity of demand to cost; and eij is an error term satisfying standard assumptions.Footnote 9 Trade costs t are specified in the usual iceberg form. These costs are unobserved but can be specified in terms of observable proxies. For present purposes, we include standard gravity model controls based on geography and history, and an indicator of service sector restrictiveness (STRI for presentational purposes), as well as an interaction between the STRI and a dummy for countries that are members of an Economic Integration Agreement (EIA) under Article V of the GATS, the services equivalent of a PTA for goods. Formally:
 $$\eqalign{ -\theta logt_{ij} = & \,b_1STRI_j\ast intl_{ij} + b_2EIA_{ij} + b_3STRI_j \ast intl_{ij} \ast EIA_{ij} + b_4\log \lpar {distance_{ij}} \rpar + b_5contiguous_{ij} + \cr & b_6colony_{ij} + b_7common\;language_{ij} + b_8common\;colonizer_{ij} + b_9same\;country_{ij} + intl_{ij}} $$
Table 5 provides variable definitions and sources, along with those for equation (1). Apart from trade flows, the data sources are largely standard. Equation (1) should in principle cover all directions of trade, i.e. including trade from country i to country i, or intra-national trade. Inclusion of intra-national trade data is crucial for PPML to produce theory-consistent fixed effects estimates (Fally, Reference Egger, Francois, Hoekman, Manchin, Francois and Hoekman2015). International trade data do not include this term, so we use the Eora multi-region input–output table to do the job.Footnote 10 Eora covers 183 countries and 26 sectors through a single harmonized input–output table. We use data for 2015 only, the latest available year, corresponding most closely to the year of our SPI data (2016).
Table 5. Variables, definitions, and sources

In sector by sector regressions, the STRI is a country-specific variable and so is collinear with the importer fixed effects. To achieve identification, we follow Heid et al. (Reference Grosso, Gonzales, Miroudot, Nordås, Rouzet and Ueno2017) in interacting it with intl, a dummy equal to unity for trade between different countries, and zero for internal trade. The reason for this approach is that the STRI has a differential impact on domestic and foreign service providers, which is a key aspect of the rationale for the index in the first place. We divide the World Bank STRI by 100, so that it is on the same scale as the other policy indicators.
As noted above, our SPI data start from 24 sectors defined in the World Bank/WTO dataset, which we concord to eight sectors in the OECD STRI classification. We then further concord those data to four Eora sectors by taking simple averages of the relevant indices: distribution, finance and business services, telecom, and transport. It is not possible to estimate gravity models at a more detailed level as the Eora database in harmonized form is necessarily highly aggregated.
A second point that requires explanation is the interaction term between services policies and EIA membership. The services policies in I-TIP apply on a most favored nation (non-preferential) basis, which is why we map them to MFN policies from the OECD data. The OECD has collected preferential data for services trade within the EU, but there is no systematic dataset covering preferential services policies around the world. However, many countries are members of trade agreements that hope to boost exports between their members, relative to the MFN benchmark. By interacting MFN policies with a dummy for joint EIA membership, we seek to capture that effect. An EIA in this context is effectively a trade agreement for services, under Article V of the GATS. Our expectation is that the coefficient on MFN policies will be negative (trade reducing), while the coefficient on the interaction term will be positive (showing that trade reduction is attenuated by regional integration). Benz and Gonzalez (Reference Benz and Gonzales2019) show conclusively in the case of the EU that intra-bloc services policies are far more liberal than those pertaining to non-EU countries.
Table 6 reports gravity model regression results for the distribution sector. Column 1 includes the OECD STRI, and as expected, the policy variable has a negative coefficient, while the interaction term with EIA membership has a positive one, with both estimates statistically significant at the 10% level. The same is true for the World Bank STRI, which is included in column 7. The baseline data therefore support the view above that the measures captured by the STRI tend to restrict trade, in line with Nordås and Rouzet (Reference Nordås2017), with that effect attenuated by joint membership of a trade agreement covering services. The same patterns of signs and magnitudes applies for four SPIs, elastic net, LASSO, ridge, and principal factors. The simple mean has no statistically significant coefficients. We therefore conclude that the most naïve of our testbed of SPI measures does not have significant predictive value for trade, but that other measures that attempt to summarize the available data more systematically do have such power.
Table 6. Gravity models for distribution services using different measures of services policies

Note: All models are estimated by PPML Robust standard errors adjusted for clustering by country pair in parentheses below parameter estimates. Statistical significance is indicated as follows: * (10%), ** (5%), and *** (1%).
Table 7 repeats the exercise for financial and business services. Results are similar to those for distribution. The elastic net, LASSO, and ridge SPIs perform somewhat better than the OECD STRI and on par with the World Bank STRI, in that the levels term and the interaction term both have coefficients with the expected signs and magnitudes, and are statistically significant at the 5% level or better. This is largely due to increased sample size for the SPIs; additional results, available on request, show that results for the SPI are less precisely estimated on the smaller sample for which the OECD STRI and the SPI are both available. Column 1 contains data on 183 exporters and 45 importers, while the following five columns all use 183 exporters and 68 importers. The principal factors SPI does not have any statistically significant coefficients, while the simple mean SPI has a negative and 1% statistically significant coefficient in levels, but a statistically insignificant coefficient for the interaction term. The most naïve measures of services policies again have at best limited explanatory power, in contrast to more sophisticated measures like the STRI and the SPIs.
Table 7. Gravity models for finance and business services, STRI and SPIs

Note: All models are estimated by PPML. Robust standard errors adjusted for clustering by country pair are in parentheses below parameter estimates. Statistical significance: * (10%), ** (5%), and *** (1%).
Table 8 reports results for telecom services. The pattern of findings is again quite similar: the STRIs, as well as the elastic net, LASSO, and ridge SPIs, all have explanatory power for bilateral trade flows in this sector, although none of the interaction terms except for the LASSO model has a statistically significant coefficient, which suggests that regional integration may not be a strong force for global trade in this sector. By contrast, the principal factors and simple mean SPIs have positive and 1% statistically significant coefficients, which is contrary to expectations.
Table 8. Gravity models for telecom services using different measures of services policies

Note: All models are estimated by PPML. Robust standard errors adjusted for clustering by country pair in parentheses below parameter estimates. Statistical significance: * (10%), ** (5%), and *** (1%).
Finally, Table 9 presents results for the transport sector. Both STRIs, elastic net SPI, and ridge SPI all have 5% statistically significant coefficients or better in levels and on the interaction term. By contrast, the principal factors SPI and the simple mean SPI do not have any statistically significant coefficients. Results for this sector therefore accord well with those from the other sectors.
Table 9. Gravity models for transport services using different measures of services policies

Note: All models are estimated by PPML with importer and exporter fixed effects. Robust standard errors adjusted for clustering by country pair. Statistical significance: * (10%), ** (5%), and *** (1%).
As is typical for gravity models that include intranational trade data, there is evidence of home bias in all regressions: the intl dummy is consistently negative and statistically significative. Also of interest is the finding that, in some specifications, the effect of an EIA effectively neutralizes the negative trade impact of the SPI or STRI. While deserving of further research, this result suggests that some regional agreements do a good job of facilitating services trade beyond the level that would be expected based on MFN policy settings.
Taken together, these results indicate that the OECD STRI has much greater explanatory power for bilateral trade flows in services than naïve measures like a principal factor or simple mean. The same is true of the World Bank STRI, which is unsurprising given how closely correlated it is with the OECD index (rho = 0.8). Moreover, our three SPIs generally exhibit very similar performance to the OECD STRI, albeit with a substantially larger sample due to greater importer coverage. The difference in number of observations is just over 50%, so there are clear advantages to these extended measures based on data collected by the World Bank/WTO but aggregated into indices based on our machine learning-based reproduction of the OECD's approach. Given the strong and consistent explanatory power of the STRI and its derivative SPIs, the bar for producing a ‘better’ indicator of services trade restrictions is very high. In the absence of substantial additional benefits, it is far from obvious that further work in this area – in the sense of changing weights or adopting different aggregation schemes – passes a cost–benefit test, given the substantial time and resources that need to be devoted to dealing with the problems of weighting and aggregation discussed above.
To convert these results into more usable form, we reformulate the trade costs function to express the elastic net SPI in ad valorem equivalent (AVE) terms, following Benz (Reference Benz2017):
 $$ AVE_j\equiv t_{ij}-1 = \exp \left( {\displaystyle{{-\beta SPI_j} \over \theta }} \right)-1 $$
Full results are presented in Appendix 2 (see on-line supplementary material). The advantage of presenting results in AVE terms is that it provides a simple number that can be compared across countries. It also shows that on a comparable standard, levels of restriction in services trade are typically higher than in goods. However, the AVE concept makes some significant simplifications, including by assuming that the bundle of regulatory measures captured by the SPI has economic effects like those of a tariff. While that may be true for some measures, it may not be for others, especially those that affect competitive conditions in the marketplace or influence the fixed costs of market entry. We therefore present AVEs subject to these caveats.
While any indicator of services trade restrictiveness should be a strong predictor of bilateral services trade, recent work has shown that because of the input–output relationships that exist between services and other sectors, it is also likely that services policies affect total trade (i.e., goods and services).Footnote 11 We test this hypothesis and the predictive power of our SPIs compared with the STRI using aggregate Eora data summed across all 26 goods and services sectors in the database. The specification is the same as in the preceding tables, except that we use a dummy for PTA rather than EIA membership, to capture goods agreements as well as services agreements, and we include the log of the applied tariff rate as an additional explanatory variable. We aggregate the OECD STRI and our SPIs by taking simple averages across sectors, while the World Bank STRI is provided with a separate aggregate indicator.
Table 10 reports the results. We again use the full sample, but as tariff data are not available for all country pairs, sample size falls. Both STRIs, elastic net and ridge SPIs have the expected negative coefficients, and all four variables also have positive coefficients on the interaction term with the EIA variable, with all estimates statistically significant at the 1% level. The simple mean SPI also displays this pattern of coefficients, but the principal factor SPI has unexpected signs.
Table 10. Gravity models for total trade (goods and services), STRI and SPIs
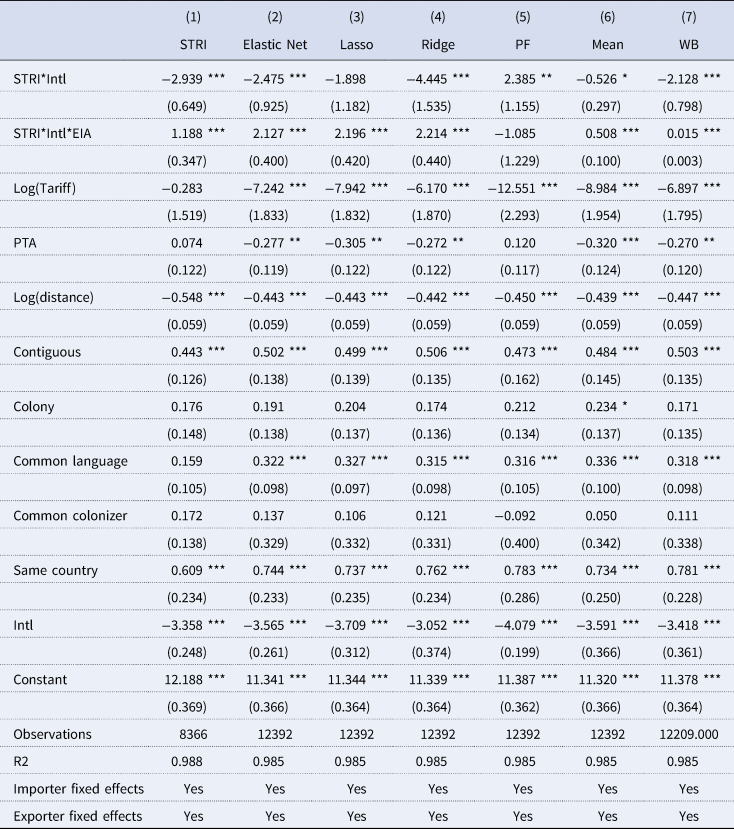
Note: Robust s.e. adjusted for clustering by country pair. Statistical significance: * (10%), ** (5%), *** (1%).
The World Bank STRI performs similarly to the OECD index or our SPIs. The only result that is contrary to expectations is the negative sign on PTA, but this is likely due to the fact that there is also an interaction term with EIA – an element of the PTA variable – that creates a correlation between the two. A similar issue arises in relation to tariffs, which are negatively correlated with PTA membership. Other variables perform largely in accordance with expectations.
The conclusion we draw in this section is that the OECD STRI, and the extended version with 23 additional countries that we have termed the SPI, is a robust predictor of bilateral trade at the sectoral level for services, and also at the aggregate level for goods and services. We interpret this as showing that the indices capture important features of services trade policy.
5. Conclusion
This paper provides new evidence on the state of services policies in 23 non-OECD countries in 2016, based on regulatory data released by the World Bank and WTO. Starting from the premise that the OECD STRI represents a proven approach to summarizing the restrictiveness of services policies, we use simple machine learning techniques to estimate SPIs for the new data that correlate very closely with OECD measures within sample, and therefore essentially constitute an extension of the OECD methodology to an additional set of mostly developing countries. Our SPIs provide the first quantitative snapshot of applied services policies in a significant number of developing countries since the World Bank's 2008–11 STRI.Footnote 12 They have significant explanatory power for bilateral trade flows at the sectoral and aggregate levels.
A contribution of this paper to the literature is to provide a proof of concept for the use of statistical tools, such as machine learning, to capture the complexities, nonlinearities, and dependencies of different services policy measures. This is relevant for at least two reasons. One is that the use of such techniques allows analysts to extend datasets in instances where a given source of information is limited to a subset of countries and the detailed methodology used to calculate published indicators is confidential. This is the case for the OECD STRI, arguably the current ‘best in class’ at the time of writing given extensive industry consultation and expert input into the weighting of measures across sectors. Insofar as other organizations – in this case the World Bank and WTO – collect similar types of policy data, SPIs that correlate well with the OECD STRIs offer a way to extend the country coverage of services restrictiveness indicators. Although our focus is on services trade restrictions, the methodology may be useful in other contexts where similar conditions prevail as regards the scope and periodicity of efforts to collect information on policies for a given area.
More generally, the use of statistical tools may help to identify potential ways to reduce data collection costs. The OECD STRI involves the collection of a large amount of data, entailing significant direct and time costs for agencies. Further work with machine learning algorithms like those deployed here may identify a subset of measures that in fact do most of the explanatory work. In our view, this is the primary value of generating these kinds of indices, rather than simply summarizing a vast amount of data in a single number. Data collection is distinct from research to fine-tune STRI methodologies and improve the associated weighting and aggregation measures. The latter is very important but should be independent of the policy collection process. Analysts should have the ability to define their own indicators, and it is therefore very welcome that I-TIP has released the 2016 services policy information independently of associated STRIs.
Although the release of services trade-related policy data in I-TIP is laudatory, as of 2020 the most up-to-date compilation of such measures will be for 2016, and then only for some 30 developing countries – without any coverage of most low-income countries. It is unknown whether and when a new wave of data will be collected and thus whether over time a panel dataset will emerge. Greater effort to generate services policy data on a regular basis for a broad range of countries would allow governments to track their policies, compare them to those of other countries, and inform autonomous policy reforms and regional integration processes. The resource costs of a systematic effort to collect services policy data are not large. Focusing on just five major sectors per country and seeking to cover 50 non-OECD countries would, based on our prior experience (e.g., Shepherd et al., Reference Shepherd, Helble and Shepherd2019a,Reference Shepherd, Décosterd, Castillo Comabella and Stivasb), involve costs in the range of $400,000 to $750,000, with additional resources required for reporting and publishing, though they would be an order of magnitude less than those required for data compilation. Doubling coverage to 10 sectors would involve an investment of less than $2 million. Average costs could be reduced by making the data collection a bi-annual process. Similarly, application of machine learning to reduce the burden of data collection could perhaps reduce these numbers by half.
Given how limited services policy data are relative to information on merchandise trade policies, allocating this level of resources to filling the gap would have a very high cost–benefit ratio, especially if one considers the opportunity costs of not having up-to-date information on services policies. These opportunity costs may be high, not least because absence of data means policymakers may be less inclined to devote adequate attention to this important area of policy.Footnote 13 Similarly, important research questions, such as the possibility for heterogeneous policy effects across different countries, cannot be investigated in the absence of additional data, collected and disseminated at regular intervals.
One priority in this regard is to incorporate the preferential dimension into measures of services policy restrictiveness. Another is to expand country coverage. In particular, very few African countries are included in I-TIP. Given the salience of regional integration in Africa, it is important to fill in the policy blanks to allow assessments of the utility of dealing with services in the context of pursuing continental free trade. Benz and Gonzalez (Reference Benz and Gonzales2019) have shown that the EU single market for services is much more liberal than any member country's MFN policies. The extent to which other trade agreements effectively liberalize services markets is unclear but is a vital policy question in an environment where bilateral, plurilateral, and mega-regional agreements are becoming more common. Shepherd et al. (Reference Shepherd, Helble and Shepherd2019a) find little evidence of substantial liberalization in the Canada–EU Trade Agreement (CETA). The same appears to be true for the Comprehensive and Progressive Trans-Pacific Partnership (CPTPP) (Gootiiz and Mattoo, Reference Francois and Hoekman2017).
A related important question concerns the value of making binding policy commitments in trade agreements, even if these do not entail liberalization. The ‘water’ in the services policy commitments in trade agreements often is considerable (see, e.g., Borchert, Gootiiz, and Mattoo, Reference Borchert, Gootiiz, Mattoo, Martin and Mattoo2011; Miroudot and Shepherd, Reference Miroudot and Pertel2014; Miroudot and Pertel, Reference Lamprecht and Miroudot2015; Ciuriak et al., Reference Ciuriak, Xiao and Dadkhah2017). Research on the value of reducing the difference between bound and applied services policies has shown that this may be an important source of welfare gain, driven by a reduction in policy uncertainty (Lamprecht and Miroudot, Reference Jafari and Tarr2018; Ciuriak et al., Reference Ciuriak, Dadkah and Lysenko2019; Egger et al., Reference Egger and Larch2019).
Again, such analysis requires good quality, comparable information on applied policies collected regularly. The OECD does this for its members – and is the source for the majority of the 68 countries for which I-TIP reports comprehensive information. Looking forward, we hope this gap will be filled for developing countries by agencies with appropriate mandates.
Supplementary Materials
To view supplementary material for this article, please visit https://doi.org/10.1017/S1474745620000439.
Acknowledgements
We are grateful to the Editor (Alan Winters) and two reviewers for helpful comments and constructive suggestions on an earlier draft.
Appendix 1: I-TIP Additional Country Coverage


 Open access