


Introduction
Weeds are the most significant pest in wheat worldwide (Oerke Reference Oerke2006). Previous estimates of global wheat yield loss due to weeds were 9.8% (Cramer Reference Cramer1967) and 12.3% (Oerke et al. Reference Oerke, Dehne, Schönbeck and Weber1994). In 2006, Oerke estimated the worldwide potential wheat loss to be 23.0% with a range of 18% to 29% and actual loss of 7.7% with a range of 3% to 13%. The Weed Science Society of America (WSSA) Weed Loss Committee generated reports in 1984 (Chandler et al.) and 1992 (Bridges) that summarized crop losses due to weeds across the United States and Canada. Chandler et al. (Reference Chandler, Hamill and Thomas1984) reported an estimated 9% to 20% wheat yield loss with an average of 13% across the United States and 5% to 15% wheat yield loss across Canada due to weeds. Bridges (Reference Bridges1992) reported 1% to 20% wheat yield loss due to weeds across the United States using then-current management (i.e., best management practices [BMPs] with herbicides); BMPs but no herbicides resulted in 3% to 60% wheat yield loss. In a summary of yield loss due to weeds in Canada, Swanton et al. (Reference Swanton, Harker and Anderson1993) reported 5% to 15% wheat yield loss.
Wheat was harvested from more than 218.5 million ha in 2017, the largest area of any crop in the world (FAO 2017). Wheat production is second only to corn, with 771.7 billion kg produced worldwide in 2017 (FAO 2017). Canada and the United States accounted for 4.1% and 8.3%, respectively, of the world’s wheat production between 2007 and 2017 (Figures 1 and 2), with an average production value of US$6.02 and US$12.7 billion, respectively (FAO 2017). A significant proportion of wheat production in North America is exported. In 2018 to 2019, the United States exported 27.2 billion kg of wheat (about 50% of production), whereas Canada exported 18.2 billion kg (about 90% of production). Export partners demanded that North American wheat remain free of transgenic varieties (Paarlberg Reference Paarlberg2014). As a consequence, no transgenic herbicide-resistant wheat is produced in North America, in stark contrast to corn, soybean, and cotton.
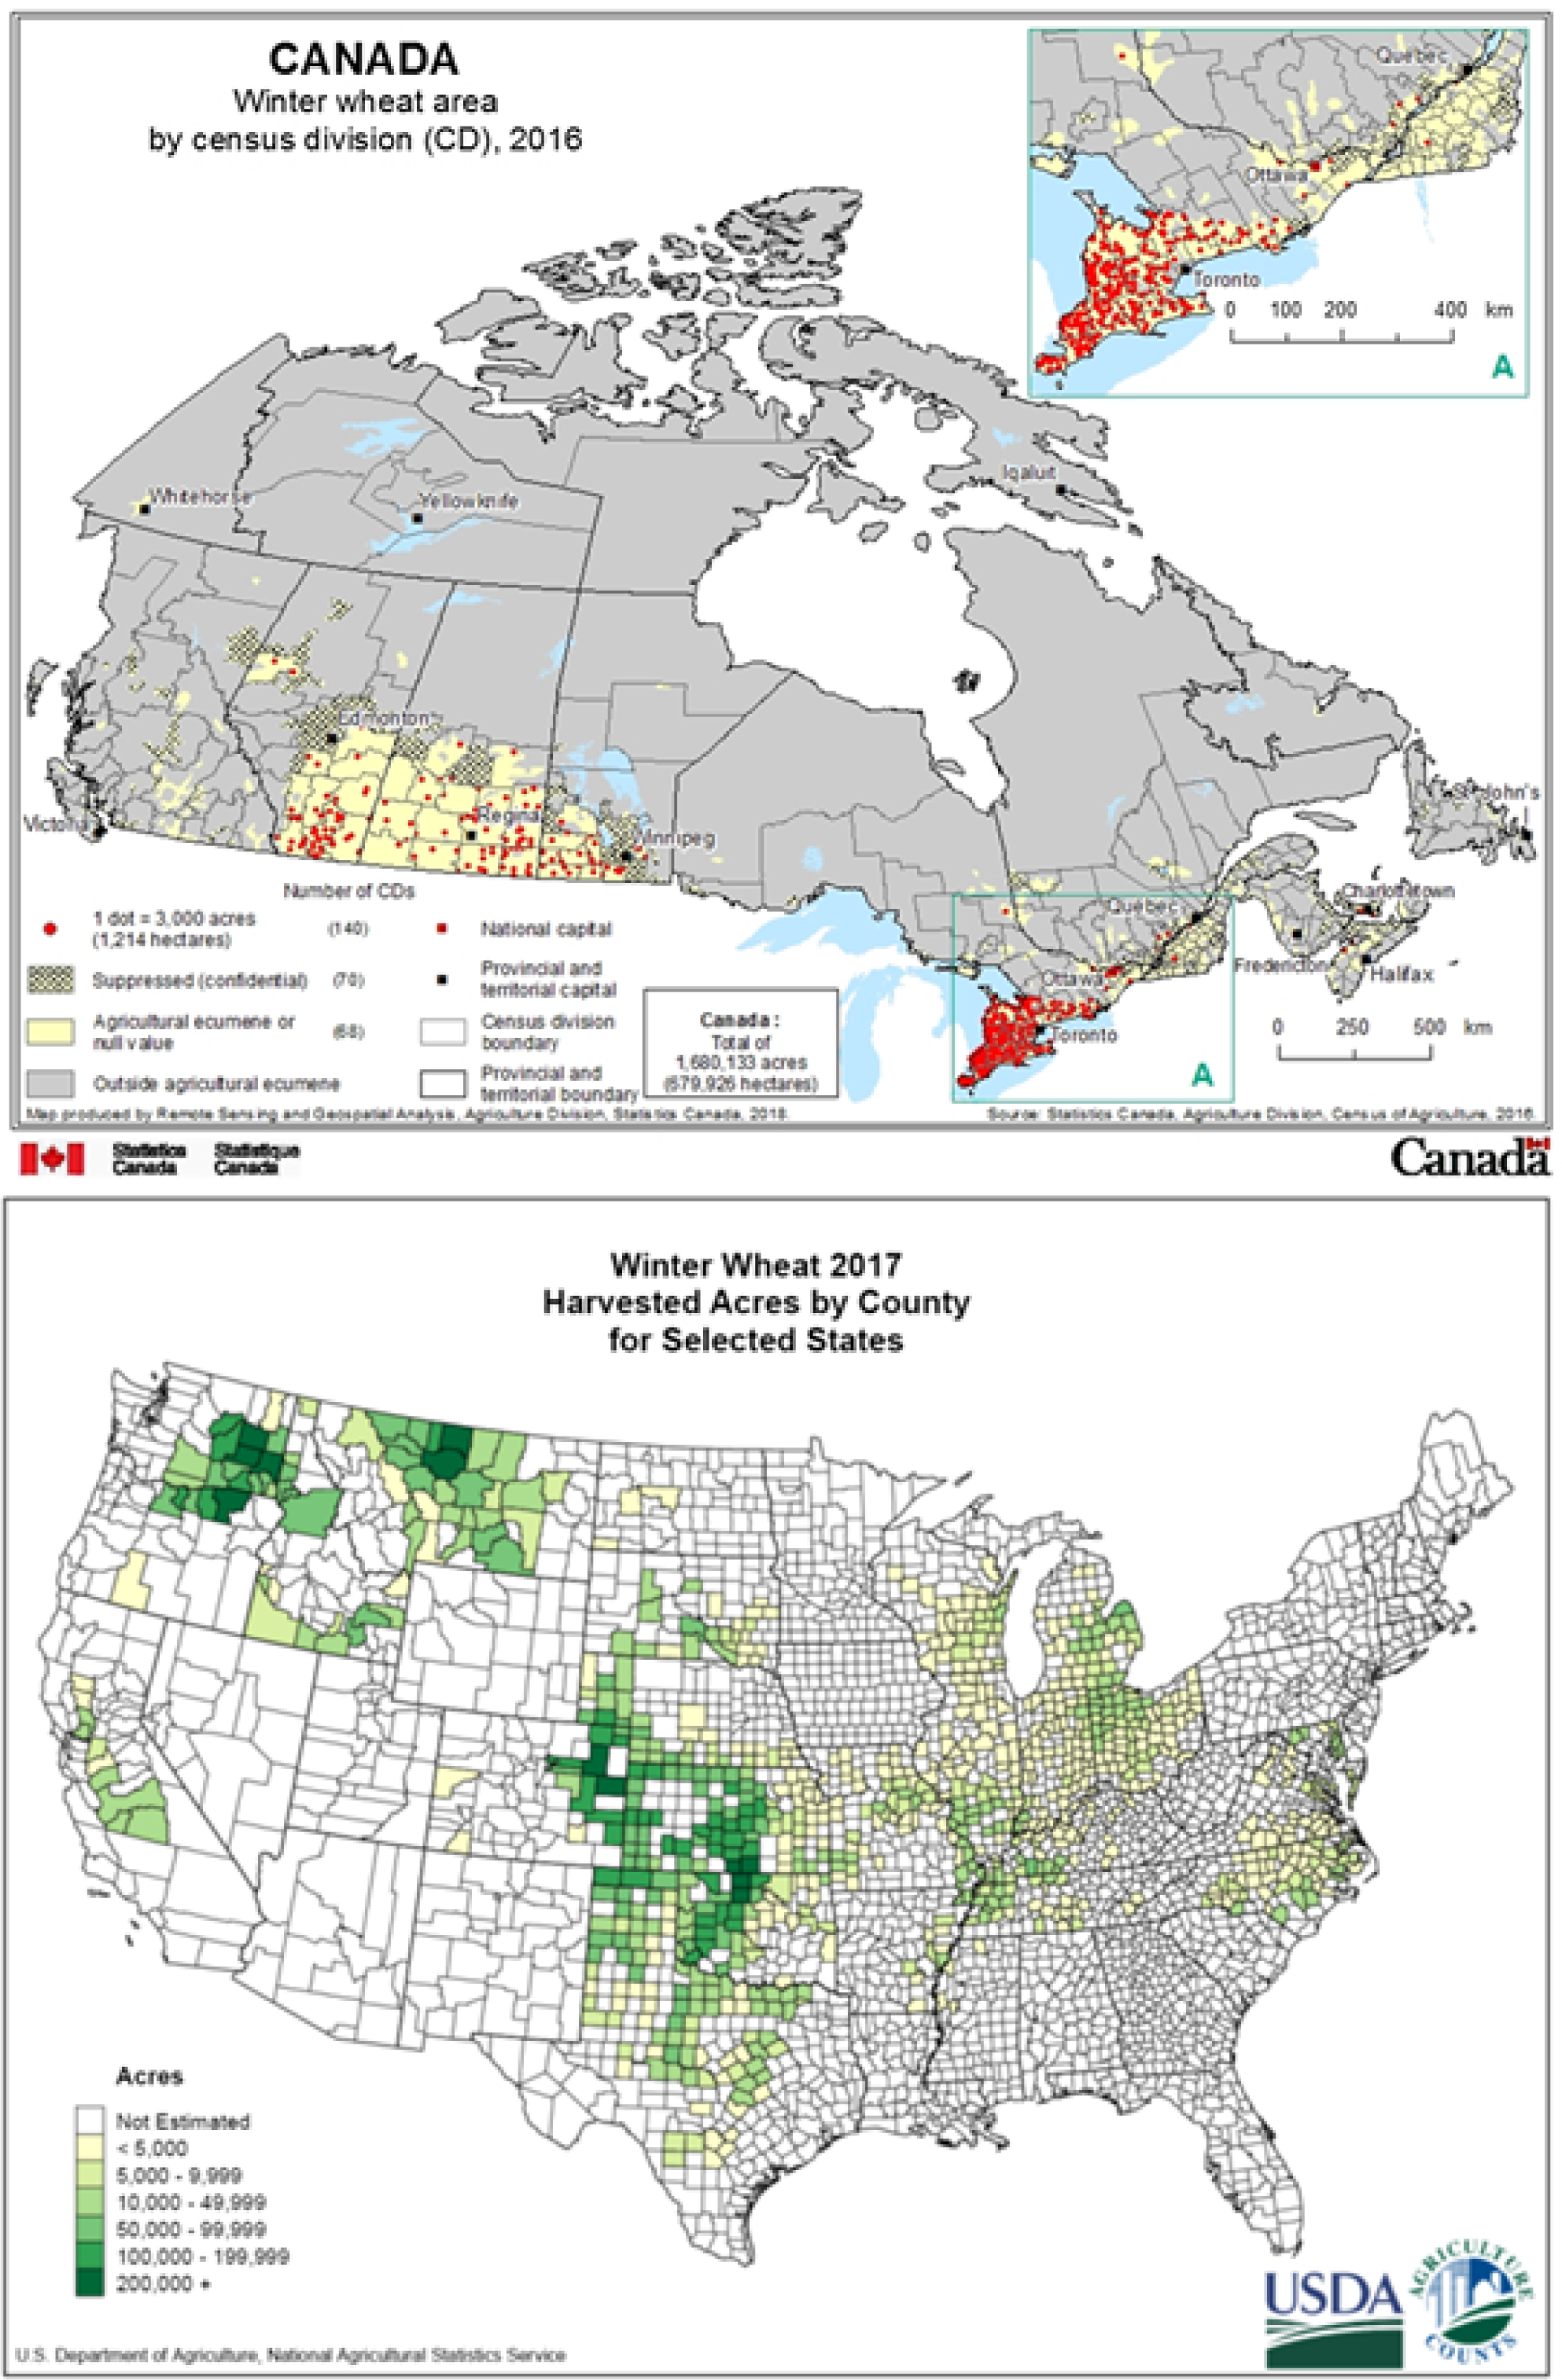
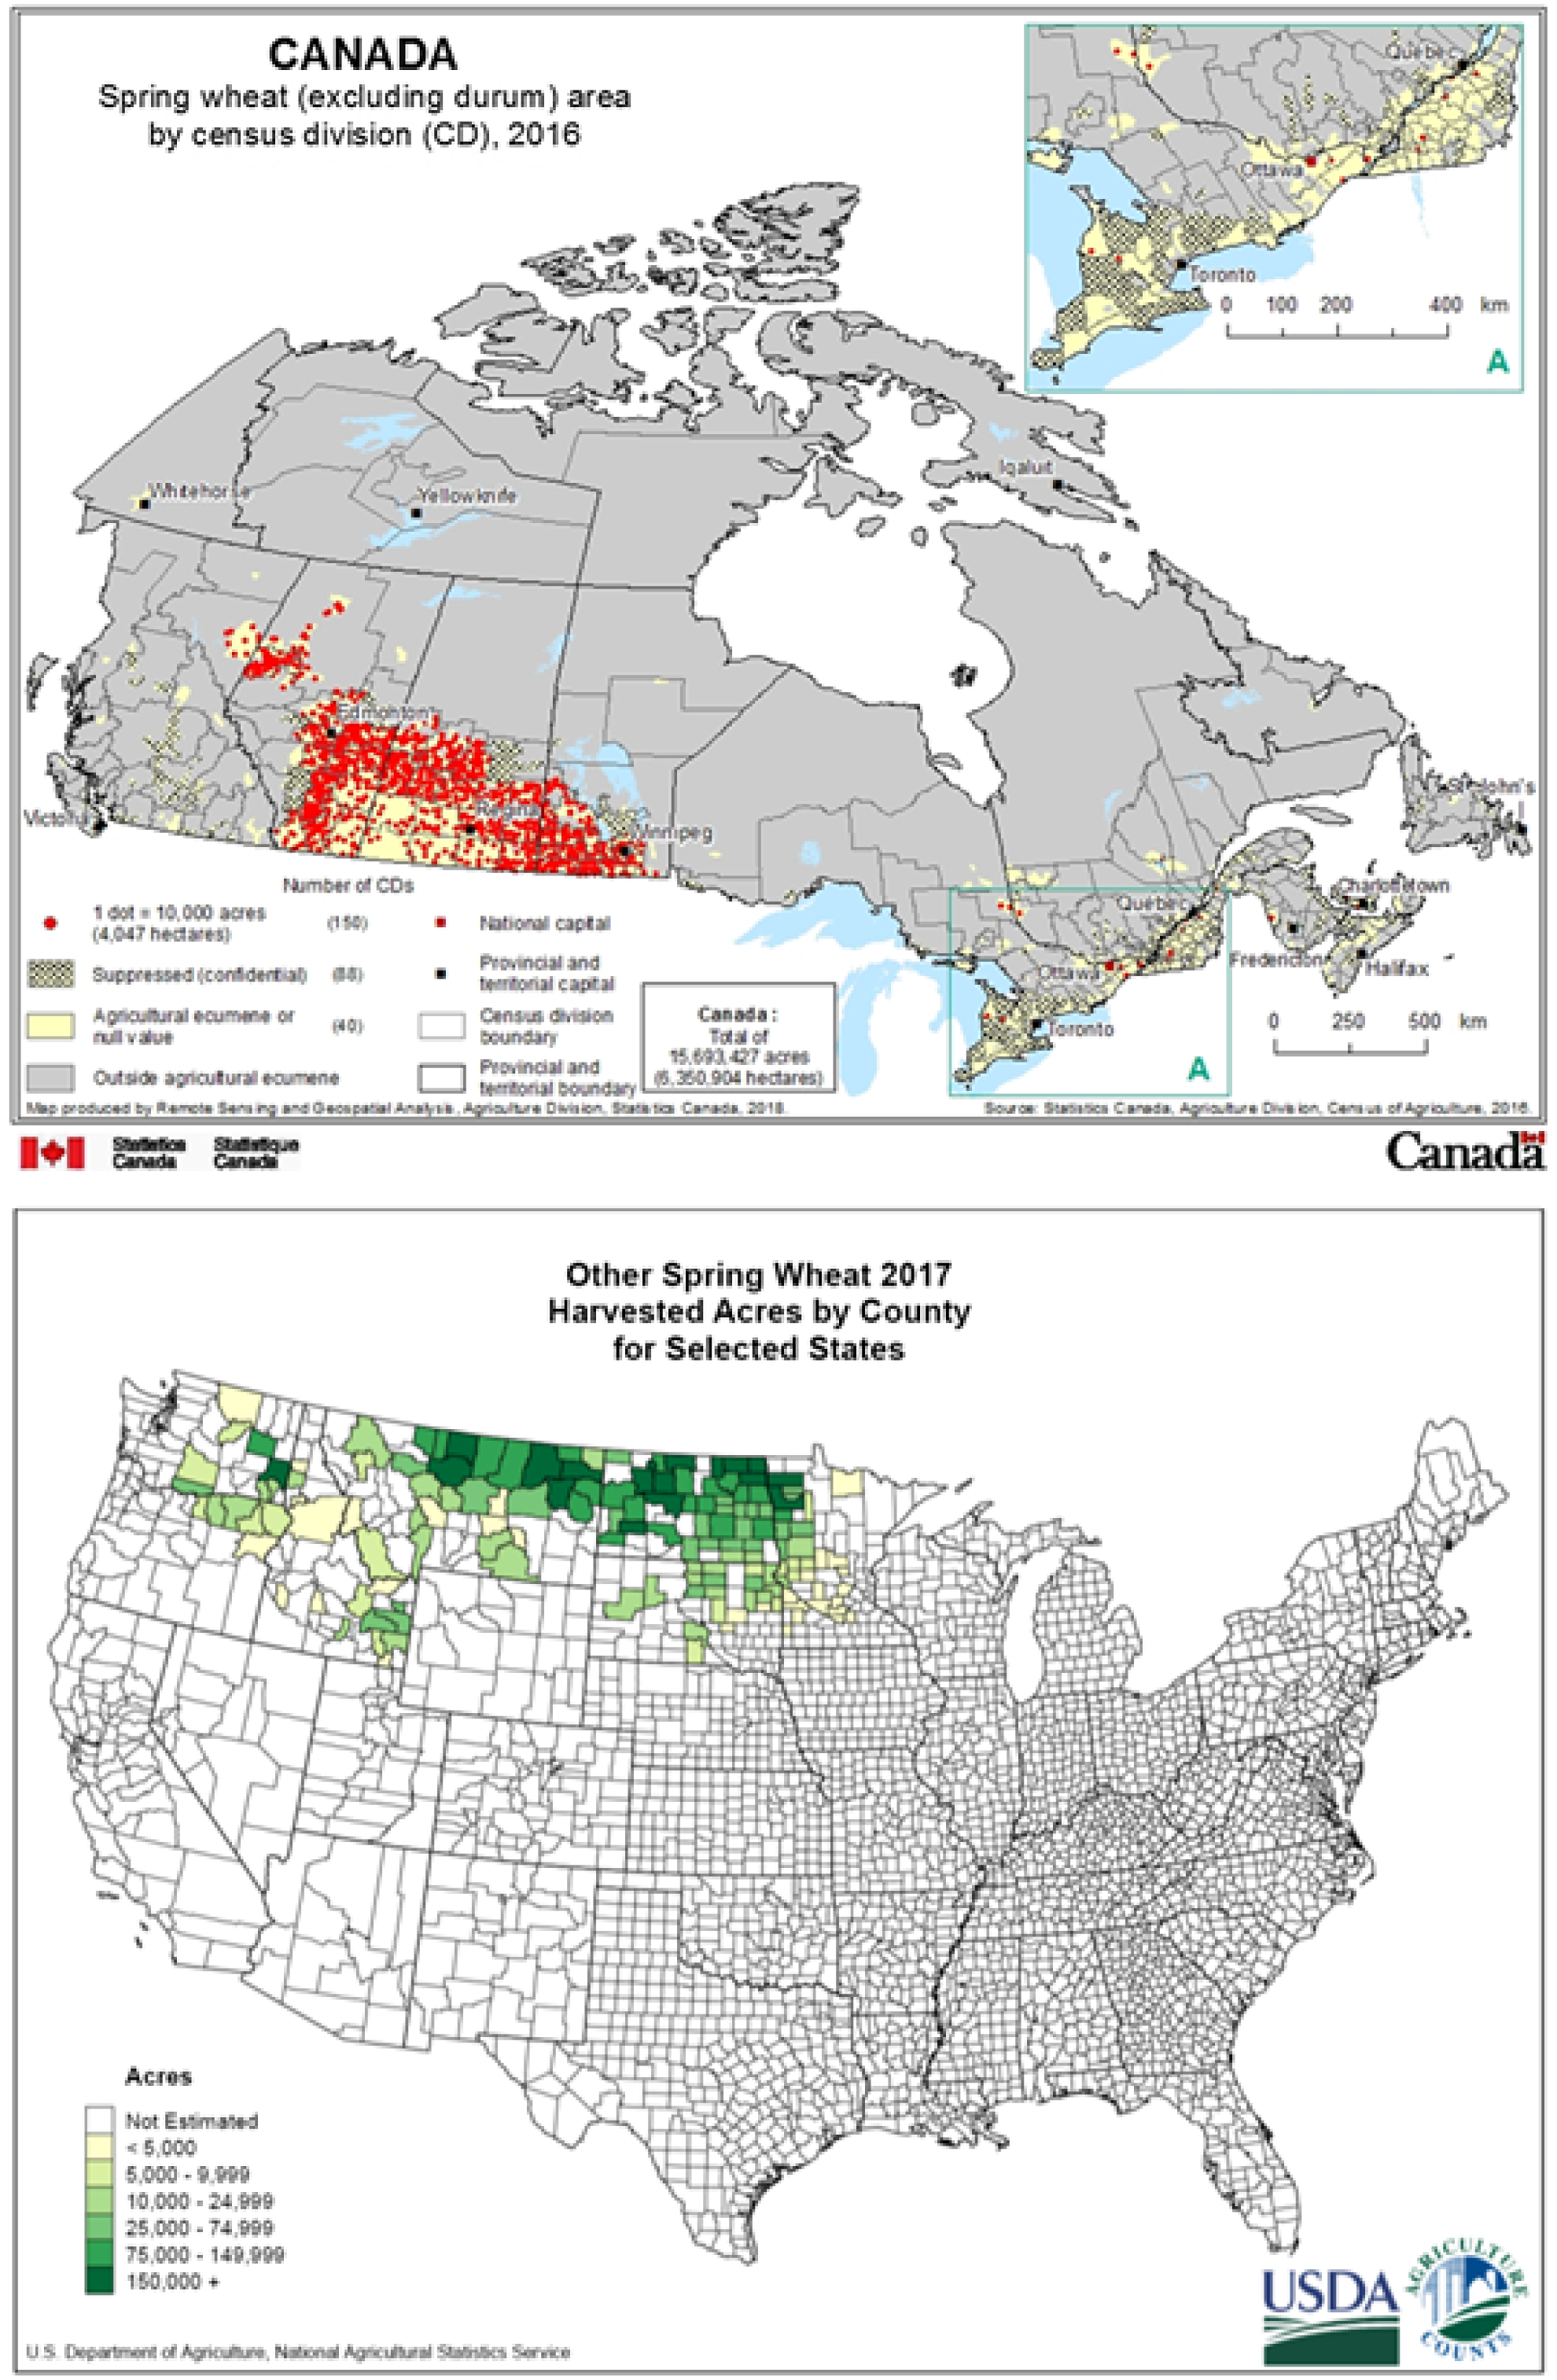
Herbicides are the most widely used pesticide in wheat. Herbicides are applied to 61% and 96% of planted acres of winter and spring wheat, respectively, production in the United States (USDA-NASS 2017a). Herbicides applied postemergence (POST) are the most common method of weed management in wheat. Tillage, where used, is conducted prior to or during planting, or in very low external input, wheat-fallow systems as part of a way to maintain the fallow (Schillinger Reference Schillinger2005). Timely seeding is essential to optimize wheat yields, and nonselective herbicides are used in place of tillage and delayed seeding practices in most systems. Herbicide use in wheat varies regionally, with the southern Great Plains using the least amount of herbicides, due to the widespread use of intensive wheat grazing systems, low rainfall, and low yield potential (Burke Reference Burke2018). By contrast, more than 97% of wheat in the Pacific Northwest and northern Great Plains are treated with an herbicide.
Herbicide resistance in wheat production is a global problem, and North America is no exception (Walsh and Powles Reference Walsh and Powles2014). Heavy reliance on POST herbicides for management of weeds in spring and winter wheat has selected for numerous biotypes of Asteraceae, Brassicaceae, cereal rye (Secale cereale L.), downy brome (Bromus tectorum L.), Italian ryegrass [Lolium perenne L. ssp. multiflorum (Lam.) Husnot], foxtail (Setaria spp.), kochia [Bassia scoparia (L.) A.J. Scott], Russian thistle (Salsola tragus L.), or wild oat (Avena fatua L.; Heap Reference Heap2021). As herbicide resistance increases, weed control suffers, potentially causing further reduced yields. Indeed, wheat yield loss in the long running Broadbalk Experiment in England is now greater than it was before herbicides were introduced (Storkey et al. Reference Storkey, Mead, Addy and MacDonald2021).
Previous WSSA crop loss reports in wheat are nearly 30 yr old (Bridges Reference Bridges1992; Chandler et al. Reference Chandler, Hamill and Thomas1984; Swanton et al. Reference Swanton, Harker and Anderson1993) and were estimated based on the expert opinions of researchers, extension specialists, and farmers across the wheat growing regions of the United States and Canada. Crop loss reports in wheat determined using quantitative data from replicated research trials across North America do not exist. Such information is important to inform funders, policymakers, commodity groups, and other stakeholders on the importance and continued need for weed science research in wheat (Walker Reference Walker1983, Reference Walker1987). The objective of this report is to document the potential wheat yield and economic losses due to weeds in the United States and Canada.
Materials and Methods
Weed science specialists and researchers in primary wheat growing regions of the United States and Canada were asked to provide yield data from replicated small grains research trials conducted between 2007 and 2017. Up to 10 individual trials could be reported within a year for winter, spring, and durum wheat; barley (Hordeum vulgare L.); and oat (Avena sativa L.). Data were also obtained from weed control research reports published online for several states and provinces. The specific information requested from each trial included both weedy and weed-free yields. Weedy yield was the average yield from the nontreated weedy plot (yield using BMP but no weed control practices), whereas weed-free yield was the average yield from an herbicide control plot with >90% control for each weed species (yield with BMP and excellent weed control). Yield loss was determined for each individual trial, then averaged within a year, and averaged across years for each state or province, as follows:
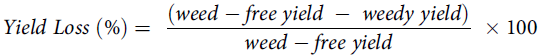 $$Yield{\rm{\;}}Loss{\rm{\;}}\left( {\rm{\% }} \right) = {\rm{\;}}{{\left( {weed - free{\rm{\;}}yield{\rm{\;}} - {\rm{\;}}weedy{\rm{\;}}yield} \right)}\over{{{{{weed - free{\rm{\;}}yield}}}}}}{\rm{\;}} \times 100$$
State- and province-level data for total winter and spring wheat acres harvested, average wheat yield, as well as total production, and yearly average commodity prices were obtained from USDA-NASS (2017b), OMAFRA (2017), and Statistics Canada (2017). The average commodity price for the period of 2007 to 2017 was US$208.71 and US$234.43 per 1,000 kg of winter and spring wheat, respectively, and was used to determine potential economic loss due to weeds (USDA-NASS 2017b). National and total (US + Canada) potential yield loss values were calculated using weighted average yield loss percentage based on the production of each state or province. These methods have been previously published by the WSSA Weed Loss Committee (Soltani et al. Reference Soltani, Dille, Burke, Everman, VanGessel, Davis and Sikkema2016, Reference Soltani, Dille, Burke, Everman, VanGessel, Davis and Sikkema2017, Reference Soltani, Dille, Robinson, Sprague, Morishita, Lawrence, Kniss, Jha, Felix, Nurse and Sikkema2018a, Reference Soltani, Dille, Gulden, Sprague, Zollinger, Morishita, Lawrence, Sbatella, Kniss, Jha and Sikkema2018b).
Additionally, yield loss data from the inland Pacific Northwest was used to assess the effects of weed competition between winter and spring wheat by agroecological class. The Pacific Northwest is characterized by a substantial climate gradient (Karimi et al. Reference Karimi, Stöckle, Higgins, Nelson and Huggins2017). Within areas with similar climate, there are similar crop production practices. Three agroecological classes dominate the inland Pacific Northwest wheat production area: an area of annual crop production where rainfall typically exceeds 45 cm of annual precipitation, an area of variable crop rotations that includes fallow and is typified by rainfall between 30 and 45 cm, and an area where the dominant crop rotation is winter wheat-fallow that has an annual precipitation of less than 30 cm.
Results and Discussion
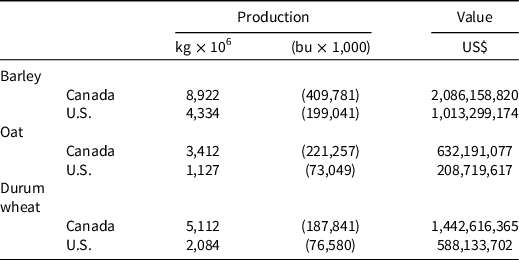
Data were received from states and provinces that represented 52.0%, 60.0%, and 52.6% of U.S., Canadian, and combined winter wheat production, respectively, and 93.3%, 82.4%, and 87.1% of U.S., Canadian, and combined spring wheat production. Data could not be obtained from states such as Colorado and Texas, which have significant winter wheat production, which potentially limits our findings. Sufficient data were not available for barley, oat, or durum wheat for yield loss analyses, despite a combined value in the U.S. + Canada of US$5.97 billion (Table 1; Statistics Canada 2017; USDA-NASS 2017b). Harker (Reference Harker2001) previously estimated yield loss in barley in Alberta, but reports for other small grains in other states or provinces do not exist. Greater emphasis on yield loss due to weeds in these crops is needed in the future.
Table 1. Average annual production and value of barley, oat, and durum wheat in Canada and the United States from 2007 to 2017. a
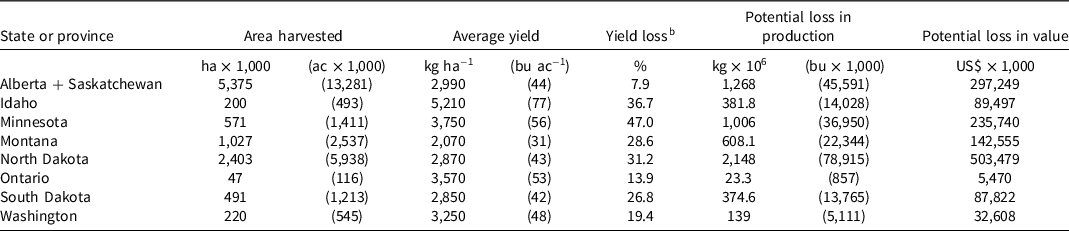
Winter wheat yield loss estimates ranged from 3.0% to 34.4% across United States and 2.9% for the province of Ontario (Table 2). Spring wheat yield loss estimates ranged from 7.9% to 47.0% across states and provinces (Table 3). Estimates for both winter and spring wheat indicate a fairly wide range of potential yield loss with a greater potential for yield loss in spring versus winter wheat. Despite this range, these data mostly align with previous WSSA Weed Loss Committee reports of 3% to 60% (Bridges Reference Bridges1992) and 5% to 20% yield loss (Chandler et al. Reference Chandler, Hamill and Thomas1984), and with previous Canadian estimates of 5% to 15% (Swanton et al. Reference Swanton, Harker and Anderson1993).
Table 2. Potential annual winter wheat yield and monetary loss due to weeds for each state or province that provided data for the period of 2007 to 2017. a
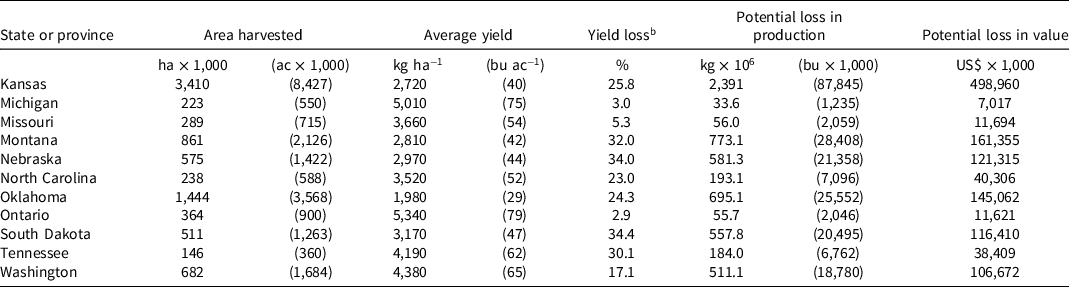
Table 3. Potential annual spring wheat yield and monetary loss due to weeds for each state or province that provided data for the period of 2007 to 2017. a
Data for our analysis were obtained from herbicide evaluation studies, which may have been conducted in areas with greater weed pressure than production fields due to the objective of determining control efficacy rather than yield loss in the absence of weed control. Potentially, artificially high weed densities may cause an overestimation of wheat yield loss than actually occurs. However, previous research examining yield loss in relation to weed density corroborates our findings. Yield losses due to grassy weeds can be quite high, as much as 92% from cheatgrass (Bromus tectorum; Rydrych and Muzik Reference Rydrych and Muzik1968) and 84% from jointed goatgrass (Aegilops cylindrica Host; Ogg and Seefeldt Reference Ogg and Seefeldt1999). But yield loss from grassy weeds is also variable, with estimates of 0% to 51% for Lolium perenne L. ssp. multiflorum (Appleby et al. Reference Appleby, Olson and Colbert1976), 6% to 92% for B. tectorum (Rydrych and Muzik Reference Rydrych and Muzik1968; Rydrych Reference Rydrych1974), and 30% to 84% for A. cylindrica (Ogg and Seefeldt Reference Ogg and Seefeldt1999). Broadleaf weed species in wheat are much more diverse and include Russian thistle (Salsola tragus L.), kochia [Bassia scoparia (L.) A. J. Scott], mayweed chamomile (Anthemis cotula L.), prickly lettuce (Lactuca serriola L.), henbit (Lamium amplexicaule L.), common chickweed [Stellaria media (L.) Vill.], mustard spp. (Brassica spp. L.), and volunteer canola (Brassica napus L.). Similarly, for broadleaf weed species, yield loss ranges from 0.3% to 48% from L. amplexicaule or S. media competition (Conley and Bradley Reference Conley and Bradley2005; Farahbakhsh et al. Reference Farahbakhsh, Murphy and Madden1987; Northam et al. Reference Northam, Stahlman and Abd El-Hamid1993) and 28% to 51% from blue mustard [Chorispora tenella (Pall.) DC.; Swan Reference Swan1971].
Yield loss in winter and spring wheat in the Pacific Northwest varied by agroecological class, with the greatest yield loss occurring in areas with the lowest rainfall (the wheat-fallow agroecological class in winter wheat at 30.4% (Table 4; Figure 3). Conversely, yield loss in spring wheat, at 21.7%, was greatest in areas of more abundant precipitation where annual crop rotations are practiced. Overall crop productivity is lowest in the wheat-fallow agroecological class, and spring wheat is viewed as a weed management rotation with little economic return in that agroecological class (Schillinger and Young Reference Schillinger and Young2004). Under future climate change scenarios, the winter wheat-fallow agroecological class is anticipated to grow in area (Karimi et al. Reference Karimi, Stöckle, Higgins, Nelson and Huggins2017; Storkey et al. Reference Storkey, Mead, Addy and MacDonald2021), potentially increasing the yield loss potential for the region. Yield loss in spring wheat in the wheat-fallow agroecological class was lowest in the region, but it is also the least productive rotation unless practiced annually (Juergens et al. Reference Juergens, Young, Schillinger and Hinman2004; Young et al. Reference Young, Alldredge, Pan and Hennings2015). Potential yield loss due to weeds in the Pacific Northwest approached US$190 million.
Table 4. Potential annual spring and winter wheat yield and monetary loss due to weeds for the three agroecological classes comprising the dryland wheat producing area in the inland Pacific Northwest (combined across northern Idaho, Oregon, and Washington) for the period of 2007 to 2015. a
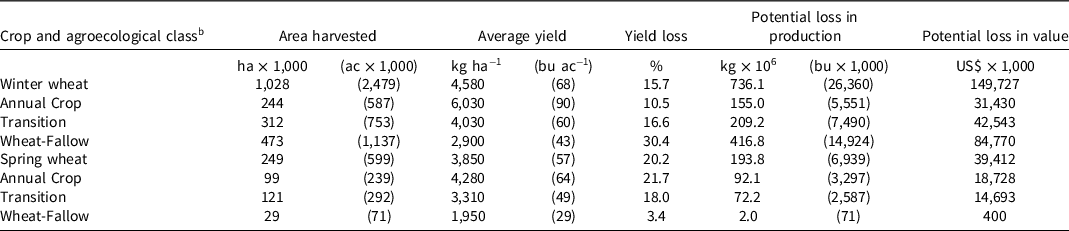
a Harvested acres, average yield, and yearly average commodity price were obtained from USDA-NASS.
b Agroecological classes for the inland Pacific Northwest include annual cropped, transition, and wheat-fallow, based on the actual annual land use/cover derived from the Cropland data layer 2008–2015 (Kaur et al. Reference Kaur, Huggins, Rupp, Abatzoglou, Stöckle and Reganold2017; USDA-NASS 2017b).
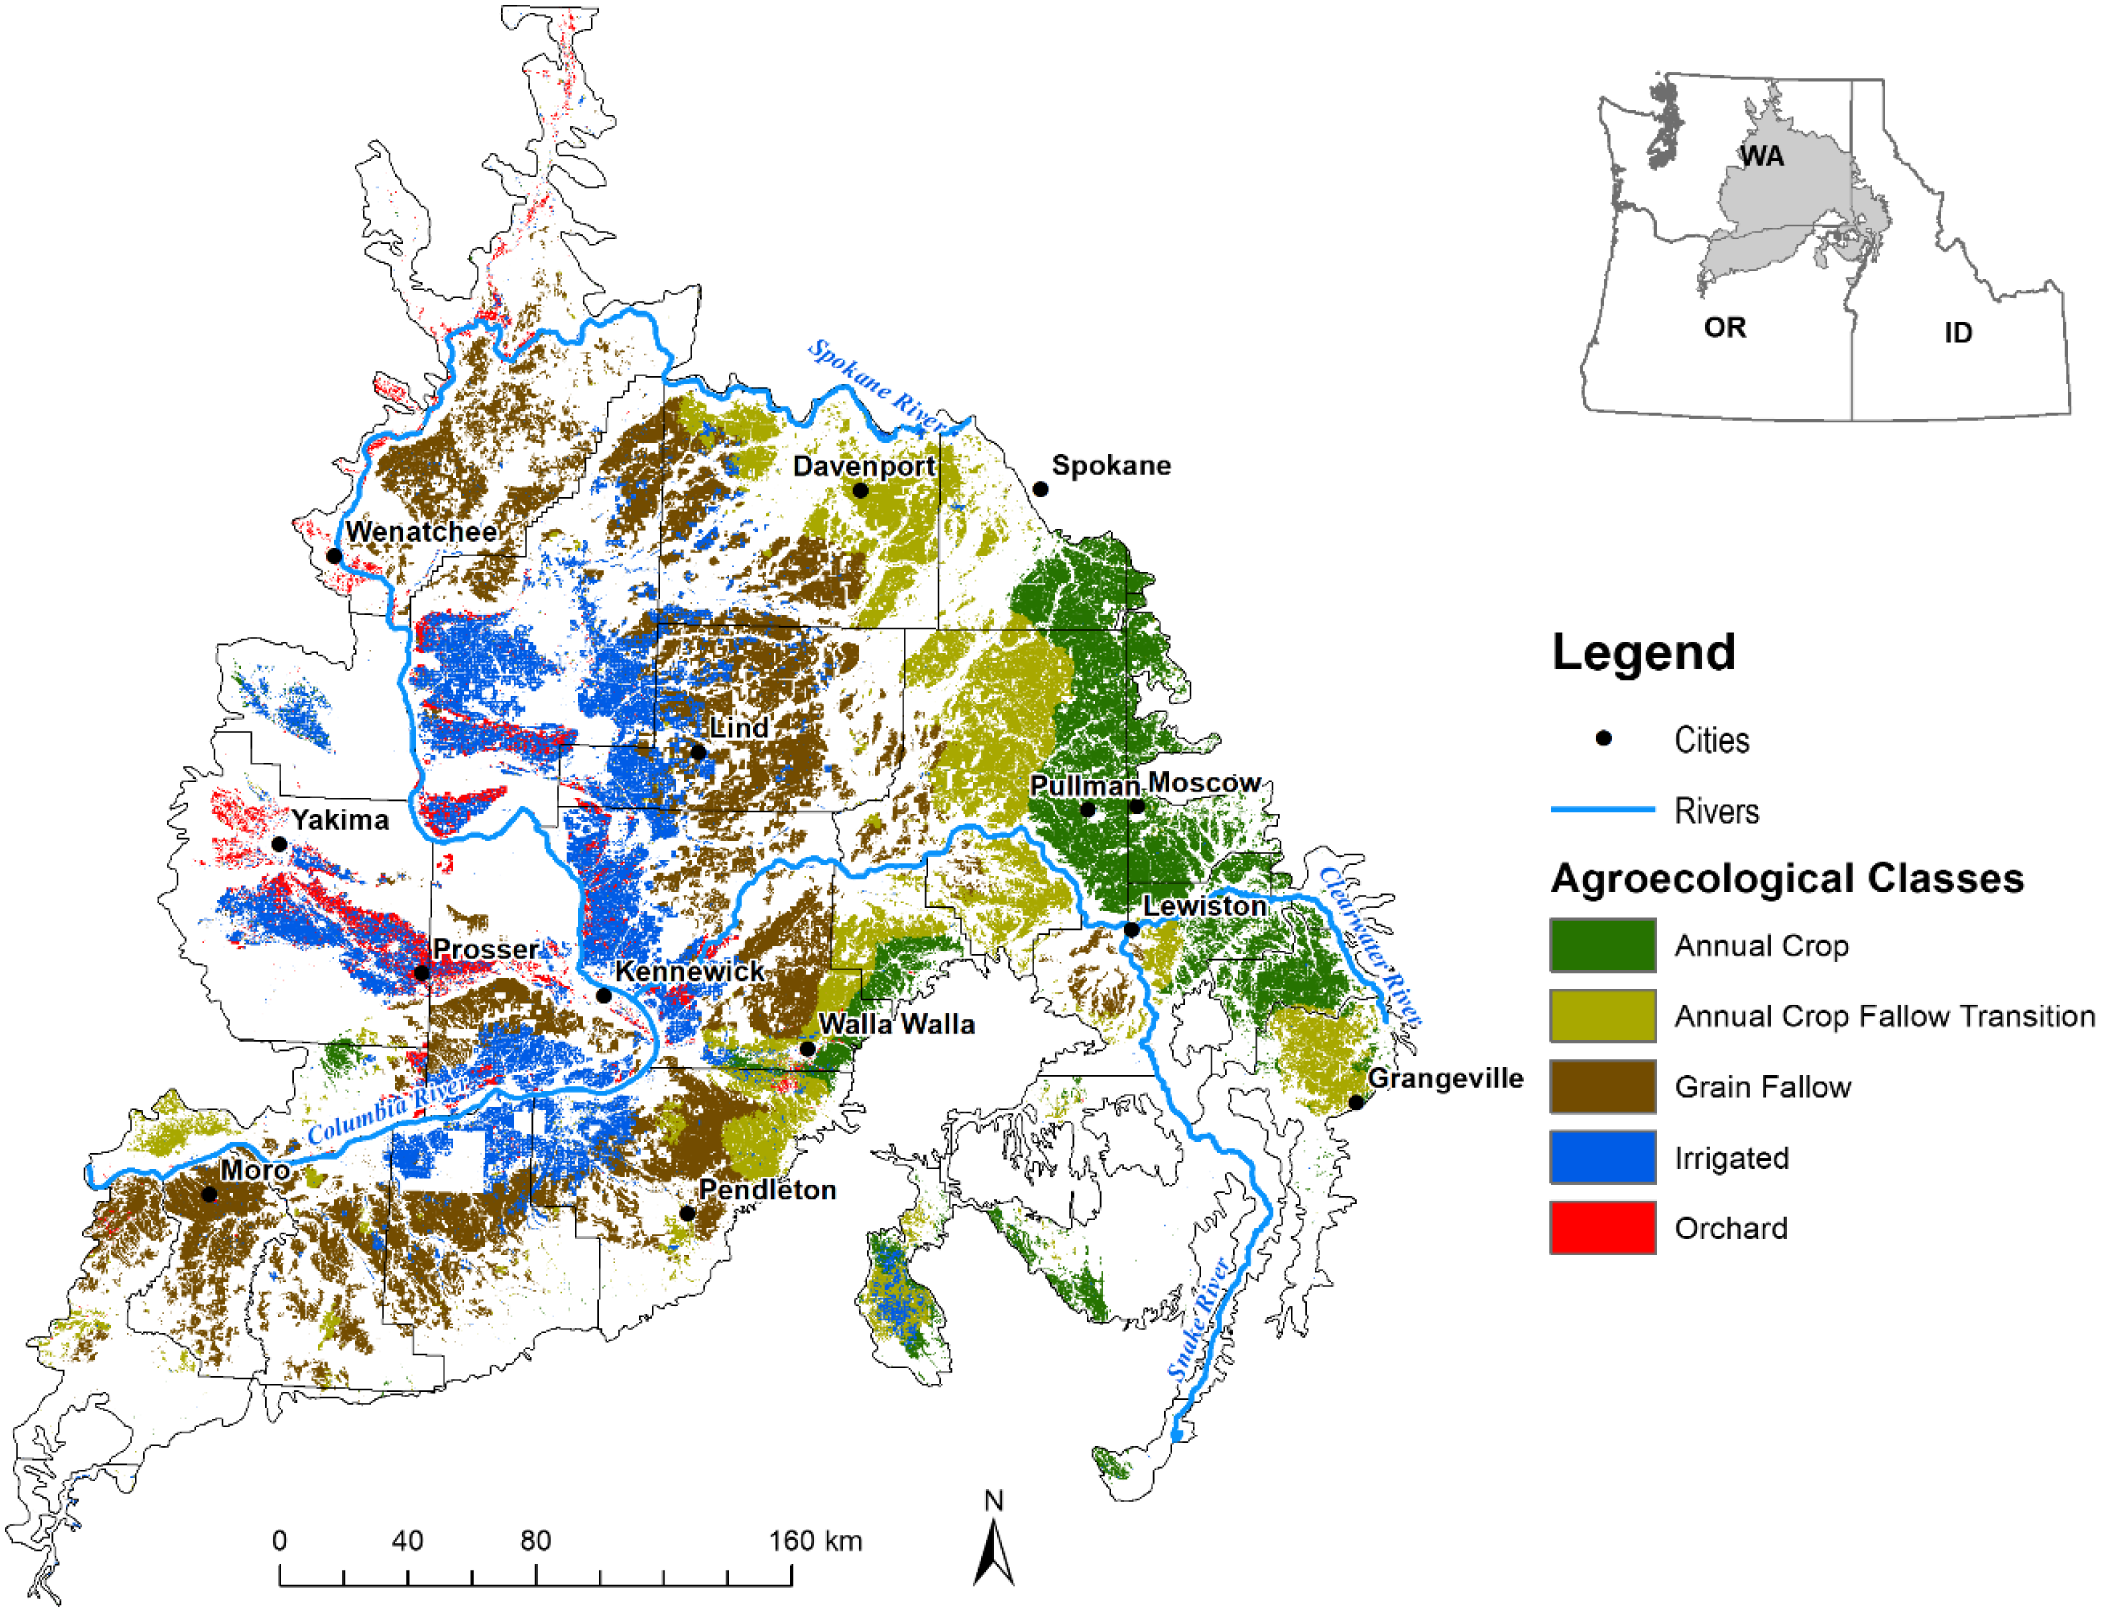
Figure 3. Agroecological classes in the inland Pacific Northwest wheat producing areas are caused by a rainfall gradient, where rainfall increases from west to east across the region. Yield loss estimates are associated with Zone 2, Annual Crop, Zone 3 Annual Crop - Fallow Transition, and zone 5, Grain Fallow.
By weighted average based on production, weeds cause a potential 23.5% yield loss in winter wheat across the United States and Canada and 19.5% yield loss in U.S. and Canadian spring wheat when using BMPs but no herbicidal weed control (Table 5). These estimates are slightly higher than those by Chandler et al. (Reference Chandler, Hamill and Thomas1984) who reported a 13% average yield loss in wheat due to weeds in the United States and 5% to 15% in Canada. These estimates are also higher than worldwide historical estimates of 9.8% (Cramer Reference Cramer1967) and 12.3% (Oerke et al. Reference Oerke, Dehne, Schönbeck and Weber1994). However, these estimates do align with reported by Oerke (Reference Oerke2006) of a potential yield loss of 18% to 29%. Greater yield loss due to weeds in our analysis compared with previous estimates corroborates findings of the Broadbalk experiment in England, where yield loss is greater now than before herbicides were introduced (Storkey et al. Reference Storkey, Mead, Addy and MacDonald2021). The trend of increasing losses is attributed to a warming climate and shorter wheat cultivars (Storkey et al. Reference Storkey, Mead, Addy and MacDonald2021).
Table 5. Wheat yield and monetary loss due to weeds for the United States and Canada.
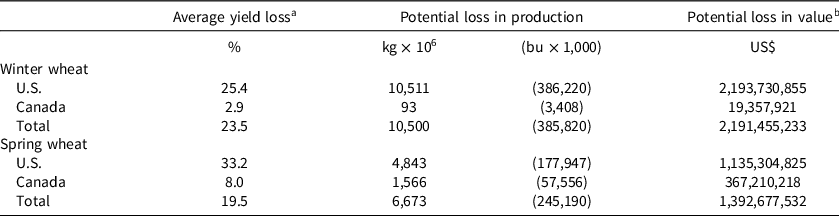
a Estimate is a weighted average by production of states or provinces relative to total production.
b Value is based on the average price of winter wheat (US$5.68 bu−1) and spring wheat (US$6.38 bu−1) from 2007 to 2017 (USDA-NASS 2017b).
Potential yield loss is in contrast to realized or actual yield loss. Actual wheat yield loss due to weeds is 7.7%, ranging from 3% to 13% (Oerke Reference Oerke2006), which is much less than our potential yield loss estimate. This difference is understandable since farmers will not completely ignore weeds. However, if a weed population is resistant to the herbicide applied, farmers may largely fail to control weeds, likely realizing yield losses aligned with our estimates.
Crop losses due to weeds are of critical concern in wheat-producing areas. In very low external input/low yielding wheat production systems, where wheat yields are often less than 2,000 kg ha−1 yr−1, herbicide resistance threatens to regress reductions in tillage (a process outlined by Shaw et al. Reference Shaw, Culpepper, Owen, Price and Wilson2012). Wheat growers managing such systems in North America cannot afford alternative herbicides that are often costlier, do not have any economically viable rotational crop, and thus are forced to use mechanical weed control to manage weeds (Schillinger and Young Reference Schillinger and Young2004).
Based on these yield loss estimates, the potential winter wheat loss due to weeds is 10.5 billion kg with a potential loss in value of US$2.19 billion for the United States and Canada (Table 5). Potential spring wheat loss due to weeds is 6.67 billion kg with a potential loss in value of US$1.39 billion for the United States and Canada. These data strongly indicate the continued need for investment in weed science research.
Acknowledgments
Thanks to specialists who responded to the request for data or posted data online including Charles Geddes (Alberta), Don Morishita (Idaho), Phil Stahlman and Dallas Peterson (Kansas), Christy Sprague (Michigan), Bev Durgan (Minnesota), Kevin Bradley (Missouri), Prashant Jha (Montana), Kirk Howatt (North Dakota), Paul Johnson (South Dakota), Larry Steckel (Tennessee), and University of Nebraska weed scientists. Thanks to Bryan Carlson and David Huggins with the U.S. Department of Agriculture–Agricultural Research Service Northwest Sustainable Agroecosystems Research Unit, for generating the map of agroecological classes for the Pacific Northwest. We also thank the WSSA for supporting the WSSA Weed Loss Committee. No conflicts of interest have been declared. This research received no specific grant from any funding agency, commercial or not-for-profit sectors.


 Open access