


Birth weight (BW) is an important indicator of overall health and is influenced by a number of factors, including smoking, drinking alcohol during pregnancy, low parental socio-economic status, education levels, low income, and inadequate living conditions (Joloza, Reference Joloza2012). In addition, a wealth of evidence linking low BW to a higher risk of perinatal morbidity and mortality already exists (Battaglia & Lubchenco, Reference Battaglia and Lubchenco1967; McIntire et al., Reference McIntire, Bloom, Casey and Leveno1999), and this has been further extended to show that a low BW can impact on adulthood diseases such as type 2 diabetes, cardiovascular diseases, high blood pressure, and obesity (Barker, Reference Barker2004; Jarvelin et al., Reference Jarvelin, Sovio, King, Lauren, Xu, McCarthy and Elliott2004; McIntire et al., Reference McIntire, Bloom, Casey and Leveno1999). To date, little is actually known about the genetic architecture that determines BW variability, although some recent studies are beginning to shed some light. Six European cohorts (n = 10,263) have been studied and the results show that variants in ACDY5 and near to CCNL1 (OMIM: 613384) are associated with fetal growth and BW, and this has been further replicated in an additional 13 studies (Freathy et al., Reference Freathy, Mook-Kanamori, Sovio, Prokopenko, Timpson, Berry and McCarthy2010). In addition, maternal inheritance of a repetitive sequence variant of the PHLDA2 gene (OMIM: 602131) has been shown to significantly increase BW (Ishida et al., Reference Ishida, Monk, Duncan, Abu-Amero, Chong, Ring and Moore2012). The most recent meta-analysis has extended the number of loci associated with BW, at genome-wide significance to seven, accounting for a similar proportion of variance as maternal smoking. Five of the loci are known to be associated with other phenotypes: ADCY5 and CDKAL1 with type 2 diabetes, ADRB1 with adult blood pressure, and HMGA2 and LCORL with adult height. These findings again highlight genetic links between fetal growth and postnatal growth and metabolism (Horikoshi et al., Reference Horikoshi, Yaghootkar, Mook-Kanamori, Sovio, Taal and Hennig2013).
All these studies have specifically excluded multiple births due to issues of relatedness or potential non-generalizability. Only a few have been conducted to date, and findings suggest that LEP and its receptor may act in fetal growth to promote growth, and in twins it is associated with metabolic disease such as development of type 2 diabetes (Souren et al., Reference Souren, Paulussen, Steyls, Loos, Stassen, Gielen and Zeegers2008). Another study has shown that alteration of HERVWE1 methylation affects discordant monozygotic (MZ), dichorionic twin growth (high expression is correlated with small foetus size; Gao et al., Reference Gao, He, Wang, Luo, Sun, Zhou and Jiang2012). Twins are an essential group to study because multiple births have been on the rise, with an increase of almost 50% from 1984–2004 in the United Kingdom (98.5% of these are twins), and they have high rates of complications (www.twinsuk.co.uk). The key assumption is that weight differences in twin pairs come from random differences in access to nutrition; for example, position in uterus/umbilical cord. This is backed up by Cleary-Goldman and D’Alton (Reference Cleary-Goldman and D’Alton2008), who found that singletons and twins develop at the same rate until week 30, at which point the restrictions in uterus size kick in. Dizygotic twins (DZs) only share ~50% of their genes (like siblings) and they almost always have a separate placenta. It is believed that access to nutrients in DZs may differ due to mass/function of placenta or placental lesions but these effects are usually moderate. On the other hand, MZ twins are formed from the division of a single ovum, post-fertilization and can have one or two chorions. Severe differences in nutritional intake due to positioning and/or umbilical cord insertion can lead to greater weight discrepancies, and therefore a lighter MZ twin is likely to be genuinely growth-restricted (Torche & Echevarria, Reference Torche and Echevarria2011).
Maternal behavior such as smoking status and pregnancy risk factors may influence the weight at birth of a child and thus the twin model accounts for confounders related to mother and pregnancy because twins share the same uterine environment and have the same gestational age. Therefore, the observed effect of BW in twins comes from intra-uterine growth alone.
In this study, we have carried out a genome-wide association (GWA) analysis in 4,593 female study participants with BW data available from the TwinsUK cohort testing the top hit in an independent Australian twin cohort. We have also included replication in a UK-based cohort of singletons in order to investigate whether the effects that we see in twins can also be seen, and if so, to what extent in single births. Since our discovery cohort was British, the Hertfordshire cohort was useful in that there should be no effects of population stratification.
Materials and Methods
Study Populations
TwinsUK is the largest registry of adult twins in the United Kingdom. Started in 1992, it currently encompasses approximately 12,000 volunteer twins from all over the United Kingdom (Moayyeri et al., Reference Moayyeri, Hammond, Valdes and Spector2013). The data used in this study were collected from female twins who were recruited through a national media campaign as part of the St Thomas’ UK adult twin register, initially a cohort of female volunteers. Twins were invited to attend a central clinic where they underwent a physical examination and numerous investigations, including blood pressure measurement. Information on medical history, drug use, lifestyle, and demographic variables was obtained by a standardized nurse-administered questionnaire. Questions on recalled BW (in kilograms or heavier or lighter status) and birth order were supplied two weeks before the interview, and interviewees were encouraged to consult their mothers for answers. Zygosity was assessed by standardized questionnaire, and DNA fingerprinting was used for confirmation (Poulter et al., Reference Poulter, Chang, MacGregor, Snieder and Spector1999). In total, 4,593 female participants were studied with regard to BW (converted to kilograms and then z-score calculated). The study was approved by St. Thomas’ Hospital Research Ethics Committee, and all twins provided informed written consent.
The Hertfordshire Cohort Study (HCS)
From 1911 to 1948 in Hertfordshire (UK), each birth was notified by the attending midwife and the BW was recorded. Subsequently, health visitors who saw each child during infancy recorded his or her weight at the age of 1 year. In Hertfordshire, 7,106 individuals born between 1931 and 1939 who were singleton births and had both birth and infant weights recorded, and were still resident in East Hertfordshire in the late 1990s, were traced using the National Health Service Central Registry data and confirmed to be registered with a Hertfordshire general practitioner (GP) by the Hertfordshire Family Health Services Authority (FHSA). Permission was obtained from GPs to contact 6,099 of these individuals; 3,225 (53%) agreed to a home interview with a trained research nurse who collected information on the medical and social history. Subsequently, 2,997 (1,579 men and 1,418 women) attended a clinic for detailed physiological investigations (Phillips et al., Reference Phillips, Goulden, Syddall, Aihie Sayer, Dennison and Martin2005; Robinson et al., Reference Robinson, Batelaan, Syddall, Sayer, Dennison and Martin2006). The East and North Hertfordshire Ethical Committees granted ethical approval for the study and all participants gave written informed consent.
QIMR
The QIMR participants in the current study were originally recruited in a series of studies examining health and lifestyle factors (Hansell et al., Reference Hansell, Agrawal, Whitfield, Morley, Zhu, Lind and Martin2008) and in the context of an ongoing study of melanoma risk factors (Zhu et al., Reference Zhu, Duffy, Eldridge, Grace, Mayne, O’Gorman and Martin1999, Reference Zhu, Montgomery, James, Trent, Hayward, Martin and Duffy2007). BW data were collected from twins’ parents and via self-report; where available, the maternal report was used in these analyses. Where available, clinical measurements of body mass index (BMI; measured in adulthood and calculated as weight divided by height squared [kg/m2]) were used, and these data were augmented with the self-report data for those who had not participated in a clinical study. Participants were genotyped in the context of a larger GWA project which resulted in the genotyping of 16,140 individuals (see Medland et al., Reference Medland, Nyholt, Painter, McEvoy, McRae, Zhu and Martin2009) using the Illumina 317, 370, and 610 single nucleotide polymorphism (SNP) chips that included data from twins, their siblings, and their parents. Genotype data were screened for genotyping quality (GenCall < 0.7), SNP and individual call rates (<0.95), HWE failure (p < 10−6), and MAF (<0.01). Association analyses were run using Merlin, using the fastassoc option, which corrects for relatedness.
Methods
TwinsUK Genotyping
The TwinsUK samples were genotyped using a combination of Illumina arrays: HumanHap300 (Richards et al., Reference Richards, Rivadeneira, Inouye, Pastinen, Soranzo, Wilson and Spector2008; Soranzo et al., Reference Soranzo, Rivadeneira, Chinappen-Horsley, Malkina, Richards, Hammond and Deloukas2009), HumanHap610Q, 1M-Duo and 1.2M-Duo 1M. The normalized intensity data for each of the three arrays were pooled separately (with 1M-Duo and 1.2M-Duo 1M pooled together). For each dataset we used the Illluminus calling algorithm (Teo et al., Reference Teo, Inouye, Small, Gwilliam, Deloukas, Kwiatkowski and Clark2007) to assign genotypes in the pooled data. No calls were assigned if an individual's most likely genotype was called with less than a posterior probability threshold of 0.95. Validation of pooling was achieved via a visual inspection of 100 random, shared SNPs for overt batch effects. Finally, intensity cluster plots of significant SNPs were visually inspected for over-dispersion biased no calling, and/or erroneous genotype assignment. SNPs exhibiting any of these characteristics were discarded. We applied similar exclusion criteria to each of the three dataset separately. For the samples: Exclusion criteria were (1) sample call rate <98%, (2) heterozygosity across all SNPs ≥ 2 standard deviation (SD) from the sample mean (M), (3) evidence of non-European ancestry as assessed by the Principal Component Analysis (PCA) comparison with HapMap3 populations, (4) observed pair-wise identity-by-descent (IBD) probabilities suggestive of sample identity errors; and (5) we corrected misclassified MZ and DZ twins based on IBD probabilities. SNPs: Exclusion criteria were (1) Hardy–Weinberg p-value < 10−6, assessed in a set of unrelated samples; (2) MAF < 1%, assessed in a set of unrelated samples; and (3) SNP call rate < 97% (SNPs with MAF ≥ 5%) or <99% (for 1% ≤ MAF < 5%). Alleles of all three datasets were aligned to HapMap2 or HapMap3 forward strand alleles. Prior to merging, we performed pair-wise comparison among the three datasets and further excluded SNPs and samples to avoid spurious genotyping effects, indentified as follows: (1) concordance at duplicate samples < 1%; (2) concordance at duplicate SNPs < 1%; (3) visual inspection of Quantile–Quantile (QQ) plots for logistic regression applied to all pair-wise dataset comparisons; (4) Hardy–Weinberg p-value < 10−6, assessed in a set of unrelated samples; and (5) observed pair-wise IBD probabilities suggestive of sample identity errors. We then merged the three datasets, keeping individuals typed at the largest number of SNPs when an individual was typed at two different arrays. The merged dataset consists of 5,654 individuals (2,040 from the HumanHap300, 3,461 from the HumanHap610Q, and 153 from the HumanHap1M and 1.M arrays) and up to 874,733 SNPs depending on the dataset (HumanHap300: 303,940, HumanHap610Q: 553,487, and HumanHap1M and 1.M: 874,733).
Imputation
This was performed using the IMPUTE software package (v2; Howie et al., Reference Howie, Donnelly and Marchini2009) using two reference panels, P0 (HapMap2, rel 22, combined CEU+YRI+ASN panels) and P1 (610k+, including the combined HumanHap610k and 1M reduced to 610k SNP content).
Replication genotyping
Genotyping in the samples from HCS was carried out by Kbioscience Ltd, Hertfordshire UK. SNPs were genotyped using the KASPar chemistry, which is a competitive allele-specific polymerase chain reaction (PCR) SNP genotyping system using fluorescence resonance energy transfer (FRET) quencher cassette oligos (http://www.lgcgenomics.com/).
Phenotype preparation
We ran a preliminary association on raw BW values and then BW was transformed to a z-score ((BW value − mean BW)/SD BW) to facilitate comparison of twins with HCS (results in this manuscript are the z-score values). BMI was calculated by weight divided by height squared (kg/m2).
Analyses
The GWA analysis was performed on imputed data using GenABEL (Aulchenko et al., Reference Aulchenko, Ripke, Isaacs and van Duijn2007) for twins (to account for relatedness) and PLINK (Purcell et al., Reference Purcell, Neale, Todd-Brown, Thomas, Ferreira, Bender and Sham2007) for the HCS samples. We analyzed all twins together, separated by sex and, in addition, separated by zygotic status. Summary statistics (the regression coefficient beta and its standard error) for each cohort were then meta-analyzed using fixed effect models. The ‘meta’ package for R was used (R Development Core Team, 2010).
Results
The descriptive characteristics of the discovery and replication cohorts are shown in Table 1. The average difference in weight at birth between twins is 0.54 kg (MZ average is 0.54 kg, while DZ twins were, on average, 0.55 kg apart at birth).
TABLE 1 Descriptive Statistics of TwinsUK Discovery Cohort and the QIMR Twins Plus Hertfordshire Replication Cohorts

Given the sample size, the statistical power to identify as genome-wide significant (GWS; p < 5 × 10⁻⁸) in the discovery cohort was 80% for an effect size of 0.20 given a minor allele frequency (MAF) of 0.13. The power was 80% in the discovery plus replication cohorts for an effect size of 0.15 (measured in units of standard deviations from the mean).
We ran a preliminary association using raw BW data and found four GWS SNPs at a locus on chromosome 9 compared with the null expectation of no association (Supplementary Table 4). In order to compare with other data available, we then converted the weight at birth to a z-score and reran the association. This GWA analysis on the TwinsUK cohort maintained a GWS signal (p < 5 × 10⁻⁸). Creation of residuals to adjust for BMI and also running BMI as a covariate did not alter these results (Supplementary Table 5 and Figure 1).
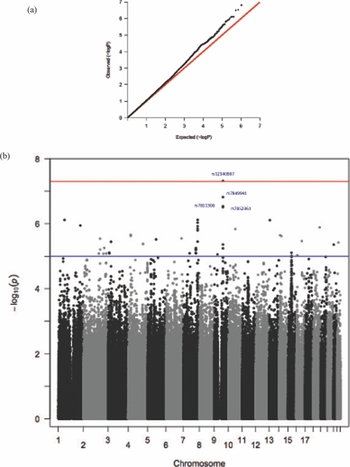
FIGURE 1 TwinsUK: (a) QQ plot; (b) Manhattan plot.
Our signal achieving GWS in twins lies on chromosome 9, close to NTRK2 (neurotrophic tyrosine kinase, receptor, type 2), which is a membrane-bound receptor, OMIM: 600456 (Figure 2). This gene encodes a member of the neurotrophic tyrosine receptor kinase (NTRK) family. This kinase, upon neurotrophin binding, phosphorylates itself and members of the MAPK pathway. Signaling through this kinase leads to cell differentiation, and mutations in this gene have been associated with obesity and mood disorders (Gray et al., Reference Gray, Yeo, Hung, Keogh, Clayton, Banerjee and Farooqi2007; Yeo et al., Reference Yeo, Connie Hung, Rochford, Keogh, Gray, Sivaramakrishnan and Farooqi2004). We further examined whether this result was seen predominantly in identical or non-identical twins (Supplementary Table 3) or was due to the twin with the highest or the lowest BW in a pair (Supplementary Table 2). We found that the SNPs were more highly associated with the low BW twin and the effect was larger in MZ twins.

FIGURE 2 TwinsUK regional plot.
As NTRK2 has been shown to be related to obesity, we also explored whether these variants were associated with other phenotypes related to adult weight (Supplementary Table 1). We investigated the effect of adult fat mass and percentage body fat on our top signals. Within the TwinsUK sample we found our two top variants were marginally associated with fat mass (rs7849941, p = .002; rs12340987, p = .04) and percentage body fat (rs7849941, p = .0004; rs12340987, p = .05).
Replication
We then investigated whether these variants were associated with BW in an independent cohort of UK-based singletons in order to investigate how twins would compare with singleton births with regard to BW genetics. The two top signals, rs7849941 and rs12340987, (r 2 = 0.85 in 1000 Genomes Project) were selected for replication in HCS, which included both genders; rs7849941 was found to be significantly associated with BW among HCS females (p < .04) and rs12340987 achieved p < .08 among females (Table 2). On the other hand, the effect size among males was in the opposite direction and was not statistically significant for either SNP. A fixed effect meta-analysis of females in TwinsUK and HCS was conducted, and while rs12340987 achieves suggestive significance, rs7849941, with which it is in strong linkage disequilibrium (LD), shows nominal significance; further, it achieves GWS when the discovery and replication cohorts are combined. As such, there is cumulative evidence that this locus is indeed associated with BW.
TABLE 2 Genetic Association Effect Size Estimates in the Discovery and Replication Cohorts and Summary Statistic From Fixed Effect Meta-Analysis

Effect sizes are standardized and are per standard deviation from the mean. The two top SNPs were genotyped for replication in the Hertfordshire cohort (n = 2,997) and replicated in the Australian Twin (QIMR) cohort (n = 3,033).
The two top SNPs were genotyped for replication in the Hertfordshire cohort (n = 2,997) and also followed up in the Australian twin cohort, where they were on a chip (n = 3,003). Table 2 shows the genetic association effect size estimates in the discovery and replication cohorts and summary statistic from fixed effect meta-analysis. Effect sizes are standardized and are per standard deviation from the mean. No significant inter-study heterogeneity was observed (Q = 2.38, p < .123) and the between-study variance was τ2 = 0.0023.
Finally, we compared our results with the published data from the Early Growth Genetics (EGG) consortium (GWA studies (GWAS) on BW in 26,863 singleton-birth individuals of both genders; Horikoshi et al., Reference Horikoshi, Yaghootkar, Mook-Kanamori, Sovio, Taal and Hennig2013). SNP rs7849941 is not available in the EGG consortium. Allele A for SNP rs12340987 is not significantly associated with BW and has an effect size of 0.02 (95% CI -0.001, 0.043), which is consistent with what we see in the HCS study when we combine males and females. Unfortunately, gender-stratified analyses are not publically available.
Discussion
In this study, we have investigated the role of genetic variation in weight at birth in multiple births. We find that variants mapping to the NTRK2 gene are associated with BW in twins and this effect is seen in both identical and non-identical twins. When the analysis was repeated using only the twin with the highest BW or only the twin with the lowest weight at birth, the variants maintain association, particularly in the low BW twin.
The findings of this study provide a novel insight into the genetic component of BW. The variants discovered to be associated with twin BW are close to the NTRK2 gene that has previously been associated with severe early onset obesity (Gray et al., Reference Gray, Yeo, Hung, Keogh, Clayton, Banerjee and Farooqi2007). Mutations in NTRK2 have been found to be a cause of obesity hyperphagia and developmental delay (OHPDD; Yeo et al., Reference Yeo, Connie Hung, Rochford, Keogh, Gray, Sivaramakrishnan and Farooqi2004). OHPDD is a disorder characterized by early-onset obesity, hyperphagia, and severe developmental delay in motor function, speech, and language. The association with BW reported by us supports a developmental role for this gene. In addition, variation in the NTRK2 gene has also been implicated in anorexia nervosa and minimum BMI (Ribases et al., Reference Ribases, Gratacos, Badia, Jimenez, Solano, Vallejo and Estivill2005), linking this gene also to adult disease. However, the variant identified in our study is not in LD with the variants associated with OHPDD, nor with those associated with anorexia nervosa (maximum r 2 = 0.04, data not shown). The other gene near the signal identified is AGTPBP1, a zinc carboxypeptidase that contains nuclear localization signals and an ATP/GTP-binding motif. According to HapMap (www.hapmap.org), there are no GWAS hits mapping to this gene.
Our results show that SNPs close to NTRK2 are significant in females but not in males, with one reason being that boys weigh 136 g more than girls at term birth (Lehre et al., Reference Lehre, Laake and Sexton2013). The reason for this remains unknown, with many different theories. Proposed modes of action include the action of androgens (de Zegher et al., Reference de Zegher, Francois, Boehmer, Saggese, Muller, Hiort and Sippell1998), the sexual bias in metabolism (Crawford et al., Reference Crawford, Doyle and Meadows1987; Lovejoy et al., Reference Lovejoy and Sainsbury2009), or that boys weigh more due to an undetermined cause that is Y-chromosome-related (Ounsted & Ounsted, Reference Ounsted and Ounsted1970).
Our study was limited by the number of twins available for study, and also because TwinsUK predominantly comprises women, our discovery cohort was limited to women. As BW is only one of many developmental phenotypes, our findings may suggest that a different genetic architecture may be at play in determining female BW than in males.
Supplementary Material
To view supplementary material for this article, please visit http://dx.doi.org/10.1017/thg.2014.34.
Acknowledgments
The TwinsUK study was funded by the Wellcome Trust; European Community's Seventh Framework Programme (FP7/2007-2013). The study also receives support from the National Institute for Health Research (NIHR)-funded BioResource, Clinical Research Facility, and Biomedical Research Centre based at Guy's and St Thomas’ NHS Foundation Trust in partnership with King's College London. SNP Genotyping was performed by the Wellcome Trust Sanger Institute and the National Eye Institute via NIH/CIDR. The research leading to these results has received funding from the European Community's Seventh Framework Programme under grant No. 277849 (www.eurhealth.org). The Hertfordshire Cohort Study was funded by the Medical Research Council of Great Britain; Arthritis Research UK; the International Osteoporosis Foundation; as well as the NIHR Musculoskeletal Biomedical Research Unit, University of Oxford and the NIHR Nutrition Biomedical Research Centre, University of Southampton. QIMR: We thank the twins and their families for their participation, Dixie Statham, Ann Eldridge, Marlene Grace, and Kerrie McAloney (sample collection); Lisa Bowdler, Steven Crooks (DNA processing), David Smyth, Harry Beeby, and Daniel Park (IT support). Funding: Australian National Health and Medical Research Council (241944, 339462, 389927, 389875, 389891, 389892, 389938, 442915, 442981, 496739, 552485, 552498); Australian Research Council (A7960034, A79906588, A79801419, DP0770096, DP0212016, DP0343921); FP-5 GenomEUtwin Project (QLG2-CT-2002-01254); US National Institutes of Health (NIH grants AA07535, AA10248, AA13320, AA13321, AA13326, AA14041, MH66206). SEM is supported by an ARC Future Fellowship. Role of the funding source: The European Commission had no role in the study design, data collection, data analysis, data interpretation, or the writing of the report.
Abbreviations
ASN: East Asian population
CEU: Utah residents with North European ancestry
KASP: Kompetitive Allele Specific PCR
OMIM: Online Mendelian Inheritance in Man
YRI: Yoruba from Nigeria.


