


Medical benefits for sickness absence and disability put a large economic burden on society (Moncrieff & Pomerleau, Reference Moncrieff and Pomerleau2000; Organisation for Economic Co-operation and Development (OECD), 2003). Most patients on long-term sick leave (LTSL) return to work, but in some cases LTSL leads to disability pension (DP) and thus often permanent exclusion from the workforce. According to Norwegian data (Gjesdal et al., Reference Gjesdal, Haug and Ringdal2005), 9% of patients aged less than 40 years who were on LTSL for the first time were granted DP five years later. The risk was particularly high for LTSL due to mental disorders (11% of women and 24% of men). The societal and personal costs are particularly high when young people are granted DP. In order to understand why some young adults transit from LTSL to DP whereas others return to work, it is important to investigate common and specific risk factors for LTSL and DP.
In most industrialized countries, sick leave benefits are granted based on disease or injury resulting in reduced work capacity (Soderberg & Alexanderson, Reference Soderberg and Alexanderson2003). In Norway, sick leave for the first 16 days is paid by the employers, and thereafter mandatorily covered by the Norwegian Insurance Scheme (NIS) for a period of up to 52 weeks (Gjesdal & Bratberg, Reference Gjesdal and Bratberg2003). Due to varying definitions and processes of sick leave certification, it is difficult to compare sick leave prevalence across countries. However, a recent report has investigated the trajectories of sick leave in a subset of European countries from 1990 to 2008 and found that sick leave spells are increasing in countries like Norway, Denmark, and Finland (EUROSTAT Statistics; Ose, Reference Ose2010).
In Norway, individuals aged 18 to 67 years whose work capacity is reduced by more than 50% as a cause of illness or injury are entitled to DP after relevant treatment and rehabilitation (Norwegian Official Reports (NOU), 2000). For working individuals, a sick leave period of one year is most common before DP is granted. A DP can be graded or granted full-time. In Norway between 2004 and 2010, there was also the possibility of being granted a time-limited DP. The granting of DP has steadily increased during the last decade in OECD countries (OECD, 2003), especially in younger populations (Besseling et al., Reference Besseling, Rijkenberg, Andriessen and de Vos2008), where mental disorders are the most common cause for DP (Mykletun et al., Reference Mykletun, Overland, Dahl, Krokstad, Bjerkeset, Glozier and Aaro2006).
We are only aware of one study that has investigated genetic liability to LTSL (Svedberg et al., Reference Svedberg, Ropponen, Alexanderson, Lichtenstein and Narusyte2012). In this study, which was based on a twin sample aged 43–65 and a point prevalence of LTSL, the heritability was 0.36. Knowledge about genetic and environmental contributions to LTSL in younger populations is thus currently lacking. Genetic and environmental contributions to DP have been investigated in a Finnish and Swedish twin sample (Harkonmäki et al., Reference Harkonmäki, Silventoinen, Levälahti, Pitkäniemi, Huunan-Seppälä, Klaukka and Kaprio2008, Narusyte et al., Reference Narusyte, Ropponen, Silventoinen, Alexanderson, Kaprio, Samuelsson and Svedberg2011). The heritability ranged from 0.24 to 0.48, depending on the type of diagnosis. The genetic effect was highest in younger cohorts, and, in the Swedish study (Narusyte et al., Reference Narusyte, Ropponen, Silventoinen, Alexanderson, Kaprio, Samuelsson and Svedberg2011) for the group granted DP based on a mental disorder. No study that we know of has investigated the association between genetic and environmental risk factors for LTSL and DP.
Musculoskeletal and mental disorders are the most common causes for LTSL and DP (Knudsen et al., Reference Knudsen, Overland, Hotopf and Mykletun2012, Ose, Reference Ose2010), and genetic factors are important for the liability to these disorders (Battie et al., Reference Battie, Videman, Levalahti, Gill and Kaprio2007, Kendler & Prescott, Reference Kendler and Prescott2006). In Norway, the increase in LTSL and DP does not, however, seem to be followed by a corresponding increase in the prevalence of the aforementioned disorders (Ihlebaek et al., Reference Ihlebaek, Brage and Eriksen2007, Ose, Reference Ose2010). Thus, factors apart from those influencing the risk for sickness per se can influence liability to LTSL and DP. Whether phenomena such as social transmission can explain the increasing trend is not known. If such an effect is mediated through family members — for instance, through attitudes toward medical benefits — we would expect it to appear as a significant shared environment effect in twin data (C, explained below). Another way of revealing social transmission is to test for sibling interaction effects. Sibling interaction is present if the phenotype of one sibling influences the behavior of another (Eaves, Reference Eaves1976).
The aim of the present study is to investigate the common and specific genetic and environmental contributions to the liability to LTSL and DP in young adult twins by using biometric twin modelling.
Materials and Methods
Sample
The sample for the current study originated from the Norwegian Institute of Public Health Twin Panel (NIPHTP). The twins are identified through information in the national Medical Birth Registry, which was established on January 1, 1967. The selected participants for the current study were those who had taken part in either a large questionnaire study in 1998 and/or in an interview study a few years later. By using twins who had participated in the previous studies, we were able to identify their zygosity, which was necessary for the twin analyses. The NIPHTP has been used previously in several studies (Tambs et al., Reference Tambs, Ronning, Prescott, Kendler, Reichborn-Kjennerud, Torgersen and Harris2009), and is described thoroughly elsewhere (Harris et al., Reference Harris, Magnus and Tambs2006). By using the unique national identification numbers issued to all Norwegians at birth, the data obtained from the twins who participated in the questionnaire and interview studies was linked to the following registries at Statistics Norway: The Norwegian National Education Database (NUDB), The Historical-Event Database (FD-Trygd), and the Income Register. This constituted a sample of 7,710 twins, born between 1967 and 1979.
FD-Trygd is a database containing data from the entire population (1992 and onwards) from several sources: registries at Statistics Norway; the Norwegian Labour and Welfare Organisation and the Employment Directorate; and the Norwegian Tax Administration. The database contains information regarding all social security benefits, including, for example, sickness benefits, social assistance, rehabilitation allowance, DP, and unemployment benefits (Akselsen et al., Reference Akselsen, Lien and Siverstøl2007). As the register data at Statistics Norway is updated annually, we have obtained a detailed, longitudinal dataset on the 7,710 young adult twins, including annual information on the variables listed above from 1998 to 2008. The mean age at the start of follow-up in 1998 was 25.6 years. The 7,710 twins included 3,108 pairs and 1,494 singletons. Of the complete pairs, 492 were monozygotic (MZ) males, 354 dizygotic (DZ) males, 759 MZ females, 607 DZ females, and 896 opposite sex twins. Of the singletons, 210 were MZ males, 286 DZ males, 176 MZ females, 218 DZ females, and 592 opposite sex twins. Twelve singletons were excluded from the analyses due to missing information on zygosity. In the sample, 42.1% were males, and 97.5% were employed at some point during the observation period.
Zygosity was initially determined using questionnaire items previously shown to classify correctly more than 97% of the twin pairs (Magnus et al., Reference Magnus, Berg and Nance1983), followed by DNA analyses on a subgroup of the sample. The discrepancy between classification based on the questionnaire and DNA markers implied an expected misclassification rate of approximately 2% for the whole sample, which is unlikely to bias our results (Neale, Reference Neale2003).
The linkage of data from NIPHTP with registries at Statistics Norway was approved by the Regional Ethical Committee.
Measures
After 52 weeks of sick leave, an individual who is unable to work is sometimes granted medical and/or vocational rehabilitation in order to undergo treatment or training aimed at regaining work ability (NOU, 2000). We defined LTSL as sickness absence of >16 days (the minimal sick leave period that is recorded in our dataset). We also included periods of rehabilitation in the LTSL variable, as this reflects a similar condition to LTSL. We separately summed up the total number of days of sickness absence, rehabilitation, and working days (defined as being registered as employed) in the 10-year follow-up period either up to the time of granted DP, death, or 2008. The LTSL variable was then defined as a ratio (0–100%) between the cumulative number of sick days and rehabilitation days over the cumulative number of potential working days. The LTSL proportion was further divided into four categories of approximately equal sizes, from 0 to 3, as this variable was positively skewed; 0 comprised those individuals without LTSL in the period, 1 comprised those with up to 5% LTSL in the period, 2 comprised those with 5–15% LTSL in the period, and 3 comprised those with >15% LTSL in the period. Absence of LTSL (LTSL = 0) was only defined in individuals eligible for sickness allowance, that is, at least one employment period had to be registered. A total of 187 twins were censored out from the LTSL and DP variables either due to death (34), no employment in the period (143), or for being granted DP before 2000 (10).
The DP variable comprises all twins who were granted DP before or during the follow-up period of 1998 to 2008. All types of DP were included, regardless of time limitation or grading. The information on DP was scored as follows: 0 = no DP, 1 = at least one period of graded (40–90%) DP, and 2 = only full-time (100%) DP.
Statistical Analyses
Ordinal data analyses
We used the raw ordinal data analysis option in the OpenMx software (Boker et al., Reference Boker, Neale, Maes, Wilde, Spiegel, Brick and Fox2011). This approach is based on the central limit theorem, assuming that ordered categories are imprecise indicators of an unobserved, normally distributed liability, which can be estimated as thresholds that discriminate between the categories (Falconer, Reference Falconer1965, Tallis, Reference Tallis1962). Analogous to tests of mean- and variance homogeneity for continuous data, ordinal data analysis allows us to test the equality of threshold distributions within twin pairs across sex and zygosity. Moreover, by including both complete and incomplete data, the method has the advantage of increasing the accuracy of the estimation of the thresholds, thereby improving estimation of polychoric correlations. To validate the estimation of polychoric correlations, bivariate normality tests were conducted for the variables in R (R Development Core Team, 2005).
Model fitting
In the classical twin design (Jinks & Fulker, Reference Jinks and Fulker1970; Martin & Eaves, Reference Martin and Eaves1977), individual differences in liability are assumed to arise from additive genetic (A), shared environment (C), and non-shared environment (E) sources. As MZ twins share all, and DZ twins share on average half of their segregating genes, based on theory A this would tend to make MZ twins correlate twice as high as DZ twins. C is defined as environmental factors that contribute to similarity between twins, and is further assumed to have an equal effect on MZ and DZ twins. E is by definition not shared between twins in a pair, and hence does not contribute to twin similarity. E also contains measurement error. The influence of each of these factors on the variables can be estimated using structural equation modelling (SEM; Neale & Maes, Reference Neale and Maes2000). Liability-threshold models were fitted using full information maximum likelihood (FIML) as estimation procedure to the raw data in OpenMx. If minimum regularity conditions are satisfied, the difference in -2 times log likelihood (Δ - 2LL) is asymptotically χ2 distributed, which allows testing for significant deterioration in χ2 for nested submodels. If the difference in χ2 is non-significant, the simpler, restricted model is preferred over the more highly parameterized and complex model. In addition, as an index of parsimony, Akaike Information Criterion (AIC), calculated as χ2 - 2df (Akaike, Reference Akaike1987), was also used to select the best fitting model. Preferred models are those with the lowest AIC value.
Univariate analyses
Univariate ACE models allowing for both qualitative and quantitative sex differences were first fitted to the data. Qualitative sex differences involve different genetic and/or environmental effects for males and females on the same trait, while quantitative sex effects involve the same genetic and environmental structure, but with different effect sizes for the sexes. If the observed opposite-sex DZ correlation is less than the like-sex DZ correlation, this suggests the possibility of qualitative sex differences. It is possible to test for qualitative sex differences by letting the parameter that specifies genetic correlation between the opposite-sex DZ twin pairs to vary between 0 and 0.5. Since this test (general sex limitation model) is restricted to opposite-sex pairs only, it is adequately powered only in quite large samples. Testing for quantitative sex difference (common sex limitation model) is done by allowing the A, C, and E parameter effects to differ across male and female twins and then compare the fit of this model with a model constraining the parameters to be equal across sex (no sex limitation model). After testing for sex effects, it is common to run submodels testing for significance of the A and C parameters by fixing selected parameters to be 0 in AE, CE, and E models consecutively. It is also possible to test for a sibling interaction by including a sibling interaction parameter in the MZ- and DZ-twin covariance expressions.
Multivariate analyses
With data on multiple phenotypes, it is possible to make use of additional information in the cross-twin cross-trait correlations to examine the degree of genetic and environmental overlap between the variables (see Martin & Eaves, Reference Martin and Eaves1977). A common multivariate method for this aim is the Cholesky decomposition (Neale & Cardon, Reference Neale and Cardon1992). The triangular Cholesky decomposition is a convenient method to constrain maximum likelihood estimates of genetic and environmental covariance matrices to be positive definite. A Cholesky decomposition is first specified with all three latent sources of variance: A, C, and E. It is then possible to test the fit of different submodels using likelihood ratio χ2 tests and AIC.
Results
The prevalence for all categories of LTSL >0 was 65.0% (48.8% for males and 76.9% for females); 18.4% of those who had LTSL in the period were on rehabilitation. Mean days of sick leave and rehabilitation during the 10-year period were 260.6 (median = 55.0). The total prevalence for all categories of DP >0 was 3.3% (2.1% for males and 4.1% for females). All of the individuals in our sample with DP had at least one episode of LTSL. Of the 253 individuals that had DP, we had information on the diagnosis for 171 persons. Of these, 51.0% had a mental disorder (ICD-9 290-320 or ICD-10 F00-F99). We did not investigate diagnoses for LTSL, as these would vary over episodes. Numbers of concordant and discordant pairs for either having or not having DP for MZ pairs were 17 and 43, respectively. For DZ pairs the corresponding numbers were 5 and 101. For either having or not having LTSL, the corresponding numbers were 582 and 375 for MZ pairs, and 795 and 710 for DZ pairs.
The polychoric twin–co-twin correlations for LTSL and DP are shown in Table 1. The DZ correlations for both males and females were approximately half the MZ correlations, indicating that additive genetic effects are important for explaining variance in the phenotype.
TABLE 1 Polychoric Correlations With 95% Confidence Intervals for LTSL and DP by Zygosity

LTSL = long-term sick leave; DP = disability pension.
Univariate Model Fitting
For LTSL, tests of invariance showed that thresholds could not be equated across sex. We thus proceeded by fitting an ACE model allowing for qualitative and quantitative sex differences and different thresholds for males and females. The model fitting results for LTSL are shown in Table 2. We did not find any evidence of sex differences, as removing both qualitative and quantitative sex differences (Models 2 and 3) resulted in better fitting models than the full ACE model. Model 3 was therefore used for testing the significance of A and C parameters. The C parameter could be removed without significant worsening of the fit (Model 4). However, removing the A parameter, and both A and the C parameters, resulted in significant deterioration in fit (Models 6 and 7). Finally, we fit an AE model with no sex differences, but including a parameter testing for sibling interaction (Model 5). This model did have a good fit, but did not match the AIC value obtained for Model 4. The best fitting model for LTSL was therefore an AE model with no sex differences and no sibling interaction (Δχ2 = 3.67, Δdf = 5, p = ns, AIC = 4,011.22). The additive genetic and unique environmental paths to LTSL were estimated to be 0.70 (95% CI = 0.67–0.74) and 0.71 (95% CI = 0.68–0.74), respectively. The heritability for LTSL was 0.50 (95% CI = 0.45–0.54).
TABLE 2 Univariate Model Fitting Results for LTSL
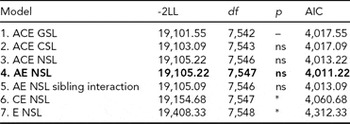
Best fitting model in bold type.
*Significant at <0.001.
LTSL = long-term sick leave; GSL = general sex limitations (allow for both qualitative and quantitative sex differences); CSL = common sex limitations (allow for quantitative sex differences); NSL = no sex limitations; ns = non-significant.
For DP, we followed the same model fitting procedure as for LTSL. The model fitting results are shown in Table 3. Removing the qualitative sex differences (Model 2) resulted in a better fit than the model allowing for both types of sex differences (Model 1). Removing the quantitative sex differences (Model 3) did not result in a significantly worse fit than for Model 2. We therefore chose to proceed with Model 3 in further comparisons. As for LTSL, the best fitting model was Model 4, an AE model with no sex differences and no sibling interaction (Δχ2 = 7.47, Δdf = 5, p = ns, AIC = -12,940.80). The additive genetic and unique environmental paths to DP were estimated to be 0.88 (95% CI = 0.80–0.93) and 0.47 (95% CI = 0.36–0.59), respectively, and the heritability was estimated to be 0.78 (95% CI = 0.65–0.87).
TABLE 3 Univariate Model Fitting Results for DP
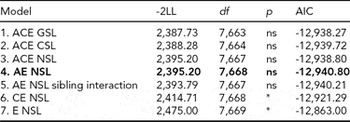
Best fitting model in bold type.
*Significant at <0.001.
DP = disability pension; GSL = general sex limitations (allow for both qualitative and quantitative sex differences); CSL = common sex limitations (allow for quantitative sex differences); NSL = no sex limitations; ns = non-significant.
Bivariate Model Fitting
In the bivariate Cholesky model, optimization problems occurred due to low prevalence of DP, which rendered fitting a full five-group model infeasible. We therefore collapsed the data into MZ and DZ twin groups without distinguishing same-sex and opposite-sex twin pairs. In order to adjust for the differences in prevalence between the sexes, we included sex as a covariate moderating the item thresholds, which is analogous to adjusting mean differences. We also reduced the number of categories from four to three for LTSL by collapsing the two middle categories (categories 1 and 2) that previously contained those with 0–5% LTSl and 5–15% LTSL, respectively, and from three to two for DP. From this data, we first fitted a full ACE model (Table 4, Model 1). We then ran AE, CE, and E submodels to test for significance of A and C parameters (Table 4).
TABLE 4 Bivariate Model Fitting Results for LTSL and DP
Best fitting model in bold type.
*Significant at <0.001.
ns = non-significant; LTSL = long-term sick leave; DP = disability pension.
The best fitting model was Model 2, an AE-model (Δχ2 = 0.55, Δdf = 3, p = ns, AIC = -14,329.35). The parameter estimates for the best fitting model are shown in Figure 1. To make the parameter estimates easier to interpret, we also reparameterized the Cholesky model into a correlated factor model. Here the additive genetic and unique environmental paths to LTSL were estimated to be 0.70 (95% CI = 0.67–0.73) and 0.71 (95% CI = 0.67–0.74), respectively, which translates into a heritability estimate of 0.49. For DP, the additive genetic and unique environmental contributions were estimated to be 0.81 (95% CI = 0.69–0.96) and 0.58 (95% CI = 0.45–0.73), providing a heritability estimate of 0.66. The genetic correlation between LTSL and DP was 0.82 (95% CI = 0.80–0.90), and the correlation between the non-shared environmental factors was 0.94 (95% CI = 0.92–0.99). The phenotypic correlation was 0.86. Genes common to both phenotypes explained 55% of the phenotypic correlation, whereas the non-shared environmental factors explained 45% of the phenotypic correlation.

FIGURE 1 Parameter estimates for long-term sick leave (LTSL) and disability pension (DP) from the best fitting bivariate model.
Discussion
The primary question addressed in the present paper was how LTSL and DP are related to genetic and environmental etiology in a population of young adult Norwegian twins. For this purpose we used objective measures of medical benefits, and thus avoided potential biases associated with standard self-reported data (Svedberg et al., Reference Svedberg, Ropponen, Lichtenstein and Alexanderson2010).
The heritability point estimate for LTSL was 0.50 in the univariate analyses and 0.49 in the bivariate analyses. The heritability obtained in the present study is somewhat higher than recently found in a Swedish twin study, where the heritability for LTSL was 0.36 (Svedberg et al., Reference Svedberg, Ropponen, Alexanderson, Lichtenstein and Narusyte2012). The differences in heritability may be explained by the different measures used as well as age differences. The Swedish study used a point prevalence of LTSL, which may include more measurement errors than the method we used, namely, capturing LTSL over a period of 10 years. In addition, the Swedish sample was older (43–65 years) than the sample in the present study, and heritability may vary between different age groups.
The heritability for DP was estimated to be 0.78 in the univariate analysis and 0.66 in the bivariate analysis. Compared to previous findings, with heritability estimates ranging from 0.24 to 0.48 (Harkonmäki et al., Reference Harkonmäki, Silventoinen, Levälahti, Pitkäniemi, Huunan-Seppälä, Klaukka and Kaprio2008, Narusyte et al., Reference Narusyte, Ropponen, Silventoinen, Alexanderson, Kaprio, Samuelsson and Svedberg2011), this is surprisingly high, as we would expect that several environmental factors, such as work conditions and health facilities, would contribute much to the liability to DP. Differences in age range may be one possible factor contributing to the differences found in heritability between the present and previous studies (birth years: 1967–1979 vs. 1925–1958, respectively). This interpretation is supported by the findings in the Swedish study (Narusyte et al., Reference Narusyte, Ropponen, Silventoinen, Alexanderson, Kaprio, Samuelsson and Svedberg2011), which show that the within-pair correlations decrease with age. In addition to age effects, cohort effects might also be present, as work conditions may vary for different age groups, and older employees may be more susceptible to LTSL and DP due to accumulated work-related stress.
For all analyses, the best fitting models were AE models, which suggest that the shared environmental contributions are not important for explaining sibling similarity or individual differences in LTSL and DP. In addition, none of the models that included a sibling interaction component produced a better fit to the data. Therefore, our findings give no support to a social transmission effect for these phenotypes within families. Further, no sex effects were found, suggesting that the same genetic and environmental factors influence the liability to LTSL and DP to the same extent for males and females. This is in accordance with previous studies (Svedberg et al., Reference Svedberg, Ropponen, Alexanderson, Lichtenstein and Narusyte2012), although indications of qualitative sex effects have been reported for DP (Narusyte et al., Reference Narusyte, Ropponen, Silventoinen, Alexanderson, Kaprio, Samuelsson and Svedberg2011).
Phenotypically there was a strong correlation between LTSL and DP. It is therefore not surprising that we also found a strong correlation between the variables’ genetic and unique environmental risk factors (rG = 0.82 and rE = 0.94). These correlations suggest that the same environmental risk factors are influencing the liability to LTSL and DP, whereas the genetic factors appear to be slightly more specific to each of the phenotypes. As can be seen in the Cholesky model (Figure 1), most of the variance in LTSL and DP is explained by the common latent factors (A1 and E1). The common genetic factor (A1) may reflect psychological traits such as pain tolerance, locus of control, self-efficacy, and personality traits such as neuroticism, in addition to somatic illnesses, mental disorders, and comorbidity. The genetic factor that was not shared between the phenotypes (A2) is noteworthy, and may be important to explain why some transit from LTSL to DP, whereas others return to work. We can only speculate what this specific genetic factor reflects, but a guess is a liability to more severe mental and somatic disorders.
We were a bit surprised to find that almost all of the unique environmental variance was shared between the variables, as these factors also contain measurement error. This finding may be explained by the fact that we used data from registries, where we assume that measurement error does not contribute much to the variance. In addition, LTSL is often a prerequisite for DP. However, it should be noted that the confidence intervals for the estimate of specific E (E2) were wide (0.00–0.35).
The notion that personality and mental disorders constitute possible risks for medical benefits, as well as for transmission from LTSL to DP, has some support, as it is found that DP due to any diagnosis can be predicted by severity of depression (Bultmann et al., Reference Bultmann, Christensen, Burr, Lund and Rugulies2008) and psychiatric comorbidity (Mykletun et al., Reference Mykletun, Overland, Dahl, Krokstad, Bjerkeset, Glozier and Aaro2006). Also, in a clinical cohort, personality disorders increased the risk for DP at least to the same extent as anxiety and depression (Korkeila et al., Reference Korkeila, Oksanen, Virtanen, Salo, Nabi, Pentti and Kivimaki2011). The importance of mental disorders is reflected in the diagnoses for granted DP in the study sample, as these constituted 51% of the diagnoses. The overall fraction in the Norwegian population for this age group was 51.5% in 2010 (Norwegian Labour and Welfare Service [NAV], 2010), which suggests that our sample is representative with regard to diagnoses underlying DP. Moreover, there is a reason to believe that this number is underestimated. For instance, a Norwegian study found that anxiety and depression were strong predictors for DP granted for somatic illnesses (Mykletun et al., Reference Mykletun, Overland, Dahl, Krokstad, Bjerkeset, Glozier and Aaro2006).
Limitations
A notable limitation in the present study is the low prevalence of granted DPs. As a consequence of the sparse DP data, model convergence problems occurred. The model comparisons are based on tests of differences in log likelihood, which can be hard to obtain when zero cells are present. For the bivariate models, we reduced both the number of zygosity groups and thresholds for each variable in an attempt to avert these problems. This simplification of the data could have introduced bias, and should be taken into account when interpreting the results.
A trend in the data of higher correlations in same-sex twins than in opposite-sex DZ twins suggests that there may be qualitative sex-specific genetic effects that we did not have power to detect. Undetected sex effects can inflate the heritability estimates. We can therefore not rule out the possibility that the estimates may have looked different had we had a larger sample.
For these analyses, it was necessary to carry out substantial pre-processing of the data for each of the phenotypes. LTSL and DP data covered a 10-year time span and were aggregated to construct the phenotypic variables. This resulted in having to collapse across different time periods, as well as possibly heterogeneous trajectories, particularly for DP. Such complex longitudinal data leaves open the possibility of carrying out additional analyses that examine the time-dependent nature of the data, which may provide a more detailed and possibly different picture of the etiologies underlying the phenotypes.
In the present study we found differences in heritability between the univariate and bivariate analyses for LTSL and DP. However, this was not unexpected, and may be due to the differences in the number of thresholds and collapsing of zygosity groups. Conducting bivariate twin analyses may help stabilize the estimates of low-prevalent traits as we can rely on cross-twin cross-trait correlations as well as twin correlations.
Expressed macro-level traits, such as the two investigated here, are the result of a complicated interplay between genes and environments, for instance in form of gene–environment correlation (rGE) and gene–environment interaction (G × E; Jaffee and Price, Reference Jaffee and Price2007). For most complex traits, we cannot yet claim to have an in-depth understanding of the causal paths leading from a genetic potential to the resulting trait. It is therefore possible that the estimates obtained would have looked somewhat different had we been able to test for these effects.
We used a sample of young adult Norwegian twins. The results may thus not be representative for other populations and age cohorts. As noted when comparing our results to the Finnish and Swedish studies of DP, the genetic factors involved may vary as a function of age. Another potential limitation is that DP may be correlated with age. In our sample the polychoric correlation between age and DP was -0.13. Although this is a low correlation, it may have inflated twin correlations because co-twins have the same age. Thus, we would expect an inflated estimate of shared environment (C). However, as we found no evidence of C, such an inflation cannot have been important.
In summary, we found evidence indicating substantial heritability for both LTSL and DP in our data, and no evidence of shared environmental or social transmission effects. Our main finding was that the genetic and environmental risk factors for LTSL and DP overlapped to a strong degree, with the exception of a genetic factor that distinguishes LTSL from DP. Given that DP grants based on mental disorders are quite prevalent in this age group, future research should investigate association between these disorders and LTSL and DP.
Acknowledgments
The work was supported by a grant from the Sickness Absence Research Programme at the Norwegian Research Council. Data on zygosity on the twins used in this study was obtained from the Norwegian Twin Registry and the Norwegian Institute of Public Health. The work was also in part supported by NIH grant MH-068643. We are very grateful to the twins for their participation.


